It looks like you're using an Ad Blocker.
Please white-list or disable AboveTopSecret.com in your ad-blocking tool.
Thank you.
Some features of ATS will be disabled while you continue to use an ad-blocker.

Quake Watch 2011
page: 406share:
reply to post by ahoecmd
Excellent!, thats the one
has all the F-E sub regions.
I guess PM and I were too cheap to pay the purchase price.
Many thanks and a thousand stars and flags for you
I've saved it on my computer.
Excellent!, thats the one
has all the F-E sub regions.
I guess PM and I were too cheap to pay the purchase price.
Many thanks and a thousand stars and flags for you
I've saved it on my computer.
reply to post by ahoecmd
Thanks for the links and to the PDF, oh and Welcome to ATS and Quake Watch.
I won't give you all the spiel since if you can produce those maps out of a hat i guess you know what it is all about!
My concern is that even with the 52 regions there may be some problems and I was looking for a map on which i could overlay the co-ordinates when you kindly provided the link.
Anyway that saves me doing that so I shall delve into it now.
Being a Sociology and Psychology geek, the responses of the population is something that interests me.
It would be interesting to see how the population number has changed over the last year, and see how that progresses.
We could see Christchurch become a ghost town over the next five to ten years.
It would be interesting to see how the population number has changed over the last year, and see how that progresses.
We could see Christchurch become a ghost town over the next five to ten years.
reply to post by PuterMan
Now we have the sub regions thanks to ahoecmd in the post here
ahoecmd's link again
no need to start from scratch, having looked at a couple of pages eg South Island of NZ is mostly F-E162 which makes sense as its the Pacific Plate side, but the lower part (of the South Island) is F-E161 which catches the southern part of Fiordland and the Puysegur Trench and Bank on the Australian Plate which is siesmically different,
and on the Australia Map you have the coast of NSW and Victoria as a seperate region to South Australia coast which do feature as independant siesmic areas when you check the GeoAu web site
I think they got it right in 1995 with the big revision
Now I can put in the F-E number for the only page I have done so far, for Vanuatu, F-E186, and know that the Loyalty Islands although very close to the area is a seperate F-E region worthy of its own page. I have even had to break Vanuatu down into North and South to get full coverage of events, not sure if they are seismically separate or not at this stage.
I've done some work on the Southern East Pacific Rise as well, but haven't published it yet, looks like it F-E684 that I covered but I'll have to check back on some USGS event pages to confirm that.
How many regions? 754
looks like a lifetimes work to investigate them all, and I'm 5/8 the way through mine (liftime)
That pdf converted into a KML file useable on Google Earth would be handy I wonder if anyone is working on it
Now we have the sub regions thanks to ahoecmd in the post here
ahoecmd's link again
no need to start from scratch, having looked at a couple of pages eg South Island of NZ is mostly F-E162 which makes sense as its the Pacific Plate side, but the lower part (of the South Island) is F-E161 which catches the southern part of Fiordland and the Puysegur Trench and Bank on the Australian Plate which is siesmically different,
and on the Australia Map you have the coast of NSW and Victoria as a seperate region to South Australia coast which do feature as independant siesmic areas when you check the GeoAu web site
I think they got it right in 1995 with the big revision
Now I can put in the F-E number for the only page I have done so far, for Vanuatu, F-E186, and know that the Loyalty Islands although very close to the area is a seperate F-E region worthy of its own page. I have even had to break Vanuatu down into North and South to get full coverage of events, not sure if they are seismically separate or not at this stage.
I've done some work on the Southern East Pacific Rise as well, but haven't published it yet, looks like it F-E684 that I covered but I'll have to check back on some USGS event pages to confirm that.
How many regions? 754
looks like a lifetimes work to investigate them all, and I'm 5/8 the way through mine (liftime)
edit on 23-12-2011 by muzzy because: (no
reason given)
That pdf converted into a KML file useable on Google Earth would be handy I wonder if anyone is working on it
edit on 23-12-2011 by muzzy
because: (no reason given)
reply to post by detachedindividual
I have run into a few tradesmen who left Christchurch after the Sumner Feb 6.3 who moved up here to Wellington, their own houses Red Stickered for demolition and the contract repair work that would have kept them employed floundering in Red Tape. They said they will return when things start moving on the rebuild, but every time there is a big quake like yesterday the timeline for that drags out further.
I'm sure there will be some that will never return, but there are others who have employment that is not affected who will stay. I have two 2nd cousins down there who are staying, one an Electrician the other a Cabinetmaker.
It would take a Mag 8 to turn it into a ghost town.
On a lighter note, perhaps the Crusaders (rugby team) should change their strip from lBack and Red to Flouresant vest Red and Green
edit
on 23-12-2011 by muzzy because: (no reason given)
here's another one
haven't seen it posted
Magnitude mb 5.3
Region OFF E. COAST OF S. ISLAND, N.Z.
Date time 2011-12-23 17:37:29.0 UTC
Location 43.68 S ; 173.03 E
Depth 2 km
Distances 36 km SE Christchurch (pop 363,926 ; local time 06:37:29.1 2011-12-24)
45 km SE Kaiapoi (pop 10,837 ; local time 06:37:29.1 2011-12-24)
14 km N Akaroa (pop 628 ; local time 06:37:29.1 2011-12-24)
Source parameters not yet reviewed by a seismologist
Rainbows....without eq's for NZ please
Jane
reply to post by muzzy
The point is that the 757 regions are geographic and NOT seismic regions although they may relate in some cases. The seismic region for NZ is 11 and that includes Macquarie Island which I don't think is the same seismic region as the North Island, at least as far as stress calculations go.
Similarly in PNG, the geographic regions split the seismic area as I have mentioned. 202 is NOT a seismic region on it's own and neither is 201, yet together they might be. These all come under the seismic region 16 - New Guinea. It is quite obvious to me however that you cannot classify these all together for stress. They are different plate boundaries and different zones.
Area 14, Vanuatu lumps in Santa Cruz, in my view incorrectly as SC is on a different plate section to the rest. There is a convergent junction between it and Vanuatu and this can be clearly be seen to be different by the abrupt cut off of the volcanoes immediately on encountering the convergent area. If this was the case, that the Vanuatu and Santa Cruz Islands were in the same seismic zone, then my graph of stress for SC that I did a while ago would not have shown such a clear picture.
There seems to be some reference to the smaller areas being seismic, such as in this statement from the referenced PDF:
692 is of course a geographic region and not a seismic region.
Overall I am not convinced that seismically the 50 regions are sufficiently fine for the purpose that I need them, and to be fair they do say that these are a course division, however I am also not convinced that the 757 (754) regions are seismically defined as I have already demonstrated they are not. I am still going to have to define my own version of the sub divisions by the look of it.
ETA:
Red and Green vests. The colours of (The Republic of) Mayo. It was a republic for about 9 months back in the 1600s but the Brits did not allow THAT to remain too long!
ETA again:
Since I have all the boundaries on the database it should not be too difficult to produce an overlay, but I don't know how just yet. I will be working on it sometime in amongst the million other things I still need to do before I die, with only maybe if I am lucky a third of my lifetime left to go and quite possibly less than that!
On the other hand I have sworn blind that I ain't going anywhere until I am good and ready so if I have my way I am only halfway through my lifetime. It is a state of mind and I am not ready to give up.
South Island of NZ is mostly F-E162 which makes sense as its the Pacific Plate side, but the lower part (of the South Island) is F-E161 which catches the southern part of Fiordland and the Puysegur Trench and Bank on the Australian Plate which is siesmically different,
and on the Australia Map you have the coast of NSW and Victoria as a seperate region to South Australia coast which do feature as independant siesmic areas when you check the GeoAu web site
The point is that the 757 regions are geographic and NOT seismic regions although they may relate in some cases. The seismic region for NZ is 11 and that includes Macquarie Island which I don't think is the same seismic region as the North Island, at least as far as stress calculations go.
Similarly in PNG, the geographic regions split the seismic area as I have mentioned. 202 is NOT a seismic region on it's own and neither is 201, yet together they might be. These all come under the seismic region 16 - New Guinea. It is quite obvious to me however that you cannot classify these all together for stress. They are different plate boundaries and different zones.
Area 14, Vanuatu lumps in Santa Cruz, in my view incorrectly as SC is on a different plate section to the rest. There is a convergent junction between it and Vanuatu and this can be clearly be seen to be different by the abrupt cut off of the volcanoes immediately on encountering the convergent area. If this was the case, that the Vanuatu and Santa Cruz Islands were in the same seismic zone, then my graph of stress for SC that I did a while ago would not have shown such a clear picture.
There seems to be some reference to the smaller areas being seismic, such as in this statement from the referenced PDF:
This region is another example of how Flinn and Engdahl (1965) failed to accurately define a known tectonic feature. The feature is the West Chile Rise partly defined by Region 686, West Chile Rise, but some of the seismicity occurs to the south in Region 692, Southern Pacific Ocean. The region is in two parts and removes the earthquakes associated with the tectonic activity from region 692 which remains classed as aseismic. The seismic region remains as 43. Fig. 10 illustrates the reason for this region.
692 is of course a geographic region and not a seismic region.
Overall I am not convinced that seismically the 50 regions are sufficiently fine for the purpose that I need them, and to be fair they do say that these are a course division, however I am also not convinced that the 757 (754) regions are seismically defined as I have already demonstrated they are not. I am still going to have to define my own version of the sub divisions by the look of it.
ETA:
Red and Green vests. The colours of (The Republic of) Mayo. It was a republic for about 9 months back in the 1600s but the Brits did not allow THAT to remain too long!
ETA again:
That pdf converted into a KML file useable on Google Earth would be handy I wonder if anyone is working on it
Since I have all the boundaries on the database it should not be too difficult to produce an overlay, but I don't know how just yet. I will be working on it sometime in amongst the million other things I still need to do before I die, with only maybe if I am lucky a third of my lifetime left to go and quite possibly less than that!
On the other hand I have sworn blind that I ain't going anywhere until I am good and ready so if I have my way I am only halfway through my lifetime. It is a state of mind and I am not ready to give up.
edit on 23/12/2011 by PuterMan because: (no reason given)
reply to post by PuterMan
Yeah you are right some F-E numbers (rectangles) apply to seismic areas others don't.
It might be better to ignore the overall 51 regions and go with the 754.
Sure is complicated in the South Pacific/Southern Ocean. with no islands to get reference co-ordinates, if you took the pdf maps and overlaid with lat and long grids it would still be pretty vague.
reply to post by detachedindividual
With a PhD in clinical psych, I'm also interested in those issues and factors.
Please let me know by U2U if you come across such data.
THX IN ADVANCE.
With a PhD in clinical psych, I'm also interested in those issues and factors.
Please let me know by U2U if you come across such data.
THX IN ADVANCE.
reply to post by muzzy
I have been going through and creating a table of the 754 numbers and the 50 numbers they belong to together with the names - a spreadsheet version of the appendix really.
I can also see some distinct sub seismic regions so I have created another column to reference those. Where a distinct sub region appears (and I will mark them all eventually) it would be like SR19
FE, SR, Sub, Name
217 19 191 Kamchatka Peninsula. Russia
218 19 191 Near East Coast Of Kamchatka
219 19 191 Off East Coast Of Kamchatka
220 19 192 Northwest Of Kuril Islands
221 19 192 Kuril Islands
222 19 192 East Of Kuril Islands
223 19 193 Eastern Sea Of Japan
224 19 193 Hokkaido. Japan Region
225 19 193 Off Coast Of Hokkaido. Japan
226 19 194 Near West Coast Of Honshu. Japan
227 19 194 Eastern Honshu. Japan
228 19 194 Near East Coast Of Honshu. Japan
229 19 194 Off East Coast Of Honshu. Japan
230 19 194 Near S. Coast Of Honshu. Japan
Thus SR 19, which comprises the FE regions 217 to 230 inclusive also has 4 sub regions.
SR191 contains 217 to 219 inclusive, etc, etc.
This is going to be the fastest way to get the data regionalised for my end of year report, and then next year I can look at finer sub-divisions. Never do today what you can put off until tomorrow - Taurus motto.
Originally posted by detachedindividual
Being a Sociology and Psychology geek, the responses of the population is something that interests me.
It would be interesting to see how the population number has changed over the last year, and see how that progresses.
We could see Christchurch become a ghost town over the next five to ten years.
I think you underestimate the resiliance of us Cantabrians. I do have friends that have moved since the 6.3 - some to Oz, some to other places in NZ. For some strange reason our first reaction wasn't to run or move to leave NZ, it was to stay and help out. This has been the reaction of many. It will take a much bigger event for Chch to be abandonded. I fear that big event may be the Alpine Fault as, while it may not affect Chch quite as much it will affect the entire infrastructure of the South Island and probably Wellington too.
65 aftershocks from Christchurch so far with 2 hrs to go to the end of the 24hrs.
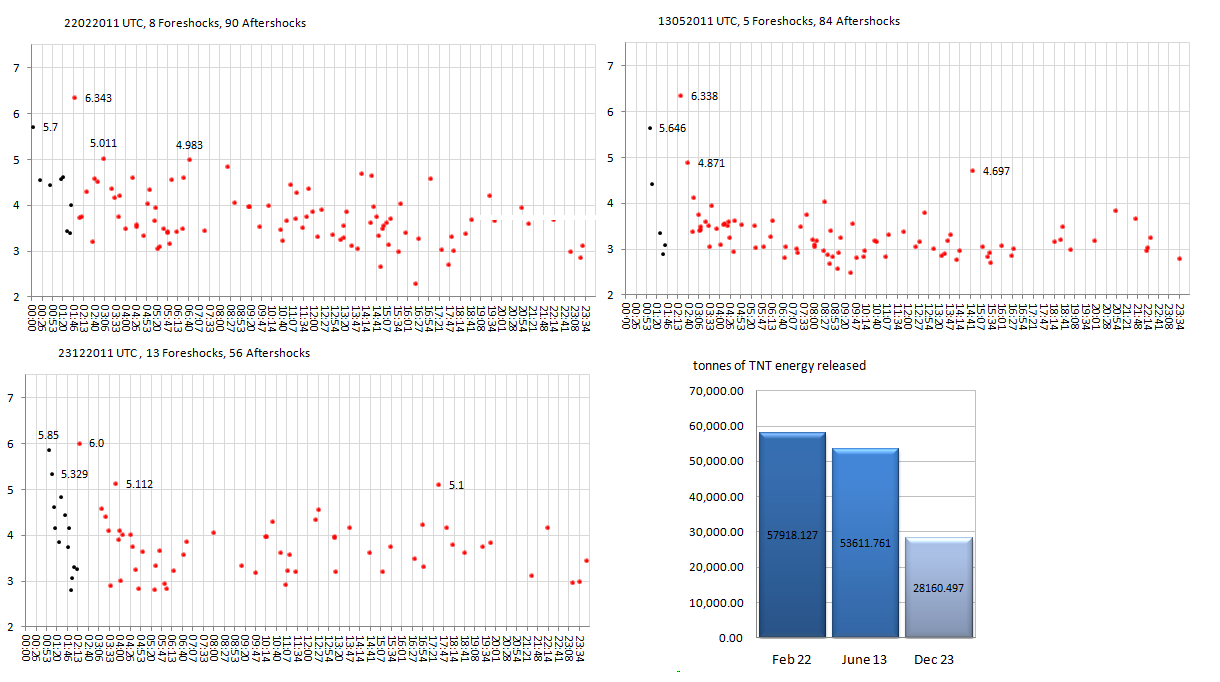
just comparing this one with the Feb 22 and the June 13th quakes
All 3 had reasonably big foreshocks
All 3 occured in the early afternoon local time
The first 2 had roughly the same number of aftershocks to the end of the day.
01:50:25 Feb 22 - 5.7 foreshock 1 hr 6 minutes prior 5.89 mainshock, later revised to 6.343, 95* aftershocks to 24:00:00, 92* to 22:15:38
02:20:49 June 13 - 5.646 foreshock 1hr 19 minutes prior, mainshock 6.338, 91* aftershocks to 24:00:00, 89* to 22:14:21
02:18:04 Dec 23 - 5.85 foreshock 1 hr 10 minutes prior, mainshock 6.0 (preliminary) 65 aftershocks to 22:15:16
yesterdays magnitude may come back revised slightly higher, like the others did, but based on the number of aftershocks I'd be surprised if it was more than 6.2
unless there are 25 more in the next 2 hrs
* the numbers of Feb and June are from the preliminary data I downloaded the next day, and was revised later with many more aftershocks listed, but for this comparison you can't compare preliminary numbers with revised numbers.
I probably won't download again until about 5pm local time, give Geonet a chance to consolidate the figures, I have seen half a dozen slip in between earlier ones since yesterday afternoon.
I can feel 3 timeline graphs coming on
just comparing this one with the Feb 22 and the June 13th quakes
All 3 had reasonably big foreshocks
All 3 occured in the early afternoon local time
The first 2 had roughly the same number of aftershocks to the end of the day.
01:50:25 Feb 22 - 5.7 foreshock 1 hr 6 minutes prior 5.89 mainshock, later revised to 6.343, 95* aftershocks to 24:00:00, 92* to 22:15:38
02:20:49 June 13 - 5.646 foreshock 1hr 19 minutes prior, mainshock 6.338, 91* aftershocks to 24:00:00, 89* to 22:14:21
02:18:04 Dec 23 - 5.85 foreshock 1 hr 10 minutes prior, mainshock 6.0 (preliminary) 65 aftershocks to 22:15:16
yesterdays magnitude may come back revised slightly higher, like the others did, but based on the number of aftershocks I'd be surprised if it was more than 6.2
unless there are 25 more in the next 2 hrs
* the numbers of Feb and June are from the preliminary data I downloaded the next day, and was revised later with many more aftershocks listed, but for this comparison you can't compare preliminary numbers with revised numbers.
edit on 23-12-2011 by muzzy because: (no reason given)
I probably won't download again until about 5pm local time, give Geonet a chance to consolidate the figures, I have seen half a dozen slip in between earlier ones since yesterday afternoon.
I can feel 3 timeline graphs coming on
edit on 23-12-2011 by muzzy because: (no reason given)
Got way laid weeding the garden
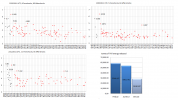
heres the 3 graphs of the Mag 6's at Christchurch for comparison
BTW I had my totals wrong on the last post, counted the whole days number minus the mainshock, instead of the aftershocks themselves
Only time will tell if the latest one gets revised, I was expecting the energy released to be about the same as the others, because there were more mag 5's involved, but no.
edit on 24-12-2011 by muzzy because: (no reason given)
reply to post by detachedindividual
Just as a matter of interest since you are the psychologist and I am most definitely not, do you base your premise on similar events elsewhere in the world and if so perhaps you could define where?
I am guessing, and I do mean guessing as I don't know, that even after the biggest earthquakes people just pick up and carry on. I personally am not aware of any city, town or village that has become a ghost town as the result of earthquakes.
It would actually be quite interesting to know.
Humans live in some very difficult places. If it were the nature of the beast to pack up and go this would not happen. Inhospitable places would not be inhabited, but they are. The pioneers would never have pioneered if this was the case.
Now I will agree that the indomitable human spirit is being worn down by leftie namby-pamby nanny state liberal attitudes in the West, but for most of the world I believe the will of the species to survive in the weirdest places still drives us on.
Edit to add: I am thinking that this applies to all disasters actually.
We could see Christchurch become a ghost town over the next five to ten years.
Just as a matter of interest since you are the psychologist and I am most definitely not, do you base your premise on similar events elsewhere in the world and if so perhaps you could define where?
I am guessing, and I do mean guessing as I don't know, that even after the biggest earthquakes people just pick up and carry on. I personally am not aware of any city, town or village that has become a ghost town as the result of earthquakes.
It would actually be quite interesting to know.
Humans live in some very difficult places. If it were the nature of the beast to pack up and go this would not happen. Inhospitable places would not be inhabited, but they are. The pioneers would never have pioneered if this was the case.
Now I will agree that the indomitable human spirit is being worn down by leftie namby-pamby nanny state liberal attitudes in the West, but for most of the world I believe the will of the species to survive in the weirdest places still drives us on.
Edit to add: I am thinking that this applies to all disasters actually.
edit on 24/12/2011 by PuterMan because: (no reason given)
I have been considering the FE regions overnight and have accepted that - at least for the time being - these regions were devised by people who know
much more about the subject than I do despite the fact that the regions are nearly 30 years younger than me!
I still think that subdivisions are needed, but again for the time being this will be have to be a concatenation of the geographic subdivisions within the seismic areas.
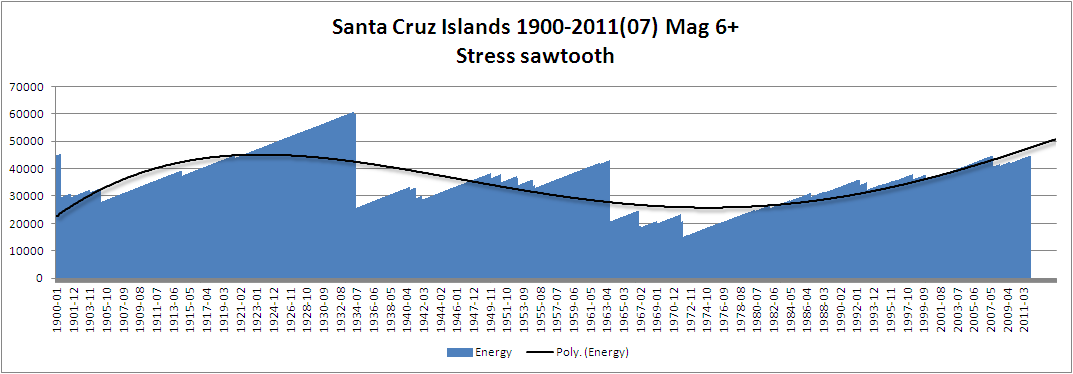
So, what does this do to my graph for the Santa Cruz Islands as the selected area has changed moderately based on the FE regions.
On my previous model based on ANSS 1963 to 2010 there was no likelihood of a large quake until around 2018. This has changed and there is the possibility of a large quake in the immediate future based on the pattern of the FE areas.

This is based on the USGS Centennial Mag 6+ from 1900 to 2001, and then the ANSS database from 2001 to 2011 (July) again of course Mag 6+
The big drop in the 1930s (1934) was caused by these:
Source: USGS Centennial Catalog
There were two rapid fire Mag 7.5 Mw in 1963 (September) within 2 days of each other (is this a common feature here I ask looking at 1934.
If, and only if the period of the larger quakes is 30 years then in theory there should have been an event (or 2) around 1994.
The graph is based on the following:
TotalEnergy, PeriodicEnergy, MaxPeriod, MinPeriod
138425.7682 102.9953633 34441.15953 0
The stress at July 2011 based on Mag 6 only is at 44155 TJ which as you can see is well over the Max in any one period which was in 1934.
I start the stress value at the value of the Maximum period energy * 1.3 to allow for the fact that prior to the selected period is unknown. There could have been a mag 8 for example which would throw this out completely!
It is, like all good climate models, a complete guess for the starting point however there is some reasoning as the figure used means that at no time in the range to we encounter negative stress.
As it happens the current stress build up is almost exactly at Max * 1.3
Based on the above I flag Santa Cruz as a red zone for a 7.5 to 7.8 in the next year.
Edit to add:
@TA - you were mentioning aftershock magnitudes a few posts back and that two quakes were too close together fro one to be an aftershock of the other. Just thinking out loud here since the Santa Cruz quakes are curious.
The 7.8 and 7.1 in 1934 were 99 miles apart. Was the 7.1 an aftershock of the 7.8?
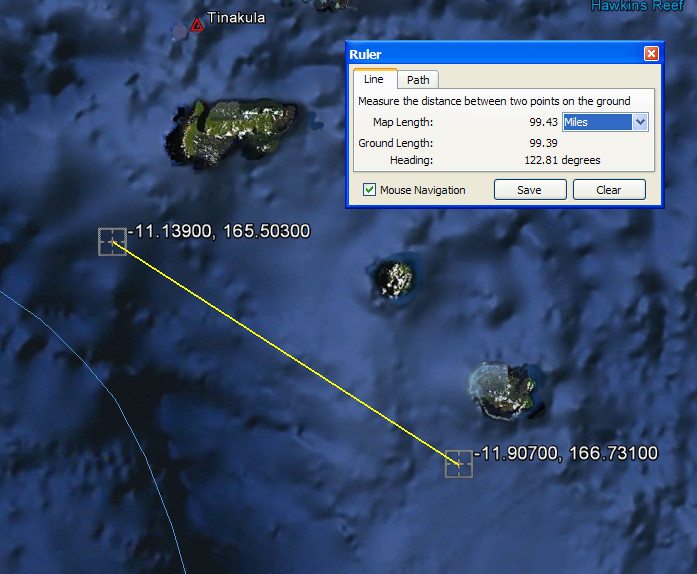
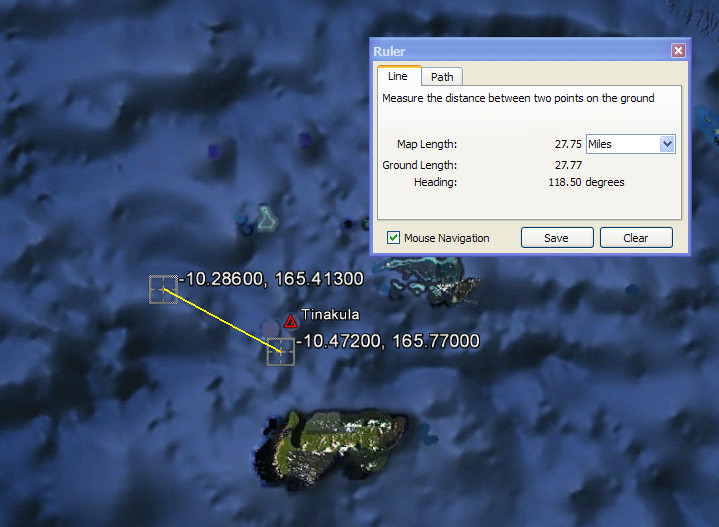
Then in 1963 the two quakes were just 27 miles apart and BOTH were 7.5. 2 main shocks, or main shock and aftershock?
I still think that subdivisions are needed, but again for the time being this will be have to be a concatenation of the geographic subdivisions within the seismic areas.
So, what does this do to my graph for the Santa Cruz Islands as the selected area has changed moderately based on the FE regions.
On my previous model based on ANSS 1963 to 2010 there was no likelihood of a large quake until around 2018. This has changed and there is the possibility of a large quake in the immediate future based on the pattern of the FE areas.
This is based on the USGS Centennial Mag 6+ from 1900 to 2001, and then the ANSS database from 2001 to 2011 (July) again of course Mag 6+
The big drop in the 1930s (1934) was caused by these:
1934-07-18T19:40:23.950Z -11.90700 166.73100 7.8000 Mw 35.0000
1934-07-21T06:18:23.290Z -11.13900 165.50300 7.1000 Mw 35.0000
Source: USGS Centennial Catalog
There were two rapid fire Mag 7.5 Mw in 1963 (September) within 2 days of each other (is this a common feature here I ask looking at 1934.
If, and only if the period of the larger quakes is 30 years then in theory there should have been an event (or 2) around 1994.
The graph is based on the following:
TotalEnergy, PeriodicEnergy, MaxPeriod, MinPeriod
138425.7682 102.9953633 34441.15953 0
The stress at July 2011 based on Mag 6 only is at 44155 TJ which as you can see is well over the Max in any one period which was in 1934.
I start the stress value at the value of the Maximum period energy * 1.3 to allow for the fact that prior to the selected period is unknown. There could have been a mag 8 for example which would throw this out completely!
It is, like all good climate models, a complete guess for the starting point however there is some reasoning as the figure used means that at no time in the range to we encounter negative stress.
As it happens the current stress build up is almost exactly at Max * 1.3
Based on the above I flag Santa Cruz as a red zone for a 7.5 to 7.8 in the next year.
Edit to add:
@TA - you were mentioning aftershock magnitudes a few posts back and that two quakes were too close together fro one to be an aftershock of the other. Just thinking out loud here since the Santa Cruz quakes are curious.
The 7.8 and 7.1 in 1934 were 99 miles apart. Was the 7.1 an aftershock of the 7.8?
Then in 1963 the two quakes were just 27 miles apart and BOTH were 7.5. 2 main shocks, or main shock and aftershock?
edit on 24/12/2011 by PuterMan because: (no reason given)
reply to post by PuterMan
This psychologists finds your points quite apt.
Factors probably involved, imho . . .
1. MOST sane, remotely mature and integrated folks probably have an abiding inclination to rebuild; make the best of it; get on with life.
2. There's often not a lot of MEANS to do anything else. There's not some wonderously attractive, very welcoming other place and a free ticket to get there.
3. There's a wonderful pulling together of the CAN-DO folks after a tragedy. The sense of community and camaraderie increases significantly, imho.
4. The suck-up-to-the-public-trough--insecure, immature, lazy, selfish, thoughtless, addicted to their sugar-tits sorts of folks are a drag before a tragedy, during a tragedy and after a tragedy. They seem to be stuck on chronic and automatic !WHINE! . . . as well as stuck on !DEMANDING! that SOMEBODY make them comfortable and fix all their fears . . . along with blaming anyone but themselves for their distresses.
5. As the saying goes . . . problems make us bitter or better. Bitter is a spiral down. Amazing percentages of folks seem to be stuck in that spiral.
reply to post by PuterMan
very interesting, we will have to wait and see then
I do wonder if there is a limit on magnitude some areas may get, like there may never be a Mag 8 in the Santa Cruz area due to the geology.
As far as NZ goes just the one Mag 8 in 157 years. Does this mean the re- occurance period is 157 years plus? or it may even be every 2000 years (I note these kind of periods are in the NZ Faults Database on individual fault details). Not sure where they get the "we are overdue" theory from, my memory is going, 157 years is as much as it can handle.
I thought I had posted these when I finished them, but can't find them on my ATS or Dropbox Folders, so I can't have. Maybe I was waiting until the
end of the year. Oh well, sneak preview on ATS
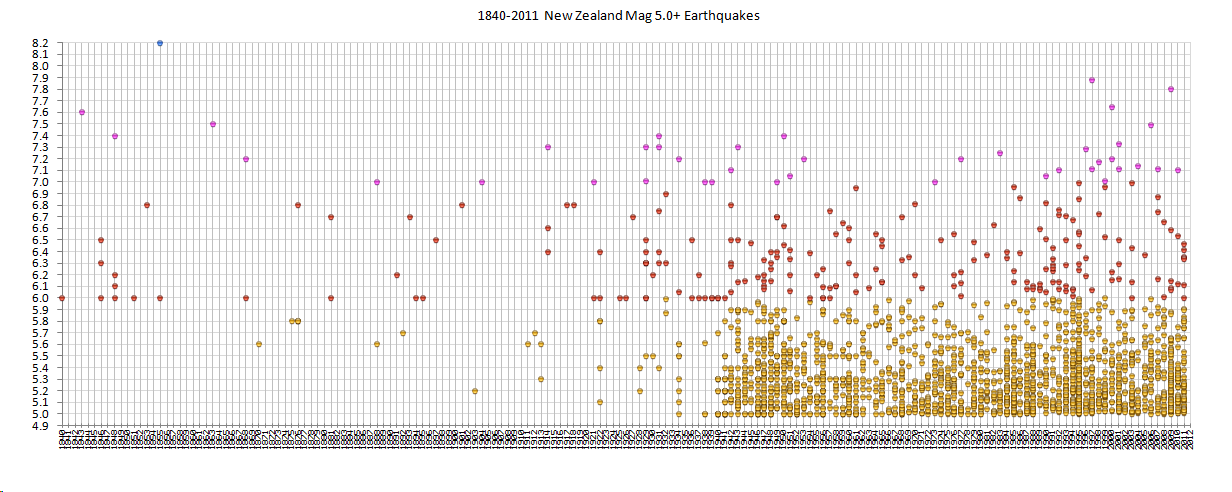
All NZ quakes 1840-2011 above Mag 5 Timeline graph

The bunching of Mag 5's after 1930 obviously reflects the improvement in earthquake monitoring after the big Napier quake in that year.
1840-2011 Numbers Count, Mag 5+
The bars with the orange/reddish fill with pink tips are years that had a Mag 7 in them.
The graph shows that you don't have to have a Mag 7 to get high number counts, that 114 count is 1995 from the offshore East of East Cape swarm. The biggest quake in that was 6.9.
Also coincidentally 1995 Mt Ruapehu was erupting, haven't looked into that yet to see if there is any match with the earthquake numbers/eruptions.
A lot more mag 5's in 2009 from the Dusky Sound 7.3 (7.6Mw) than 2010 Darfield 7.1
I'll update it sometime in the next 5 days and publish it on the revised NZ Historic Quakes blog which I plan to move from Blogger to Wordpress, so I can create categories easier, and go interactive.
All NZ quakes 1840-2011 above Mag 5 Timeline graph
The bunching of Mag 5's after 1930 obviously reflects the improvement in earthquake monitoring after the big Napier quake in that year.
1840-2011 Numbers Count, Mag 5+

The bars with the orange/reddish fill with pink tips are years that had a Mag 7 in them.
The graph shows that you don't have to have a Mag 7 to get high number counts, that 114 count is 1995 from the offshore East of East Cape swarm. The biggest quake in that was 6.9.
Also coincidentally 1995 Mt Ruapehu was erupting, haven't looked into that yet to see if there is any match with the earthquake numbers/eruptions.
A lot more mag 5's in 2009 from the Dusky Sound 7.3 (7.6Mw) than 2010 Darfield 7.1
I'll update it sometime in the next 5 days and publish it on the revised NZ Historic Quakes blog which I plan to move from Blogger to Wordpress, so I can create categories easier, and go interactive.
edit on 24-12-2011 by muzzy because: (no reason given)
Wow, what a wonderful place ATS is!!!
Where else can you learn geology, sociology, meteorology & vocabulary all on one site???
***Mr. PM***, 'concatenation' is my new favorite word! I had never heard it before! I even like saying it!
That would be a good scrabble word. Except if I had that many letters, I am probably already in trouble, not to mention the odds of fitting it in anywhere! My all time favorite, since I was a kid & ran across it in the dictionary, is 'syzygy'!
On the subject of relocation. My grandkids are the 6th generation to have lived here, on what used to be my great grandparents farm. It would be pretty hard to leave all the family history & memories! Not to mention, how do you leave behind everything that you've worked for your entire life & start over from scratch? Even if you had the means.
I think it would be the hardest for people on the down side of the hill of life!
But then again, younger people, who might not have as many qualms about moving & want to keep their children safe, probably have mortgages. How do you relocate, find another job, pay rent or a mortgage, plus the mortgage from the place you left? Because, you know, even if you have some kind of disaster insurance, what are the odds of seeing enough from it to repair everything? If you are lucky enough to see any of it, how long will it take to get it?
The average Joe couldn't swing it! Of course, if your place is destroyed, that's a whole different story!
Then you had better hope for very generous relatives that are living somewhere else!
People nowadays are so tied to their 'stuff'! You can't just put everything in a wagon & head for greener pastures.
Plus all the greener pastures are already owned by someone else!
I think people fear the unknown, resist change, & will tough out a disaster, feeling safer with a tough 'known' & hoping for the best. They think it couldn't happen again in their lifetime! Especially if there is no known history in the area. Normalcy bias?
Of course, that begs a new question, how many tough situations does it take to wear people down? Probably the more optimistic & tougher you are, the longer you stay?
***Eric***Glad to see you were able to check in! I've been checking the YS seismos. Last night only a third of them were up, but they were empty. It was that way for at least the half hour while I was checking. Then they all were back but only a few had a trace on them. I remembered the time difference & figured they were changing over. It was 2 AM here, so midnight I think there. That would be just the time something would happen too!
But today the link won't come up at all! They shut everything down & left for the holidays???
Those eqs in Ohio are pretty close to me. Too close! I have friends near there too. I'll have to ask if they felt anything.
****** "MERRY CHRISTMAS" ****** to everyone west of the Date Line! And to everyone else tomorrow!!!!!*************
WOQ
The YS seismos are back up! Weird!
Now USGS is showing a 2.0 quake in VA less than an hour after the 2.4 in OH. They are on two sides of me now!
edit on 24-12-2011 by
wasobservingquietly because: (no reason given)
new topics
-
What is the white pill?
Philosophy and Metaphysics: 52 minutes ago -
Mike Pinder The Moody Blues R.I.P.
Music: 1 hours ago -
Putin, Russia and the Great Architects of the Universe
ATS Skunk Works: 4 hours ago -
A Warning to America: 25 Ways the US is Being Destroyed
New World Order: 9 hours ago
top topics
-
President BIDEN's FBI Raided Donald Trump's Florida Home for OBAMA-NORTH KOREA Documents.
Political Conspiracies: 14 hours ago, 33 flags -
A Warning to America: 25 Ways the US is Being Destroyed
New World Order: 9 hours ago, 18 flags -
Is AI Better Than the Hollywood Elite?
Movies: 16 hours ago, 4 flags -
Mike Pinder The Moody Blues R.I.P.
Music: 1 hours ago, 4 flags -
What is the white pill?
Philosophy and Metaphysics: 52 minutes ago, 3 flags -
Putin, Russia and the Great Architects of the Universe
ATS Skunk Works: 4 hours ago, 2 flags -
Maestro Benedetto
Literature: 16 hours ago, 1 flags
active topics
-
Mood Music Part VI
Music • 3109 • : TheWoker -
Candidate TRUMP Now Has Crazy Judge JUAN MERCHAN After Him - The Stormy Daniels Hush-Money Case.
Political Conspiracies • 791 • : matafuchs -
Meadows, Giuliani Among 11 Indicted in Arizona in Latest 2020 Election Subversion Case
Mainstream News • 22 • : xuenchen -
President BIDEN's FBI Raided Donald Trump's Florida Home for OBAMA-NORTH KOREA Documents.
Political Conspiracies • 28 • : TzarChasm -
Gaza Terrorists Attack US Humanitarian Pier During Construction
Middle East Issues • 64 • : DBCowboy -
So this is what Hamas considers 'freedom fighting' ...
War On Terrorism • 263 • : ToneD -
What is the white pill?
Philosophy and Metaphysics • 1 • : Astyanax -
A Warning to America: 25 Ways the US is Being Destroyed
New World Order • 21 • : MetalThunder -
Truth Social goes public, be careful not to lose your money
Mainstream News • 133 • : Astyanax -
New whistleblower Jason Sands speaks on Twitter Spaces last night.
Aliens and UFOs • 70 • : baablacksheep1