It looks like you're using an Ad Blocker.
Please white-list or disable AboveTopSecret.com in your ad-blocking tool.
Thank you.
Some features of ATS will be disabled while you continue to use an ad-blocker.

Quake Watch 2011
page: 408share:
reply to post by this_is_who_we_are
Too bad the RAS couldn't take a minute to publish what they have on their own web site.
as of right now there is nothing there
www.ceme.gsras.ru...
(you have to change the date to the correct one, its a spam filter so bots don't get in)
Too bad the RAS couldn't take a minute to publish what they have on their own web site.
as of right now there is nothing there
www.ceme.gsras.ru...
(you have to change the date to the correct one, its a spam filter so bots don't get in)
You know the Kermedec 6.3 that EMSC had at 6.0 - detail here
I even put on my listing:
Well they waited until the 8 days were well past and it is now 6.0 in the 8-30 day listing.
Personally I think that is very bad show if anyone from USGS happens to be looking at this thread. If we as members of the public can determine the position it should have been amended straight away.
I even put on my listing:
In the light of the EMSC evaluation of 6.0 Mw and the USGS Global centroid tensor moment solution of 5.9, and their wphase tensor solution of 6.0 I believe this to be incorrectly displayed as 6.3 and should have already been reduced in the USGS listings.
Well they waited until the 8 days were well past and it is now 6.0 in the 8-30 day listing.
Personally I think that is very bad show if anyone from USGS happens to be looking at this thread. If we as members of the public can determine the position it should have been amended straight away.
reply to post by PuterMan
Yeah they can be pretty slack at times.
I still don't understand why quakes close to the US, such as Mexico and in the Caribbean don't have phase data on USGS, I've come across a few in my research travels, but not sure if its an area thing or just random.
Still none for the Baja 7.1 either.
Yeah they can be pretty slack at times.
I still don't understand why quakes close to the US, such as Mexico and in the Caribbean don't have phase data on USGS, I've come across a few in my research travels, but not sure if its an area thing or just random.
Still none for the Baja 7.1 either.
Russians are in with 6.7Ms for that Siberian quake
www.ceme.gsras.ru...
showed up pretty good on LISS SNZO
Mid 6's are pretty rare so nothing to compare with (or maybe thats just the perception)
date= 27-Dec-2011 15:21:55.4
lat= 51.83 lon= 95.85
depth= 10km
ms: 6.7/31 mb: 6.5/31
www.ceme.gsras.ru...
showed up pretty good on LISS SNZO
Mid 6's are pretty rare so nothing to compare with (or maybe thats just the perception)
edit on 27-12-2011 by muzzy because: replaced html in
LISS link to permanent image
reply to post by this_is_who_we_are
Immediately under your post here is my post on that thread which was my response to the member who came up with the answer here
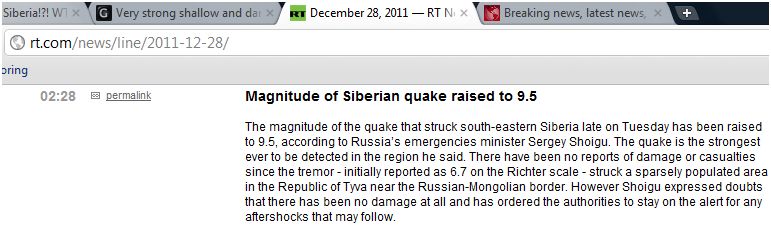
As the member Bennogob stated the RT statement did not make if clear that what was being reported was an intensity scale and not a magnitude, which i consider to be extremely remiss of them. I guess the reporter probably had little understanding of the matter and assumed that 6.7 Richter was on the same scale as 9.5 MSK. As I pointed out this was flagged as MMI VII by USGS.
Basically a news sources boo-boo. Now there's a surprise!!
Immediately under your post here is my post on that thread which was my response to the member who came up with the answer here
As the member Bennogob stated the RT statement did not make if clear that what was being reported was an intensity scale and not a magnitude, which i consider to be extremely remiss of them. I guess the reporter probably had little understanding of the matter and assumed that 6.7 Richter was on the same scale as 9.5 MSK. As I pointed out this was flagged as MMI VII by USGS.
Basically a news sources boo-boo. Now there's a surprise!!
edit on 27/12/2011 by PuterMan because: Spelling and grammar :bnghd:
reply to post by PuterMan
Aha. That explains it. I was wondering why we're all not dead.
Aha. That explains it. I was wondering why we're all not dead.
edit on 12/27/2011 by this_is_who_we_are because: wording
I know Canterbury has been done to death already, but as time goes on a better understanding can be had of whats actually happening.
I haven't seen any graphs like this on Geonet or Canterbury Quakes Live.
Aftershocks
This time looking at 72 hours or 4 days. I've chosen that timeline because they seem to taper off after that and also 4 days graphs fits width wise in my screen
As was recently advised the June 13th quake has been upgraded to 6.441, making it bigger than the February quake which caused all the damage and loss of life.
However that alone does not make it the highest release of energy over the 72 hour timespan.
The Feb quake and 72 hrs of aftershocks still released the most energy, even more than the 7.1 and 72 hours of aftershocks
It looks like the two 5.8 and 5.9 aftershocks right after the 6.3 in Feb really made a big difference to the energy totals.
Also the graph shows the 7.1 as a slow lumbering giant of an aftershock series, whereas the Port Hils Feb and Taylors Mistake June aftershocks came in rapidly within hours.
The Pegusus Bay 23rd Dec 6.0 is preliminary at this stage, it could be a month, if not 6-12 months before all the aftershocks are determined, but there is no doubt whatsoever the numbers shown for that can be doubled .
Good for an overview anyway.
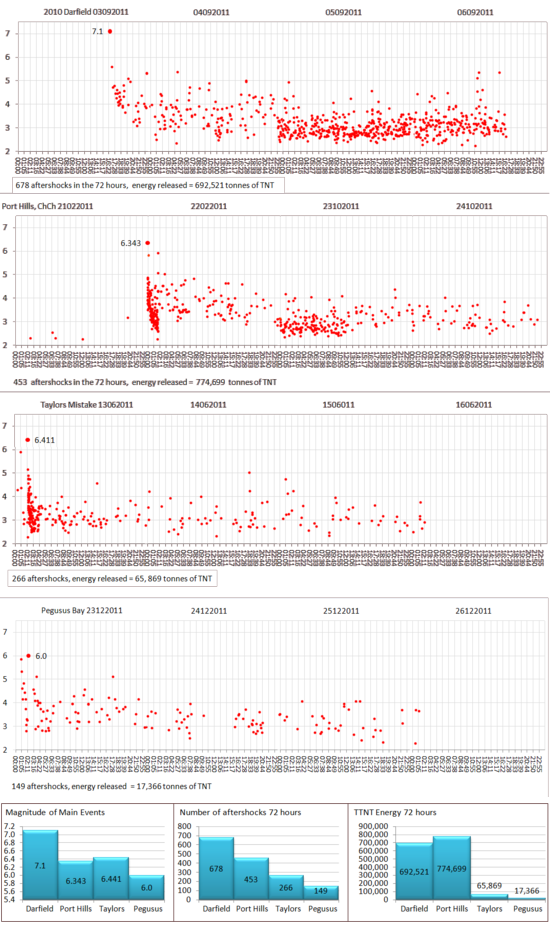
full size image here
Data is from Geonet
Co-ordinates of the search area
West 171.81584 South -43.93907
East 173.17656 North-42.96192
I haven't seen any graphs like this on Geonet or Canterbury Quakes Live.
Aftershocks
This time looking at 72 hours or 4 days. I've chosen that timeline because they seem to taper off after that and also 4 days graphs fits width wise in my screen
As was recently advised the June 13th quake has been upgraded to 6.441, making it bigger than the February quake which caused all the damage and loss of life.
However that alone does not make it the highest release of energy over the 72 hour timespan.
The Feb quake and 72 hrs of aftershocks still released the most energy, even more than the 7.1 and 72 hours of aftershocks
It looks like the two 5.8 and 5.9 aftershocks right after the 6.3 in Feb really made a big difference to the energy totals.
Also the graph shows the 7.1 as a slow lumbering giant of an aftershock series, whereas the Port Hils Feb and Taylors Mistake June aftershocks came in rapidly within hours.
The Pegusus Bay 23rd Dec 6.0 is preliminary at this stage, it could be a month, if not 6-12 months before all the aftershocks are determined, but there is no doubt whatsoever the numbers shown for that can be doubled .
Good for an overview anyway.
full size image here
Data is from Geonet
Co-ordinates of the search area
West 171.81584 South -43.93907
East 173.17656 North-42.96192
edit on 27-12-2011 by muzzy because: brain is faster than my fingers, spelling mistakes and punctuation
fixed
reply to post by ressiv
Gee I thought I was the old man with a memory problem
You visited this thread since you commented. Could it it be shock horror that you did not read the thread!!!
I explained this on the page prior to the one you posted on. (And there are only 3 pages anyway!)
Gee I thought I was the old man with a memory problem
You visited this thread since you commented. Could it it be shock horror that you did not read the thread!!!
I explained this on the page prior to the one you posted on. (And there are only 3 pages anyway!)
USGS have made the trace lines darker on the LISS graphs
eg
LISS SNZO
Much better, it happened within the last 2 hours, I just clicked refresh and it was changed.
I believe Puterman may have had something to do with it
now the question is, what is that trace at 7:00:00 to 7:20:00?, I can't match it with anything.
Too late for the Fiji 5.2, based on the phase data arrival times, SNZO not listed but there are other NZ stations there
URZ 06:42:19.21
BKZ 06:42:28.56
LTZ 06:43:09.56
WHZ 06:43:46.00
and even SNAA (Antarctica) is 06:50:37.9 according to EMSC
Nothing on Geonet either
Another Southern Ocean mystery quake?
eg
LISS SNZO
Much better, it happened within the last 2 hours, I just clicked refresh and it was changed.
I believe Puterman may have had something to do with it
edit on 28-12-2011 by muzzy because:to add what I am about to say
now the question is, what is that trace at 7:00:00 to 7:20:00?, I can't match it with anything.
Too late for the Fiji 5.2, based on the phase data arrival times, SNZO not listed but there are other NZ stations there
URZ 06:42:19.21
BKZ 06:42:28.56
LTZ 06:43:09.56
WHZ 06:43:46.00
and even SNAA (Antarctica) is 06:50:37.9 according to EMSC
Nothing on Geonet either
Another Southern Ocean mystery quake?
edit on 28-12-2011 by muzzy because: to add what I just said
reply to post by muzzy
Big improvement, but despite the fact that I moaned about it I somehow doubt I can claim a victory! (But you never know)
I am thinking that is close to you and too small for USGS. Looks like around 07:05 is the earliest at SNZO. Only very faint in Antarctica and Western Australia.
What is up with Kermedec. Is that weather? Seems too long period.
Kermandec Islands, Raoul [IU]
Looks OK on the normal seismo. They may have 'oevrdone it' a bit?
RAO.IU.10.LHZ.2011.362
edit on 28/12/2011 by PuterMan because: (no reason given)
Originally posted by muzzy
I know Canterbury has been done to death already
No mate, we're still alive, despite best efforts!
www.christchurchquakemap.co.nz...
edit on 28-12-2011 by aorAki
because: linky
hello !
Have a nice question :
if u look closely the earthquake yesterday in russia near the epicenter we have this : 50°59'28.16"N 97°24'39.42"E
(google earth please)
Now thats my question :
Are the siberian traps open ? and what i see in this pictures please ? lava flow ?
because the pictures on 2011 we see "lava flow" and not in 2007 so ?
because year 2011 record of temperature...
please i search an answer and i cant post.. and sorry for my poor english...
reply to post by muzzy
Your missing quake just turned up.
Source: GeoNet Magma.XML
ETA: You might have felt that one muzzy! Location in Google Maps
Your missing quake just turned up.
Date/Time UTC,Latitude,Longitude,Magnitude,Depth(Km),Location
2011-12-28 07:04:32, -40.281, 174.346, 2.1, 71.9, Graham Bank
Source: GeoNet Magma.XML
ETA: You might have felt that one muzzy! Location in Google Maps
edit on 28/12/2011 by PuterMan because: (no reason given)
reply to post by newyorkee
Actually it is very good or used to be but it could do with getting a little less involved with earthquakes perhaps. It was great when it was all about ice and the next ice-age.
Actually it is very good or used to be but it could do with getting a little less involved with earthquakes perhaps. It was great when it was all about ice and the next ice-age.
edit on 28/12/2011 by PuterMan because: (no reason given)
reply to post by maritimo69
Hi, no the Siberian traps are not 'open'. Read about them in Wikiperdia
The word 'traps' is derived from the word for stairs, so this is the Siberian stairs and in India there are the Deccan 'stairs' and another in China (the name escapes me for the moment). There are in fact many LIPs around the world. I have gathered a little information on LIPs and Plumes here
This compares to Yellowstone (smallest 1000km3) but they were not quite the same. These are mainly lava flows - very big massive ones - and covered areas of up to 2 million km2.
The temperatures have nothing to do with the Siberian Traps. These weather conditions are affected by the El Nino / La Nina cycles in addition to the fact that continental areas always have much greater extremes of temperature than coastal areas. The cycles affect the jet streams and this is what causes the hot and cold by blocking colder / warmer air. Sorry that is a very skimpy description but it is way too big a subject for here.
Edit To Add:
This looks like some sort of photographic colouration as it does not appear on all plates and has straight edges. Certainly not lava anyway.
Hi, no the Siberian traps are not 'open'. Read about them in Wikiperdia
The Siberian Traps (Russian: Сибирские траппы Sibirskie trappi) form a large region of volcanic rock, known as a large igneous province, in the Russian region of Siberia. The massive eruptive event which formed the traps, one of the largest known volcanic events of the last 500 million years of Earth's geological history, continued for a million years and spanned the Permian–Triassic boundary, about 251 to 250 million years ago.
The word 'traps' is derived from the word for stairs, so this is the Siberian stairs and in India there are the Deccan 'stairs' and another in China (the name escapes me for the moment). There are in fact many LIPs around the world. I have gathered a little information on LIPs and Plumes here
The Siberian Traps are considered to have erupted via numerous vents over a period of roughly a million years or more, probably east and south of Norilsk in Siberia. Individual eruptions of basalt lavas could have exceeded 2000 km3
This compares to Yellowstone (smallest 1000km3) but they were not quite the same. These are mainly lava flows - very big massive ones - and covered areas of up to 2 million km2.
because year 2011 record of temperature
The temperatures have nothing to do with the Siberian Traps. These weather conditions are affected by the El Nino / La Nina cycles in addition to the fact that continental areas always have much greater extremes of temperature than coastal areas. The cycles affect the jet streams and this is what causes the hot and cold by blocking colder / warmer air. Sorry that is a very skimpy description but it is way too big a subject for here.
Edit To Add:
and what i see in this pictures please ?
This looks like some sort of photographic colouration as it does not appear on all plates and has straight edges. Certainly not lava anyway.
edit on 28/12/2011 by PuterMan because: (no reason given)
reply to post by PuterMan
ty for answer !
io9.com...
but its possible maybe its not photographic colouration if u look the article, maybe the lava comes out because its space is reduced because of japan earthquake.. its possible ?
ty for answer !
io9.com...
but its possible maybe its not photographic colouration if u look the article, maybe the lava comes out because its space is reduced because of japan earthquake.. its possible ?
reply to post by maritimo69
No, I can assure you it is not lava. It is just a colouration on the photo - the reason for which I am not sure but bear in mind that Google Earth is not even remotely real time.
Go to 55.665596°, 95.217950°
Is that lava? It is the same colour. No it is fields. This is an imagery colouration. Nothing more.
Here, I will save you the trouble of finding it in Google Earth.
Maps location
edit on 28/12/2011 by PuterMan because: (no reason given)
new topics
-
Russian intelligence officer: explosions at defense factories in the USA and Wales may be sabotage
Weaponry: 26 minutes ago -
African "Newcomers" Tell NYC They Don't Like the Free Food or Shelter They've Been Given
Social Issues and Civil Unrest: 1 hours ago -
Russia Flooding
Other Current Events: 2 hours ago -
MULTIPLE SKYMASTER MESSAGES GOING OUT
World War Three: 3 hours ago -
Two Serious Crimes Committed by President JOE BIDEN that are Easy to Impeach Him For.
US Political Madness: 4 hours ago -
911 emergency lines are DOWN across multiple states
Breaking Alternative News: 4 hours ago -
Former NYT Reporter Attacks Scientists For Misleading Him Over COVID Lab-Leak Theory
Education and Media: 6 hours ago -
Why did Phizer team with nanobot maker
Medical Issues & Conspiracies: 6 hours ago -
Pro Hamas protesters at Columbia claim hit with chemical spray
World War Three: 7 hours ago -
Elites disapearing
Political Conspiracies: 9 hours ago
top topics
-
British TV Presenter Refuses To Use Guest's Preferred Pronouns
Education and Media: 16 hours ago, 17 flags -
Go Woke, Go Broke--Forbes Confirms Disney Has Lost Money On Star Wars
Movies: 11 hours ago, 13 flags -
Pro Hamas protesters at Columbia claim hit with chemical spray
World War Three: 7 hours ago, 11 flags -
Elites disapearing
Political Conspiracies: 9 hours ago, 8 flags -
Freddie Mercury
Paranormal Studies: 11 hours ago, 7 flags -
Nirvana - Immigrant Song
Music: 15 hours ago, 5 flags -
A Personal Cigar UFO/UAP Video footage I have held onto and will release it here and now.
Aliens and UFOs: 9 hours ago, 5 flags -
African "Newcomers" Tell NYC They Don't Like the Free Food or Shelter They've Been Given
Social Issues and Civil Unrest: 1 hours ago, 5 flags -
Two Serious Crimes Committed by President JOE BIDEN that are Easy to Impeach Him For.
US Political Madness: 4 hours ago, 4 flags -
Former NYT Reporter Attacks Scientists For Misleading Him Over COVID Lab-Leak Theory
Education and Media: 6 hours ago, 4 flags
active topics
-
Russian intelligence officer: explosions at defense factories in the USA and Wales may be sabotage
Weaponry • 4 • : TimBurr -
African "Newcomers" Tell NYC They Don't Like the Free Food or Shelter They've Been Given
Social Issues and Civil Unrest • 4 • : GENERAL EYES -
The Acronym Game .. Pt.3
General Chit Chat • 7722 • : bally001 -
Two Serious Crimes Committed by President JOE BIDEN that are Easy to Impeach Him For.
US Political Madness • 7 • : Disgusted123 -
Russia Flooding
Other Current Events • 1 • : ksihkahe -
Running Through Idiot Protestors Who Block The Road
Rant • 107 • : FlyersFan -
Russia Ukraine Update Thread - part 3
World War Three • 5694 • : F2d5thCavv2 -
-@TH3WH17ERABB17- -Q- ---TIME TO SHOW THE WORLD--- -Part- --44--
Dissecting Disinformation • 518 • : Guyfriday -
British TV Presenter Refuses To Use Guest's Preferred Pronouns
Education and Media • 50 • : sine.nomine -
MULTIPLE SKYMASTER MESSAGES GOING OUT
World War Three • 12 • : Zaphod58