It looks like you're using an Ad Blocker.
Please white-list or disable AboveTopSecret.com in your ad-blocking tool.
Thank you.
Some features of ATS will be disabled while you continue to use an ad-blocker.

Quake Watch 2011
page: 411share:
Here we go 2012.
No tsunami warning issued because of depth.
USGS EMSC
Magnitude 7.0 - IZU ISLANDS, JAPAN REGION
Date-Time
Sunday, January 01, 2012 at 05:27:54 UTC
Sunday, January 01, 2012 at 02:27:54 PM at epicenter
Time of Earthquake in other Time Zones
Location
31.416°N, 138.155°E
Depth
348.5 km (216.6 miles)
Region
IZU ISLANDS, JAPAN REGION
Distances
242 km (150 miles) SW of Hachijo-jima, Izu Islands, Japan
365 km (226 miles) S of Hamamatsu, Honshu, Japan
393 km (244 miles) S of Shizuoka, Honshu, Japan
495 km (307 miles) SSW of TOKYO, Japan
No tsunami warning issued because of depth.
USGS EMSC
edit on 1/1/12 by murkraz because: (no reason given)
goodbye QW 2011 thread
hello 2012 thread, www.abovetopsecret.com...
looks like this one reached over 400 pages
who wants to make a bet? on how many pages QW 2012 will reach by new years of 2013.
that is if we are still alive by then
i'll bet over 600 pages less then 800
hello 2012 thread, www.abovetopsecret.com...
looks like this one reached over 400 pages
who wants to make a bet? on how many pages QW 2012 will reach by new years of 2013.
that is if we are still alive by then
i'll bet over 600 pages less then 800
edit on 1/1/12 by pryingopen3rdeye because: (no reason given)
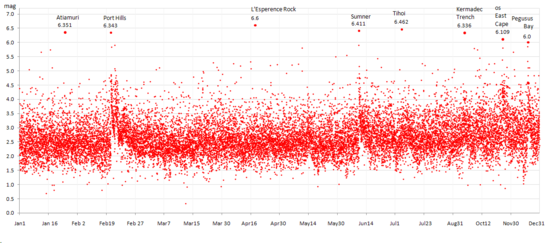
New Zealand has always been my focus, so here is a preliminary summary in graph format for 2011.
Spent a lot of time working on these, like 365 days
you can see the full size images here
in about a months time I should be able to draw up the final, revised, updated numbers when Geonet go over the last couple of months. I've already done the first 3 months of numbers per day and they are double the preliminary count per day, and average out at 78 per day over 90 days I'm not expecting the energy count to change much, its the biguns that determine the size of the columns on those graphs and its pretty unlikely Geonet missed any mag 5's.
As you will see its not always the days with a large number of events that have the high energy release,
the largest energy release was on April 18th 6.6Mw SW of L'Esperence Rock south of the Kermadec Islands followed by the Tihoi 6.462 on July 5th on the edge of Lake Taupo ( volcano) not the Feb 21 Port Hills 6.343 or June 13 Taylors Mistake/Redcliffs 6.411 which had the highest numbers of events (aftershocks). The first offshore East Cape quake in September 15th was bigger (6.336) than the November 18th one (6.109) and released more energy, although the November one had multiple aftershocks which brought the numbers count way up for that day (90).
As far as patterns go the only ones I can see are the aftershocks which seem to be pretty standard especially for the shallow Christchurch Mag 6 events, leading up to big events the numbers either fall away prior or steadily build up, so the perception that prior to a big one the numbers drop away is wrong eg prior to the Feb 22 event the numbers built up steadily from 7 per day to 33 per day over 23 days, whereas prior to the June 13 event the numbers fell steadily over 5 days from 50 to 22 per day. The July Tihoi had a steady 6 to 13 per day in the 6 days prior.
2011 (59) becomes the 3rd highest year for numbers of quakes above Mag 5 per year after 2009 (74) and 1995 (114) over the last 171 years of records, and equals 1929 and 1995 with 7 Mag 6's per year.
Oh yeah, over the holidays I started on that rehash of my Historic NZ Earthquakes 1840-2011, moving it over to Wordpress, you can see the Timeline graph for Mag 5+ quakes in 2011 and the numbers count for the 171 years comparison count there.
I've thrown in the 2010 "hotspots" maps I did earlier in the year and will do the same for 2011 when I get the time eqarchives.wordpress.com...
hopefully the icons on the interactive maps load for you, I had trouble with mine a few times, some of them come up as blue google markers as default, but the details of the quakes are still there if you click on the icon.
Spent a lot of time working on these, like 365 days
you can see the full size images here
in about a months time I should be able to draw up the final, revised, updated numbers when Geonet go over the last couple of months. I've already done the first 3 months of numbers per day and they are double the preliminary count per day, and average out at 78 per day over 90 days I'm not expecting the energy count to change much, its the biguns that determine the size of the columns on those graphs and its pretty unlikely Geonet missed any mag 5's.
As you will see its not always the days with a large number of events that have the high energy release,
the largest energy release was on April 18th 6.6Mw SW of L'Esperence Rock south of the Kermadec Islands followed by the Tihoi 6.462 on July 5th on the edge of Lake Taupo ( volcano) not the Feb 21 Port Hills 6.343 or June 13 Taylors Mistake/Redcliffs 6.411 which had the highest numbers of events (aftershocks). The first offshore East Cape quake in September 15th was bigger (6.336) than the November 18th one (6.109) and released more energy, although the November one had multiple aftershocks which brought the numbers count way up for that day (90).
As far as patterns go the only ones I can see are the aftershocks which seem to be pretty standard especially for the shallow Christchurch Mag 6 events, leading up to big events the numbers either fall away prior or steadily build up, so the perception that prior to a big one the numbers drop away is wrong eg prior to the Feb 22 event the numbers built up steadily from 7 per day to 33 per day over 23 days, whereas prior to the June 13 event the numbers fell steadily over 5 days from 50 to 22 per day. The July Tihoi had a steady 6 to 13 per day in the 6 days prior.
2011 (59) becomes the 3rd highest year for numbers of quakes above Mag 5 per year after 2009 (74) and 1995 (114) over the last 171 years of records, and equals 1929 and 1995 with 7 Mag 6's per year.
edit on 1-1-2012 by muzzy because: (no reason given)
Oh yeah, over the holidays I started on that rehash of my Historic NZ Earthquakes 1840-2011, moving it over to Wordpress, you can see the Timeline graph for Mag 5+ quakes in 2011 and the numbers count for the 171 years comparison count there.
I've thrown in the 2010 "hotspots" maps I did earlier in the year and will do the same for 2011 when I get the time eqarchives.wordpress.com...
hopefully the icons on the interactive maps load for you, I had trouble with mine a few times, some of them come up as blue google markers as default, but the details of the quakes are still there if you click on the icon.
edit on 1-1-2012 by muzzy because: (no reason given)
Originally posted by muzzy
2011 (59)becomes the 3rd highest year for numbers of quakes above Mag 5 per year after 2009 (74) and 1995 (114) over the last 171 years of records,and equals 1929 and 1995 with 7 Mag 6's per year.
[color=FFFC17]Correction:
2011 [color=FFFC17](60) becomes the 3rd highest year for numbers of quakes above Mag 5 per year after 2009 (74) and 1995 (114) over the last 171 years of records, and beats 1929 (7) and 1995 (7) with [color=FFFC17]8 Mag 6's in the year.
I hadn't included the L'Esperence Rock 6.516 in the numbers count graph for 2011 as it was not included in Geonet data. Although its on the Felt Pages for April, they used the USGS details.
Accuracy is important when doing this stuff
Magnitude 6.6 - SANTA CRUZ ISLANDS
2012 January 09 04:07:17 UTC
Details
Maps
Tsunami
Earthquake Details
This event has been reviewed by a seismologist.
Magnitude
6.6 (Preliminary magnitude — update expected within 15 minutes)
Date-Time
Monday, January 09, 2012 at 04:07:17 UTC
Monday, January 09, 2012 at 03:07:17 PM at epicenter
Location
10.595°S, 165.246°E
Depth
49.6 km (30.8 miles) set by location program
Region
SANTA CRUZ ISLANDS
Distances
363 km (225 miles) E (93°) from Kira Kira, Solomon Islands
593 km (369 miles) ESE (103°) from HONIARA, Solomon Islands
1980 km (1230 miles) E (95°) from PORT MORESBY, Papua New Guinea
Location Uncertainty
Error estimate not available
Parameters
NST= 17, Nph=0, Dmin=0 km, Rmss=0 sec, Gp= 86°,
M-type="moment" magnitude from initial P wave (tsuboi method) (Mi/Mwp), Version=B
Source
NOAA Pacific Tsunami Warning Center
Event ID
pt12009000
earthquake.usgs.gov...
edit on 1/8/2012 by this_is_who_we_are because: link
OOPS Wrong Quake Watch Thread...
edit on 1/8/2012 by this_is_who_we_are because: wrong year
Another earthquake graph for NZ 2011
Timeline using the 17,997 earthquakes recorded by Geonet for the year as at 31 Dec 2011
full size image here
I was a bit surprised at the overall shape of the plots, its more of a series of multiple aftershock sequences from some of the mag 6's.
See how right after each Mag 6 the 1's, 2's and 3's are not there for a few days, leaving a hollow spot at the bottom of the graph!
Its like I just joined several of my aftershock timeline graphs together, but that's not what I did, I just plotted the whole year as one.
Also looks like there is a general overall trend for the magnitudes gradually rising since the July 13th Sumner quake
I'm not sure if this is because the last few months are just preliminary listings, there are likely more low size mag 2's to be determined and added to the data lists yet. I'll have to do some previous years like this and see what happened there where all the data was completed and finalized.
edit on 9-1-2012 by muzzy because: missed an s
Originally posted by muzzy
Originally posted by BobAthome
reply to post by muzzy
uhhhmm if your taking requests and want to maybe see what you could dig up on this one
Santorini Volcano Erupts: 1500 BC
It is kinda outside of 1990's but you didn't say a.d or b.c
1500BC you say?
Well I've only downloaded and processed back to 1900 so far, but had a quick look on Utsu's IISEE catalogue and the first entry for Santorini is 1380BC
Its going to be a tough job, Utsu only got as far back as 1365BC putting Magnitudes to the quakes, but he couldn't find the spot exactly
Source Year Latitude Longitude Magnitude Location
M -1365 - - 7.8 severe damage Syria coast:Ugarit near Minet-el-Beida
The next Mag Tagged one with co-ordinates was;
Source Year Latitude Longitude Magnitude Location
C -780 -34.5 107.8 7 China:Shanxi(I>=9) (M>=7/M6-7)
a lot is going to depend on the Intensity ( I=) analysis, as that is all there is to go on.
A lot of the data is based on Volcanic eruption and Tsunami data
I still need to get my head around Asia Minor and Persia, let alone the Assyrian Empire
-----------------
1 February 2012 Last updated at 13:09 ET
Mega volcanoes 'may be predicted'
By Neil Bowdler Science and health reporter, BBC News
www.bbc.co.uk...
-------------------------------------------------------------
I think that DATA ,,,(A lot of the data is based on Volcanic eruption and Tsunami data),might be all here now,, lol
Maybe someone was watching,, lol
yaaaa.
Me.
We need to get some more Fat Ladies , to sing the last verses
Lost a Mag 6 for NZ with latest updates from Geonet
6.109, 3612641, -37.56812, -179.91498, 2011/11/18 7:51:21, 38, o/s E of East Cape
5.637, 3612641 -37.43663, 179.95192, 2011/11/18 7:51:21, 33, o/s E of East Cape
(both are ML BTW)
Global CMTstill have it as a 6.0Ms though
Lost a Mag 6 for NZ with latest updates from Geonet
5.637, 3612641 -37.43663, 179.95192, 2011/11/18 7:51:21, 33, o/s E of East Cape
(both are ML BTW)
Global CMTstill have it as a 6.0Ms though
Date: 2011/11/18 Centroid Time: 7:51:27.8 GMT
Lat= -37.51 Lon= 179.62
Depth= 12.0 Half duration= 1.8
Centroid time minus hypocenter time: 3.1
Moment Tensor: Expo=24 -4.660 1.520 3.140 0.349 2.310 2.250
Mw = 5.7 mb = 5.8 Ms = 6.0 Scalar Moment = 5.24e+24
Fault plane: strike=46 dip=34 slip=-71
Fault plane: strike=204 dip=58 slip=-102
edit on 5-5-2012 by muzzy because: (no reason given)
edit on 5-5-2012 by muzzy because: (no reason given)
new topics
-
Nirvana - Immigrant Song
Music: 2 hours ago -
British TV Presenter Refuses To Use Guest's Preferred Pronouns
Education and Media: 3 hours ago -
Tucker Carlson interviews Christian pastor from Bethlehem.
Middle East Issues: 5 hours ago -
Trump To Hold Dinner with President of Poland At Trump Tower Tonight
2024 Elections: 6 hours ago -
A family from Kansas with six children moved to the Moscow region
Other Current Events: 9 hours ago -
Revolution in advertising: the Russians launched a unique satellite
Science & Technology: 11 hours ago
top topics
-
I Guess Cloud Seeding Works
Fragile Earth: 16 hours ago, 16 flags -
Canadian Forces bow out and loose interest in UFO’s
Aliens and UFOs: 17 hours ago, 7 flags -
Trump To Hold Dinner with President of Poland At Trump Tower Tonight
2024 Elections: 6 hours ago, 7 flags -
Revolution in advertising: the Russians launched a unique satellite
Science & Technology: 11 hours ago, 5 flags -
A family from Kansas with six children moved to the Moscow region
Other Current Events: 9 hours ago, 4 flags -
Tucker Carlson interviews Christian pastor from Bethlehem.
Middle East Issues: 5 hours ago, 4 flags -
Echo & The Bunnymen - The Killing Moon!
Music: 14 hours ago, 3 flags -
British TV Presenter Refuses To Use Guest's Preferred Pronouns
Education and Media: 3 hours ago, 3 flags -
Nirvana - Immigrant Song
Music: 2 hours ago, 3 flags
active topics
-
It has begun... Iran begins attack on Israel, launches tons of drones towards the country
World War Three • 850 • : Oldcarpy2 -
That which the "news" never talks about; Truth about election fraud
Mainstream News • 29 • : YourFaceAgain -
British TV Presenter Refuses To Use Guest's Preferred Pronouns
Education and Media • 12 • : Consvoli -
-@TH3WH17ERABB17- -Q- ---TIME TO SHOW THE WORLD--- -Part- --44--
Dissecting Disinformation • 506 • : cherokeetroy -
Nirvana - Immigrant Song
Music • 2 • : alldaylong -
Candidate TRUMP Now Has Crazy Judge JUAN MERCHAN After Him - The Stormy Daniels Hush-Money Case.
Political Conspiracies • 279 • : Oldcarpy2 -
The US Supreme Court Appears to Side With the January 6th 2021 Capitol Protestors.
Political Conspiracies • 40 • : ScarletDarkness -
I Guess Cloud Seeding Works
Fragile Earth • 17 • : Justoneman -
Abortions in first 12 weeks should be legalised in Germany, commission says
Medical Issues & Conspiracies • 24 • : Vermilion -
Joe Biden and Donald Trump are both traitors
2024 Elections • 58 • : Justoneman