It looks like you're using an Ad Blocker.
Please white-list or disable AboveTopSecret.com in your ad-blocking tool.
Thank you.
Some features of ATS will be disabled while you continue to use an ad-blocker.

Quake Watch 2014
page: 80share:
Gosh this thread IS deserted,
if WOQ is the one posting a quake!!!
And almost 6 hours later!
M 6.3 - 19km SW of Juan Rodriguez Clara, Mexico
Time 2014-07-29 10:46:15 UTC
Location 17.842°N 95.524°W
Depth 95.1km
The 4.0 in Okie, has be upped to a 4.3 too!
WOQ
if WOQ is the one posting a quake!!!
And almost 6 hours later!
M 6.3 - 19km SW of Juan Rodriguez Clara, Mexico
Time 2014-07-29 10:46:15 UTC
Location 17.842°N 95.524°W
Depth 95.1km
The 4.0 in Okie, has be upped to a 4.3 too!
WOQ
a reply to: wasobservingquietly
Yep I missed that one.
Maybe they (everyone else) are busy doing research and are going to bomb the Topic any day with mind blowing revelations and interesting ideas!
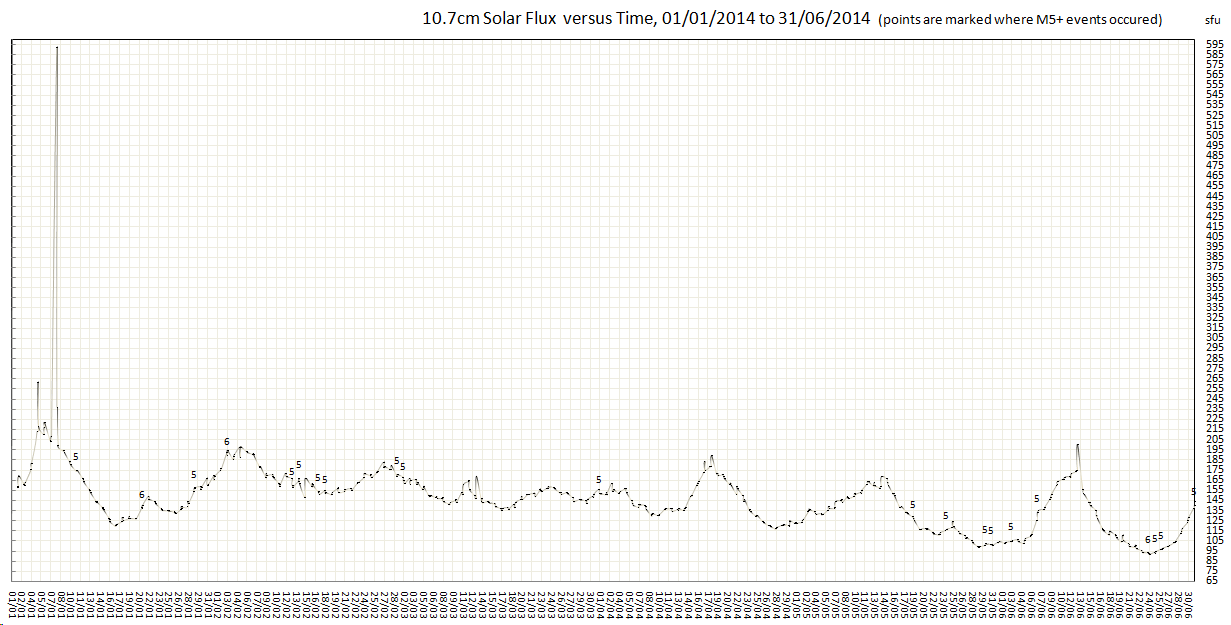
One thing I was having a look at yesterday is Solar Flux. I've never really bought into the relationship between Solar Flares and Earthquakes, but every now and again someone will make a comment along these lines. So.............
Solar Ham has a good page of data on these Solar Flux's at www.solarham.net...
To see where the actual Solar Flares fit into that data, there is another page showing those back to 2010 at www.solarham.net...
I've used that data and put it on Monthly graphs with matching (by Time) New Zealand earthquake daily radiated energy release (TTNT) to see if there was a match. Solar Flux graphs
here is the whole 6 months with the M5+'s marked on it;
 (click image for larger version, opens in new
tab/window)
(click image for larger version, opens in new
tab/window)
Short answer is NO relationship
Long answer is, maybe when the Solar Flux is low there is more chance of an M5+, but not always!
OK its only 6 months of data, which is a short period, and it probably would work better when matched against Global M6's. I think I did that before, and still couldn't find any matching.
Yep I missed that one.
Maybe they (everyone else) are busy doing research and are going to bomb the Topic any day with mind blowing revelations and interesting ideas!
One thing I was having a look at yesterday is Solar Flux. I've never really bought into the relationship between Solar Flares and Earthquakes, but every now and again someone will make a comment along these lines. So.............
wiki
Emission from the Sun at centimetric (radio) wavelength is due primarily to coronal plasma trapped in the magnetic fields overlying active regions.[20] The F10.7 index is a measure of the solar radio flux per unit frequency at a wavelength of 10.7 cm, near the peak of the observed solar radio emission. F10.7 is often expressed in SFU or solar flux units (1 SFU = 10−22 W m−2 Hz−1). It represents a measure of diffuse, nonradiative heating of the coronal plasma trapped by magnetic fields over active regions. It is an excellent indicator of overall solar activity levels and correlates well with solar UV emissions.
Solar Ham has a good page of data on these Solar Flux's at www.solarham.net...
To see where the actual Solar Flares fit into that data, there is another page showing those back to 2010 at www.solarham.net...
I've used that data and put it on Monthly graphs with matching (by Time) New Zealand earthquake daily radiated energy release (TTNT) to see if there was a match. Solar Flux graphs
here is the whole 6 months with the M5+'s marked on it;

Short answer is NO relationship
Long answer is, maybe when the Solar Flux is low there is more chance of an M5+, but not always!
OK its only 6 months of data, which is a short period, and it probably would work better when matched against Global M6's. I think I did that before, and still couldn't find any matching.
edit on 0700000021021014 by muzzy because: (no reason given)
edit on 0700000021021014 by muzzy because: (no reason
given)
M2.5 Quarry Blast - 8km SSW of Princeton, BC, Canada 2014-07-30 21:09:24
UTC (USGS)
also further north;
142 km S of Fort Nelson, BC, Canada
Local Time: 14:23:57 MST
Magnitude: 3.9 ML
Latitude: 57.53 North Longitude: 122.87 West
UTC Date and Time: 2014/07/30 21:23:57 UT
www.earthquakescanada.nrcan.gc.ca...
GFZ have that one at 4.2mb
also further north;
142 km S of Fort Nelson, BC, Canada
Local Time: 14:23:57 MST
Magnitude: 3.9 ML
Latitude: 57.53 North Longitude: 122.87 West
UTC Date and Time: 2014/07/30 21:23:57 UT
www.earthquakescanada.nrcan.gc.ca...
GFZ have that one at 4.2mb
Some people only get excited about the strong ones................
M5.7 and up
interacive map based on GFZ data for July 2014
M5.7 and up
interacive map based on GFZ data for July 2014
So there is another thread on here about the gas explosions that occurred in Taiwan today. Seems multiple areas blew at the same time. Looking on
the quake map there is a 3.8 that appears in Taiwan. Would this be registering because of the explosion or could a quake have been the cause of the
gas line rupture?
Explosion Report
Explosion Report
a reply to: Vasa Croe
probably not, that quake was 39km away, @ 23.13, 121.02 too far away to cause pipes to rupture at that low magnitude, would have to be right on the spot in Kaohsiung or a M7+
report in your link says "The cause is thought to be gas leaks in the sewage system."
aged piping or poor maintenance
www.cwb.gov.tw...
edit on 0700000021121114 by muzzy because: (no reason given)
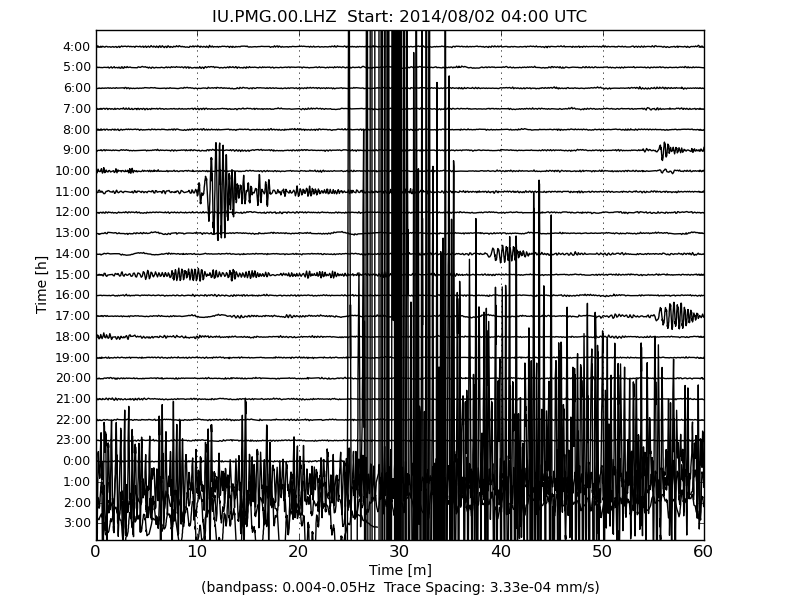
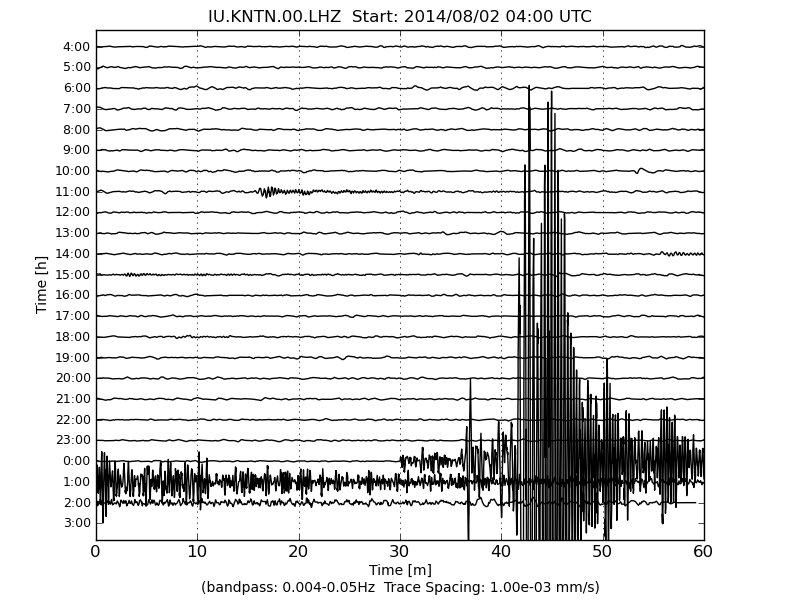
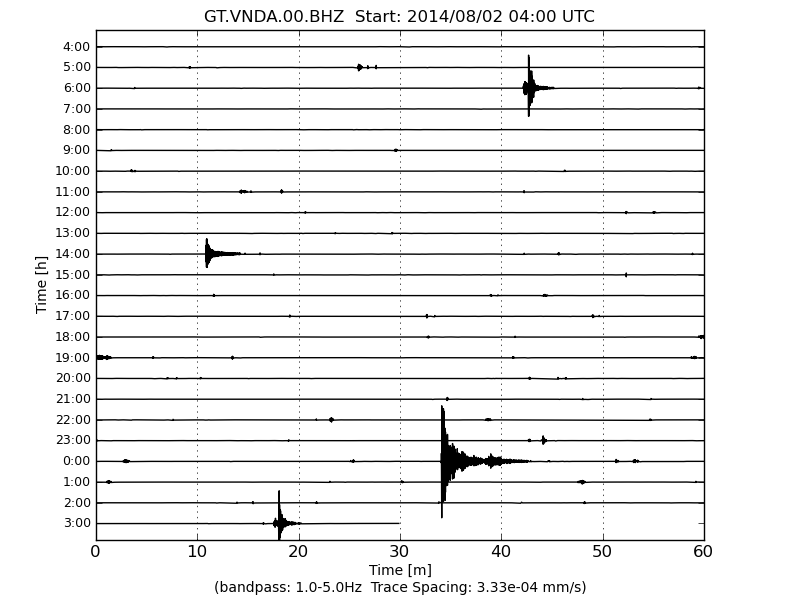
Understanding Global Displacement Wavefields Graphs

doh
never really took much notice of the Event Plots/ Global surface & body wave record sections images on IRIS before, but lately I have been frustrated when doing Significant Events (New Zealand) in not having a Trace Graph of the event to put on the page.
As we all know USGS stopped doing LISS graphs for well over a year in 2013, and they didn't Archive them anyway, so if missed downloading them on the day tough luck. The new version is pretty useless, too smooth.
IRIS have graphs for about 9 days for individual stations, but again once the 9 days are up thats it, they are gone.
The only alternative that I can find is the Global Displacement Wavefields Graphs by IRIS, which ARE archived.
Its taken me a whole day to search and read about what they mean, there isn't much info on the Net about how to read them, but I think I've got the basics.
Each line represents a Station based on distance from the epicenter. Seems obvious now, but I didn't see it previously.
The Stations I've marked on the graphs are taken from Wilber3, you click on the event you want and get the Stations for each event with the distance in degrees from the epicenter, and can match those with the graph image.
I've written a page about the graphs here
Now to get on with the Quake pages!, I'm doing the Gisborne 2007 M6.7 at the moment.
The more I read of IRIS, the less I need USGS
That image GDW was just an example, the first one I have actually used is for the
Gisborne 6.6MW just published. Better late than never, was 6.5
years ago!, I remember it like it was yesterday, the defining image of this event was the collapsed verandah on the main street.
Interesting quake, very sparse number of aftershocks, only 567 over 6 months. This is the first clear-cut case worldwide of triggered slow slip right after the mainshock. That's why I went out to the extended period of 6 months, but you can't really see the slow-slip as the events were tremors rather than earthquakes. The series did move west onto land near Gisborne in the later stages though. Slow slip is recorded by GPS rather than seismographs.
Next one is Bligh Sound, Fiordland 6.7 & 6.1 of 15/10/2007, it/they had 1322 aftershocks over a 6 month period.
I'm work backwards with NZ historic eq events.
Wet weather here, a relatively balmy 16C forecast For later on.
edit on 0800000021321314 by muzzy because: Speeling and Punktuation
M6.6 - Federated States of Micronesia region
2014-08-03 00:22:03 UTC
Event Time
2014-08-03 00:22:03 UTC
2014-08-03 10:22:03 UTC+10:00 at epicenter
2014-08-02 19:22:03 UTC-05:00 system time
Location
0.854°N 146.125°E depth=13.3km (8.3mi)
Nearby Cities
342km (213mi) NNW of Lorengau, Papua New Guinea
561km (349mi) NNE of Wewak, Papua New Guinea
643km (400mi) NW of Kavieng, Papua New Guinea
663km (412mi) NE of Vanimo, Papua New Guinea
1144km (711mi) N of Port Moresby, Papua New Guinea
USGS
edit on 2-8-2014 by lurksoften because: (no reason
given)
a reply to: lurksoften
And a 6.1 aftershock, too. Something tells me there's probably going to be bigger one for that area soon.
And a 6.1 aftershock, too. Something tells me there's probably going to be bigger one for that area soon.
Federated States of Micronesia region ?????
never heard of it, sounds a bit too PC to be real
Ahhh!! The East Caroline Islands
Pacific Island Nations are having a pow-wow in Palau right now, not far away. Arguing about fishing rights, US not offering enough for the Quota Licence, will probably go the the Europeans.
GFZ ahve those the other way around
2014-08-03 00:26:42 6.6 1.02°N 146.24°E 10 A E. Caroline Islands, Micronesia
2014-08-03 00:22:04 6.4 0.85°N 146.13°E 10 A E. Caroline Islands, Micronesia
may change later
hard to tell on LISS Port Moresby
sometimes further away is better, Kiritibati, looks like a single event, says 4 minutes apart, can't see that
Penguins @ Antarctica say just one event too
the graphs don't/can't lie!!!!!
so makes you wonder, is there anyone actaully there at USGS? or is it all machined like GFZ?
just noticed how small the images show here
but if you right click and "view image" it shows the full size image
saves a lot of typing up html code
WOW
EMSC are saying 6.9Mw and 6.1mb, but no data to back it up in their scientific data page,
www.emsc-csem.org...
so had a look at the Latest data contributions, some high reading there!!!
2014-08-03 00:22:30.5, 11.30N , 139.56E , 33, mb, 6.7, A, LDG
2014-08-03 00:22:06.6, 0.84N , 146.13E , 30, Mw, 6.9, A, MIX
2014-08-03 00:22:05.8, 0.86N , 146.14E , 10, mb, 6.4, A, SC3
2014-08-03 00:22:05.8, 0.81N , 146.07E , 10, mb, 7.2, A, MAD
2014-08-03 00:22:04.9, 0.82N , 146.13E , 10, M, 6.6, A, GFZ
2014-08-03 00:22:04.6, 0.86N , 146.08E , 10, Mw, 6.6, A, KAN
2014-08-03 00:22:04.0, 0.78N , 146.13E , 10, mb, 6.3, M, INGV
2014-08-03 00:22:03.9, 0.90N , 146.20E , 15, Mw, 7.0, A, BGSB
2014-08-03 00:22:03.7, 1.06N , 146.51E , 10, M, 6.4, M, VAO
2014-08-03 00:22:03.2, 0.84N , 146.14E , 11, Mw, 6.9, M, NEIC
2014-08-03 00:22:03.0, 0.85N , 146.23E , 10, Mi, 7.2, M!, PT
2014-08-03 00:22:02.5, 0.83N , 145.85E , 10, mb, 6.6, A, GSRC
2014-08-03 00:22:00.0, 0.90N , 146.20E , Mw, 7.2, M, PTWC
2014-08-03 00:22:00.0, 0.90N , 146.20E , Mw, 7.2, M, JMA
never heard of it, sounds a bit too PC to be real
Ahhh!! The East Caroline Islands
Pacific Island Nations are having a pow-wow in Palau right now, not far away. Arguing about fishing rights, US not offering enough for the Quota Licence, will probably go the the Europeans.
GFZ ahve those the other way around
2014-08-03 00:26:42 6.6 1.02°N 146.24°E 10 A E. Caroline Islands, Micronesia
2014-08-03 00:22:04 6.4 0.85°N 146.13°E 10 A E. Caroline Islands, Micronesia
may change later
hard to tell on LISS Port Moresby
sometimes further away is better, Kiritibati, looks like a single event, says 4 minutes apart, can't see that
Penguins @ Antarctica say just one event too
edit on 08u21321314 by muzzy because: (no reason given)
the graphs don't/can't lie!!!!!
so makes you wonder, is there anyone actaully there at USGS? or is it all machined like GFZ?
edit on 08u21321314 by muzzy because: (no reason given)
just noticed how small the images show here
but if you right click and "view image" it shows the full size image
saves a lot of typing up html code
edit on 08u21321314 by muzzy because: (no reason given)
edit on 0800000021321314 by muzzy because: (no reason
given)
WOW
EMSC are saying 6.9Mw and 6.1mb, but no data to back it up in their scientific data page,
www.emsc-csem.org...
so had a look at the Latest data contributions, some high reading there!!!
2014-08-03 00:22:30.5, 11.30N , 139.56E , 33, mb, 6.7, A, LDG
2014-08-03 00:22:06.6, 0.84N , 146.13E , 30, Mw, 6.9, A, MIX
2014-08-03 00:22:05.8, 0.86N , 146.14E , 10, mb, 6.4, A, SC3
2014-08-03 00:22:05.8, 0.81N , 146.07E , 10, mb, 7.2, A, MAD
2014-08-03 00:22:04.9, 0.82N , 146.13E , 10, M, 6.6, A, GFZ
2014-08-03 00:22:04.6, 0.86N , 146.08E , 10, Mw, 6.6, A, KAN
2014-08-03 00:22:04.0, 0.78N , 146.13E , 10, mb, 6.3, M, INGV
2014-08-03 00:22:03.9, 0.90N , 146.20E , 15, Mw, 7.0, A, BGSB
2014-08-03 00:22:03.7, 1.06N , 146.51E , 10, M, 6.4, M, VAO
2014-08-03 00:22:03.2, 0.84N , 146.14E , 11, Mw, 6.9, M, NEIC
2014-08-03 00:22:03.0, 0.85N , 146.23E , 10, Mi, 7.2, M!, PT
2014-08-03 00:22:02.5, 0.83N , 145.85E , 10, mb, 6.6, A, GSRC
2014-08-03 00:22:00.0, 0.90N , 146.20E , Mw, 7.2, M, PTWC
2014-08-03 00:22:00.0, 0.90N , 146.20E , Mw, 7.2, M, JMA
edit on 08u21321314 by muzzy because: (no reason given)
Tsunami Information
ptwc.weather.gov...
WEHW42 PHEB 030031
TIBHWX
HIZ001>003-005>009-012>014-016>021-023>026-030231-
TSUNAMI INFORMATION STATEMENT NUMBER 1
NWS PACIFIC TSUNAMI WARNING CENTER EWA BEACH HI
231 PM HST SAT AUG 02 2014
TO - CIVIL DEFENSE IN THE STATE OF HAWAII
SUBJECT - TSUNAMI INFORMATION STATEMENT
THIS STATEMENT IS FOR INFORMATION ONLY. NO ACTION REQUIRED.
AN EARTHQUAKE HAS OCCURRED WITH THESE PRELIMINARY PARAMETERS
ORIGIN TIME - 0222 PM HST 02 AUG 2014
COORDINATES - 0.9 NORTH 146.2 EAST
LOCATION - FEDERATED STATES OF MICRONESIA REGION
MAGNITUDE - 7.2 MOMENT
EVALUATION
BASED ON ALL AVAILABLE DATA A DESTRUCTIVE PACIFIC-WIDE TSUNAMI IS
NOT EXPECTED AND THERE IS NO TSUNAMI THREAT TO HAWAII. REPEAT. A
DESTRUCTIVE PACIFIC-WIDE TSUNAMI IS NOT EXPECTED AND THERE IS NO
TSUNAMI THREAT TO HAWAII.
THIS WILL BE THE ONLY STATEMENT ISSUED FOR THIS EVENT UNLESS
ADDITIONAL DATA ARE RECEIVED.
ptwc.weather.gov...
earthquake.usgs.gov...
M6.1
- 11km WNW of Wenping, China
2014-08-03 08:30:13 UTC
Event Time
2014-08-03 08:30:13 UTC
2014-08-03 16:30:13 UTC+08:00 at epicenter
2014-08-03 01:30:13 UTC-07:00 system time
Location
27.245°N 103.427°E depth=10.0km (6.2mi)
Nearby Cities
11km (7mi) WNW of Wenping, China
29km (18mi) WSW of Zhaotong, China
91km (57mi) WNW of Weining, China
135km (84mi) ESE of Xichang, China
731km (454mi) NNW of Ha Noi, Vietnam
a reply to: dreamfox1
Told ya so!, on 25/07/2014 (10 days ago), previous M5+ was 121 days before this, so 10 days warning not to shabby in the big scheme of things?!?
CDEC say 6.5Ms
data.earthquake.cn...
8 aftershocks 云南省昭通市鲁甸县
I should probably do an update for China for July, now that its over, might see the "foreshocks" for this 6.5Ms if there were any
there is about 20km between Useless's and CEDC's locations, with GFZ in the middle of the two.
Told ya so!, on 25/07/2014 (10 days ago), previous M5+ was 121 days before this, so 10 days warning not to shabby in the big scheme of things?!?
CDEC say 6.5Ms
2014-08-03 16:30:10.2
27.1, 103.3
12km
Ms6.5
Ludian County, Zhaotong City, Yunnan Province, China
data.earthquake.cn...
8 aftershocks 云南省昭通市鲁甸县
I should probably do an update for China for July, now that its over, might see the "foreshocks" for this 6.5Ms if there were any
edit on
0800000021421414 by muzzy because: (no reason given)
there is about 20km between Useless's and CEDC's locations, with GFZ in the middle of the two.
edit on 08u21421414 by muzzy because: (no reason
given)
at least 367 people killed, a lot still missing + over 6 bn USD in damage...........
earthquake-report.com...
earthquake-report.com...
originally posted by: muzzy
I should probably do an update for China for July, now that its over, might see the "foreshocks" for this 6.5Ms if there were any
there is about 20km between Useless's and CEDC's locations, with GFZ in the middle of the two.
Hmmm ................ nothing to indicate that something was about to happen in that particulr spot, and that's going back to Jan 2014 ......
China CENC page 2014
those clusters to the NW and NE of Zhaotang, at Yongshan and Gongzain seem to be ongoing, the Yonhgshan since March, haven't looked further back, gotta go, its stopped raining.......
Later...............
todays (UTC) M6+ in context of the the last 3781 years of 631 Chinese M6+'s
China 1767BC-2014AD interactive map
todays (UTC) M6+ in context of the the last 3781 years of 631 Chinese M6+'s
China 1767BC-2014AD interactive map
edit on 0800000021521514 by muzzy because: (no reason given)
See Above
edit on 4-8-2014 by Aqualung2012 because: (no reason given)
A nice little north/south swarm of nine quakes today in Oregon:
2.1
68km ESE of Lakeview, Oregon
2014-08-05 03:24:15 UTC
0.0 km
2.7
68km ESE of Lakeview, Oregon
2014-08-05 03:21:04 UTC
0.0 km
1.1
68km ESE of Lakeview, Oregon
2014-08-05 03:04:59 UTC
0.0 km
1.3
68km ESE of Lakeview, Oregon
2014-08-05 02:58:52 UTC
0.4 km
2.3
68km ESE of Lakeview, Oregon
2014-08-05 02:05:10 UTC
0.7 km
1.6
70km ESE of Lakeview, Oregon
2014-08-05 01:42:16 UTC
1.7 km
2.0
67km ESE of Lakeview, Oregon
2014-08-05 01:17:47 UTC
0.0 km
1.9
69km ESE of Lakeview, Oregon
2014-08-05 01:16:51 UTC
4.1 km
1.6
69km ESE of Lakeview, Oregon
2014-08-04 10:25:22 UTC
0.0 km
NOT!!!
These are actually in northwest Nevada!!!
Stupid 'Useless'!
Check out the depths!
WOQ
new topics
-
Barron Trump has prior commitments?
Mainstream News: 3 hours ago -
Is Taco Bell Satanic?
Education and Media: 6 hours ago -
Scientists Find 7 potential Dyson spheres after Scanning 5 million Objects
Space Exploration: 7 hours ago -
Need help understanding the evolution of WHO as a power structure. Shades of the NWO...?
New World Order: 9 hours ago -
The geography of Eden
Religion, Faith, And Theology: 10 hours ago -
US 'Uniparty' officially throws Christians to the lions...
Conspiracies in Religions: 11 hours ago
top topics
-
REAL ID now a reality
General Conspiracies: 13 hours ago, 7 flags -
Scientists Find 7 potential Dyson spheres after Scanning 5 million Objects
Space Exploration: 7 hours ago, 5 flags -
'I couldn't cope with Britain anymore': Kurdish man pays smuggler to return him to France
Social Issues and Civil Unrest: 16 hours ago, 4 flags -
US 'Uniparty' officially throws Christians to the lions...
Conspiracies in Religions: 11 hours ago, 4 flags -
Is Taco Bell Satanic?
Education and Media: 6 hours ago, 3 flags -
Need help understanding the evolution of WHO as a power structure. Shades of the NWO...?
New World Order: 9 hours ago, 2 flags -
Barron Trump has prior commitments?
Mainstream News: 3 hours ago, 2 flags -
The geography of Eden
Religion, Faith, And Theology: 10 hours ago, 1 flags
active topics
-
Is Taco Bell Satanic?
Education and Media • 21 • : Cre8chaos79 -
Barron Trump has prior commitments?
Mainstream News • 10 • : YouCanCallMeAl -
Russia Ukraine Update Thread - part 3
World War Three • 5769 • : F2d5thCavv2 -
JILL BIDEN says Joe Must Be Re-elected or We Lose Our Democracy.
2024 Elections • 82 • : Flyingclaydisk -
-@TH3WH17ERABB17- -Q- ---TIME TO SHOW THE WORLD--- -Part- --44--
Dissecting Disinformation • 939 • : nugget1 -
President Bidens Health is Declining Faster 5.8.2024 - He Should Stay Home.
2024 Elections • 33 • : WeMustCare -
The geography of Eden
Religion, Faith, And Theology • 2 • : DISRAELI2 -
Candidate TRUMP Now Has Crazy Judge JUAN MERCHAN After Him - The Stormy Daniels Hush-Money Case.
Political Conspiracies • 1482 • : WeMustCare -
Multipal Solar Storms Coming Our Way This Weekend
Fragile Earth • 31 • : GenerationGap -
REAL ID now a reality
General Conspiracies • 27 • : TruthJava