It looks like you're using an Ad Blocker.
Please white-list or disable AboveTopSecret.com in your ad-blocking tool.
Thank you.
Some features of ATS will be disabled while you continue to use an ad-blocker.

Quake Watch 2012
page: 223share:
reply to post by Hellas
Sounds like earthquake sounds to me.
Your description is very similar to what we heard here in Ireland, but only the once because there was only the one earthquake out at sea.
Sounds like earthquake sounds to me.
Your description is very similar to what we heard here in Ireland, but only the once because there was only the one earthquake out at sea.
reply to post by Hellas
No, not really. The Thera eruption was believed to have been between a VEI 6 and 7 (10 cubic km and 100 cu km) - about 60 cu km of dense rock equivalent.
Whilst large and of course very significant it comes nowhere near being one of the largest volcanic events on earth.
It may be around No 3 of events recorded by humans, but humans are a very recent introduction to the planet and their ability to record things is even more recent.
There may well be another eruption on Santorini in the near future, but it will not be caldera forming. For all the 'scary figures' of 20,000,000 cubic metres added to the chamber you have to realise that is 0.02 cu km of material or about 0.012% of the volume of the Thera eruption.
The rule of the Internet is when it is convenient use big scary figures and ignore the facts or how these relate to the whole.
Just to add by the way. The page that kdog linked led to a link which stated that the growth mentioned above was 10 to 20 years worth of growth. Aside from the fact that they have absolutely no way of either knowing or measuring that accurately based on at best a decade or so of satellite data, if we split the difference and call it 15 years worth that would give 45,000 years from empty to full. Methinks there might be a little way to go perhaps? Since there is no known previous eruption of a caldera forming nature I question how they could derive these 'facts'
Santorini does have eruptions relatively frequently.
We're talking about one of the largest volcanic events on Earth in recorded history
No, not really. The Thera eruption was believed to have been between a VEI 6 and 7 (10 cubic km and 100 cu km) - about 60 cu km of dense rock equivalent.
Whilst large and of course very significant it comes nowhere near being one of the largest volcanic events on earth.
It may be around No 3 of events recorded by humans, but humans are a very recent introduction to the planet and their ability to record things is even more recent.
There may well be another eruption on Santorini in the near future, but it will not be caldera forming. For all the 'scary figures' of 20,000,000 cubic metres added to the chamber you have to realise that is 0.02 cu km of material or about 0.012% of the volume of the Thera eruption.
The rule of the Internet is when it is convenient use big scary figures and ignore the facts or how these relate to the whole.
Just to add by the way. The page that kdog linked led to a link which stated that the growth mentioned above was 10 to 20 years worth of growth. Aside from the fact that they have absolutely no way of either knowing or measuring that accurately based on at best a decade or so of satellite data, if we split the difference and call it 15 years worth that would give 45,000 years from empty to full. Methinks there might be a little way to go perhaps? Since there is no known previous eruption of a caldera forming nature I question how they could derive these 'facts'
Santorini does have eruptions relatively frequently.
edit on 13/9/2012 by PuterMan because: To add information link
Magnitude 6.0 - Kuril Islands
L ocation in Google Maps
- Date-Time: Sunday, September 09, 2012 @ 05:39:36 UTC
- Earthquake location: 49.268°N, 155.730°E,
- Earthquake depth: 25.9 km
- Event ID: usc000cmre
Derived from Event Data Source: USGS
Powered by QVSData
Note the date.
This one just came through now in the listings. These are the ones around it.
Prov,Date/Time UTC,Latitude,Longitude,Magnitude,Depth(Km),Location
gfz,2012-09-09 05:39:20, 49.410, 155.600, 5.8, 49.0, Kuril Isls.
usgs,2012-09-09 05:39:20, 49.428, 155.536, 6.0, 58.7, Kuril Isls.
emsc,2012-09-09 05:39:20, 49.516, 155.506, 5.9, 57.0, Kuril Isls.
usgs,2012-09-09 05:39:36, 49.267, 155.730, 6.0, 25.9, Kuril Isls.
gfz,2012-09-09 06:16:21, -10.990, 113.790, 4.3, 10.0, South Of Java. Ind.
This latest event is usc000cmre and the other one in that list is usc000cjd2
These are TWO different earthquakes
OK it is Silly B's time. I just went back to the listing (as above) and they have just reduced the other Mag 6.0 to Mag 5.2
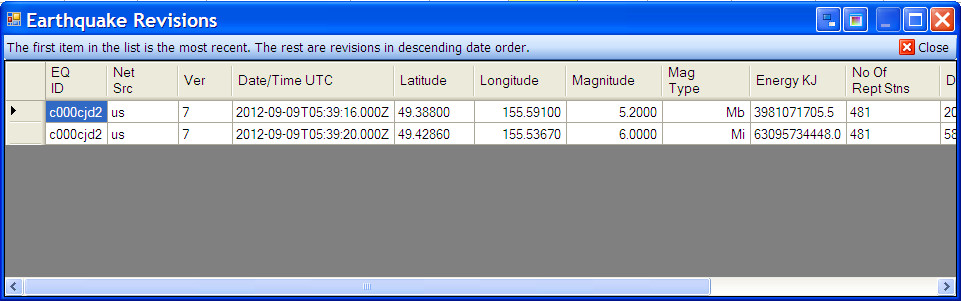
Prov,Date/Time UTC,Latitude,Longitude,Magnitude,Depth(Km),Location
gfz,2012-09-09 05:14:53, 16.350, -98.120, 4.4, 16.0, Nr. Coast Of Guerrero. Mexico
usgs,2012-09-09 05:39:16, 49.388, 155.591, 5.2, 20.1, Kuril Isls.
gfz,2012-09-09 05:39:20, 49.410, 155.600, 5.8, 49.0, Kuril Isls.
emsc,2012-09-09 05:39:20, 49.516, 155.506, 5.9, 57.0, Kuril Isls.
usgs,2012-09-09 05:39:36, 49.267, 155.730, 6.0, 25.9, Kuril Isls.
gfz,2012-09-09 06:16:21, -10.990, 113.790, 4.3, 10.0, South Of Java. Ind.
As the French say, "C'est la vie"
edit on 13/9/2012 by PuterMan because: (no reason given)
Originally posted by BO XIAN
reply to post by JustMike
GREAT RESOURCE.
THANKS
I wasn't aware of it. Interesting to see a station on the North Rim of the Grand Canyon.
There's some wild prediction I came across somewhere that claimed the South Rim was going to end up mushed up against the North Rim . . . including the Hoover Dam area.
Blessings,
The following is my opinion as a member participating in this discussion.
No problem. Glad to help. Actually I think both Puterman and Muzzy would be able to advise better than I on other possible resources for your part of the world; that was just one I happened to have handy.
Re your comments on the Grand Cayon: if the south rim gets mushed up against the north rim that might be bad for tourism.
In other words, it's not very likely to happen...
Okay, must rush back to work!
Regards,
Mike
As an ATS Staff Member, I will not moderate in threads such as this where I have participated as a member.
Hello all, I have a question. I check the USGS daily for kicks (live in FL, no quakes to be had here) I've noticed that for their current last-24
hour list, there have been no recorded earthquakes in Japan. Is this a --no pun intended-- fault of the USGS? If it is something like omissions on
their part, is there a better site to check for Japanese earthquakes?
reply to post by Nyiah
Depends what your setting s for USGS are...you can change the magnitude so you can see the smaller quakes...it might be set to only show above 3 or 4 etc.
Depends what your setting s for USGS are...you can change the magnitude so you can see the smaller quakes...it might be set to only show above 3 or 4 etc.
The following is my opinion as a member participating in this discussion.
reply to post by Nyiah
For Japan, a good resource is the JMA -- Japan Meterological Agency -- which is the official agency in Japan that also monitors and records their quakes. If you go to the JMA Quake Page (in English) it has a map showing recent quakes and also shows the most recent one with a list of shindo values below it.
To explain, the listing shows the quake's magnitude, but below is a list with the "Shindo" (shaking) value. This has been the Japanese method for some years. The lowest shindo value is 1, the highest is 7. You'll see the notations for these values on the map on the above page.
The most recent quake listed there has a magnitude 3.8 (Mw -- moment magnitude, a common international scale), but under it is a list of its shindo values for the nearest regions. As this is a smallish quake, the closest regions would feel it with a shindo of 2, ones further away have it listed as a shindo 1.
In other words, the Japanese wouldn't even put down their cups of Cha for a quake that small.
The value of the shindo is its practicality: when a quake occurs, especially a larger one, what people are concerned about is "How will it affect us where we live? The shindo listings tell them.
The same applies when there is a bigger quake and TV programs are interrupted to warn the people. They advise the public of the big quake's shindo for various regions. Generally, the closer a region is to a quake, the higher the shindo value. And the system is so effective that they can sometimes warn people of the quake before its shock even reaches them.
So it was when the huge quake struck off the Japanese coast in March 2011. The JMA knew of it as soon as the nearest seismos picked up the strong P waves and set off auto-alarms. Within seconds they knew it was huge and also had a fair idea how strong it would be in various regions from their computer modelling software. The JMA alarm warnings went out to the media and the main TV stations immediately broke into their programs to announce the warnings and shindo values -- complete with maps supplied by the JMA!
This is why people in Tokyo, for example, had several seconds' warning before the shocks reached them. It gave time for the trains to be stopped and for people to take cover as best they could. In the schools, the alarm was also given immediately so that teachers were able to warn the children and get them to do the cover drill that they all practice.
All this was done even before USGS had the quake details listed on its pages...
This rapid-action pro-active response, which the Japanese have down to a fine art, probably helped to save lives. After all, they consider this is the real purpose of monitoring quakes. Keeping records of quakes is all well and good but in Japan, at least, their top priority is to try and protect people from harm in quakes in any way humanly possible. And they are very, very good at it.
EDIT TO ADD: Just want to make it clear I'm not criticizing the USGS for not being so quick off the mark with Japan-based quakes. The simple fact is that the Japanese have what is probably the best set-up in the world and for the good reason that they need it. It would be hard for anyone to match them when it comes to quakes in their own back yard.
If the USGS can provide reliable data quickly for its own people, then it's doing what it's really there to do. And most of the time, they do a good job. But they could improve if TPTB would provde more funding so they could run rapid-warning systems as good as the ones the Japanese have. Hopefully this funding will be provided before it's really needed. Hopefully! (End edit.)
Regards,
Mike
As an ATS Staff Member, I will not moderate in threads such as this where I have participated as a member.
edit on 13/9/12 by JustMike because: (no reason given)
reply to post by JediDawn
herer is the earthqake map i like it has how long ago it happened. no matter how small and where.
quakes.globalincidentmap.com...
herer is the earthqake map i like it has how long ago it happened. no matter how small and where.
quakes.globalincidentmap.com...
sorry - posted to wrong thread
edit on 9/13/2012 by Open2Truth because: (no reason given)
I dont like it......its too quiet right now like something huge is building up right now!!!
Looking at all quake monitoring maps
quakes.globalincidentmap.com...
www.ustream.tv...
abclocal.go.com...
earthquake.usgs.gov...
www.intellicast.com...
earthquake.usgs.gov...
Looking at all quake monitoring maps
quakes.globalincidentmap.com...
www.ustream.tv...
abclocal.go.com...
earthquake.usgs.gov...
www.intellicast.com...
earthquake.usgs.gov...
edit on 7/30/2012 by dreamfox1 because: (no reason given)
edit on 7/30/2012 by dreamfox1
because: (no reason given)
reply to post by dreamfox1
Hope the asteroid fly by right now doesn't throw things into a mess.
The asteroid they "just found" again, 2nd surprise NEO in 60 days!
It is also a PHA...potentially hazardous asteroid. At least that's what they keep saying on SLOOH.
Hope the asteroid fly by right now doesn't throw things into a mess.
The asteroid they "just found" again, 2nd surprise NEO in 60 days!
It is also a PHA...potentially hazardous asteroid. At least that's what they keep saying on SLOOH.
Originally posted by timetothink
reply to post by dreamfox1
Hope the asteroid fly by right now doesn't throw things into a mess.
The asteroid they "just found" again, 2nd surprise NEO in 60 days!
It is also a PHA...potentially hazardous asteroid. At least that's what they keep saying on SLOOH.
Yea i thought about that too . We will see what happens.
Magnitude mb 6.0
Region KEP. MENTAWAI REGION, INDONESIA
Date time 2012-09-14 04:51:46.0 UTC
Location 3.41 S ; 100.41 E
Depth 10 km
Distances 484 km W Palembang (pop 1,241,278 ; local time 11:51:46.4 2012-09-14)
209 km W Bengkulu (pop 309,712 ; local time 11:51:46.4 2012-09-14)
185 km SW Sungaipenuh (pop 95,913 ; local time 11:51:46.4 2012-09-14)
Source parameters not yet reviewed by a seismologist
EMSC
Rainbows
Jane
reply to post by JustMike
Nice post Mike I agree completely.
there has to be an end purpose for all the resources poured into earthquake monitoring and the Japanese have it down to a fine art.
I signed up with NIED out of curiosity and was shocked to find there are on average 250 earthquakes a day above Mag 1.0 in "Japan" which for NIED stretches from Taiwan to the Kuril Islands.
NEID supply data to JMA, then JMA review it and put some of them on that web site.
I tried to map them daily but I couldn't keep up!
Anyone serious about Japanese Earthquakes should sign up and become a registered user
www.hinet.bosai.go.jp...
honestly it was a piece of cake, they try to scare you off, but all you need to do is acknowledge where you got the data from if you use it for anything.
I just had a lookee in and the NIED Hi-net automatic hypocenter determination system currently has 570 entries for today and yesterday, 2012-09-13 00:02:13 to 2012-09-14 14:36:17JST, Mag -0.06 to 5.3
same quake as above, different source
www.bmkg.go.id...
6.1 RS (ML)
14-Sep-12 11:51:47 WIB
3.51 S - 100.32 E
83 Km
does not generate TSUNAMI
Epicenter located in
162 km SouthEast KEP-MENTAWAI-SUMBAR ,
168 km SouthWest MUKOMUKO-BENGKULU ,
185 km SouthWest BENGKULUUTARA ,
222 km NorthWest BENGKULU-BENGKULU ,
776 km NorthWest JAKARTA-INDONESIA
www.bmkg.go.id...
edit on 14-9-2012 by muzzy because: (no reason given)
reply to post by dreamfox1
Well I have to say that on a scale of 0 to 10 with 'normal' being 5 then currently it is about 4.98. If I open a 7 days (current day + last 7) view in my earthquake program with the minimum magnitude set at 3.5, I get around 600 to 650 quakes on the page sourced from USGS, EMSC, JMA, GeoNet, GeoScience, NR Canada, BGS, NOA Greece and GFZ Postdam. Of course 3 of these are pretty much repeats of each other but that is not important, it is the numbers.
Right now there are 598 lines for today + the last 7 days so I would have said this was about normal.
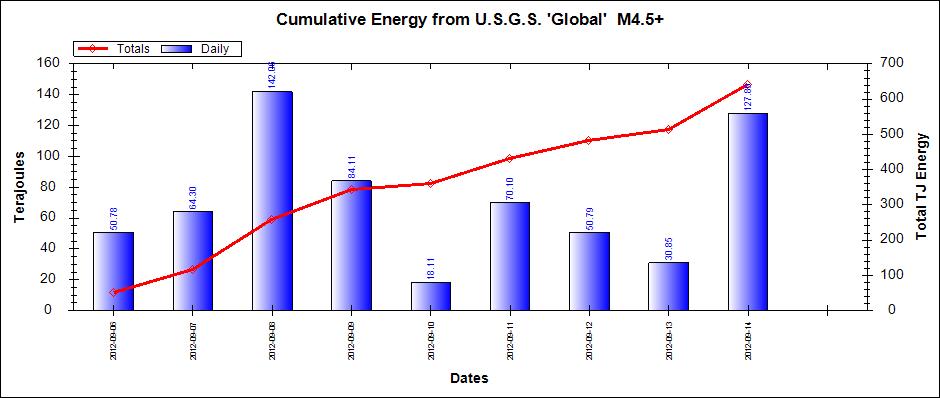
Here is the global 4.5+ energy for the last few days (I avoided the 7 because it swamps the chart)
If you look at a count of the numbers then yes I guess for the last day it has been down a little
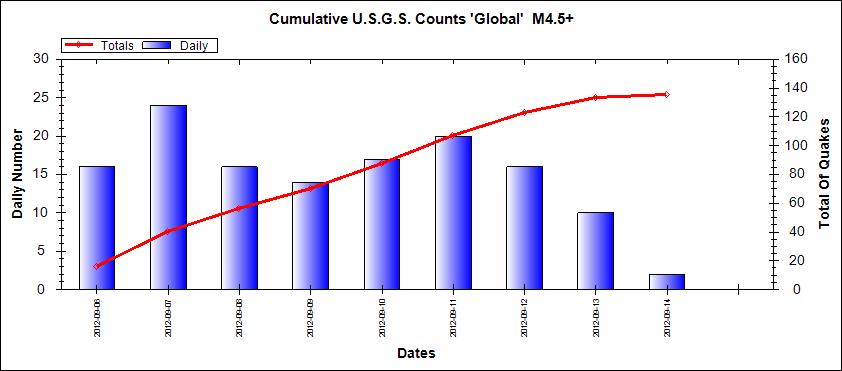
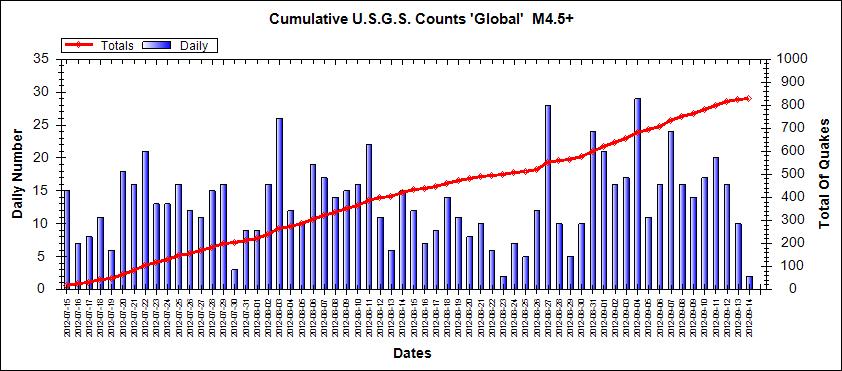
Then again if you look at the past 2 months it is fairly steady and the red line is pretty straight which indicates everything is moving along as normal.
Personally I would say that a lull of one day in activity is way to short to say it is quiet.
Well I have to say that on a scale of 0 to 10 with 'normal' being 5 then currently it is about 4.98. If I open a 7 days (current day + last 7) view in my earthquake program with the minimum magnitude set at 3.5, I get around 600 to 650 quakes on the page sourced from USGS, EMSC, JMA, GeoNet, GeoScience, NR Canada, BGS, NOA Greece and GFZ Postdam. Of course 3 of these are pretty much repeats of each other but that is not important, it is the numbers.
Right now there are 598 lines for today + the last 7 days so I would have said this was about normal.
Here is the global 4.5+ energy for the last few days (I avoided the 7 because it swamps the chart)
If you look at a count of the numbers then yes I guess for the last day it has been down a little
Then again if you look at the past 2 months it is fairly steady and the red line is pretty straight which indicates everything is moving along as normal.
Personally I would say that a lull of one day in activity is way to short to say it is quiet.
reply to post by SpaceJockey1
Dear SpaceJockey, why do you consider it was due?
I think Indonesia gets more than it's fair share of the pie, in fact recently it seems a bit busier, but I am curious as to your reasoning.
Dear SpaceJockey, why do you consider it was due?
Prov,Date/Time UTC,Latitude,Longitude,Magnitude,Depth(Km),Location
usgs,2012-09-14 04:51:47, -3.362, 100.587, 6.2, 19.8, Kepulauan Mentawai Region. Ind.
usgs,2012-09-08 10:51:43, -3.189, 135.084, 6.1, 14.1, Papua. Ind.
usgs,2012-09-03 18:23:04, -10.785, 113.880, 6.4, 8.8, South Of Java. Ind.
usgs,2012-08-18 09:41:54, -1.318, 120.102, 6.3, 10.0, Sulawesi. Ind.
usgs,2012-07-25 00:27:45, 2.707, 96.046, 6.4, 22.0, Simeulue. Ind.
usgs,2012-06-23 04:34:53, 3.011, 97.908, 6.1, 95.0, Northern Sumatra. Ind.
usgs,2012-04-21 01:16:52, -1.603, 134.274, 6.6, 16.0, Nr. N. Coast Of Papua. Ind.
usgs,2012-03-20 17:56:19, -3.830, 140.220, 6.2, 66.9, Papua. Ind.
usgs,2011-10-13 03:16:29, -9.378, 114.628, 6.1, 35.1, South Of Bali. Ind.
I think Indonesia gets more than it's fair share of the pie, in fact recently it seems a bit busier, but I am curious as to your reasoning.
new topics
-
It's the End of May .... Roll the Cheese ! - Cooper's Hill 2024
Other Current Events: 8 minutes ago -
Robert De Niro Anti-Trump Campaign Ad for Biden
2024 Elections: 4 hours ago -
The British crown completes its seizure of power over the world. Part II
ATS Skunk Works: 7 hours ago -
President JOE BIDEN Continues Insulting Black Americans - But Wants Their Vote in November 2024.
2024 Elections: 11 hours ago
top topics
-
Euclid Space Telescope Reveals Stunning Images from it's First 24 hours of observations
Space Exploration: 17 hours ago, 13 flags -
Robert De Niro Anti-Trump Campaign Ad for Biden
2024 Elections: 4 hours ago, 7 flags -
President JOE BIDEN Continues Insulting Black Americans - But Wants Their Vote in November 2024.
2024 Elections: 11 hours ago, 6 flags -
The British crown completes its seizure of power over the world. Part II
ATS Skunk Works: 7 hours ago, 4 flags -
It's the End of May .... Roll the Cheese ! - Cooper's Hill 2024
Other Current Events: 8 minutes ago, 0 flags
active topics
-
Bring back national service if Tories win election
Political Issues • 90 • : andy06shake -
Peru Court: River has Rights
Political Issues • 10 • : F2d5thCavv2 -
It's the End of May .... Roll the Cheese ! - Cooper's Hill 2024
Other Current Events • 0 • : gortex -
Man fined $600 for "body slamming" an Orca
Other Current Events • 54 • : Oldcarpy2 -
Robert De Niro Anti-Trump Campaign Ad for Biden
2024 Elections • 46 • : Daughter2v2 -
Whom among you has returned from the dead?
Philosophy and Metaphysics • 25 • : orionthehunter -
The Acronym Game .. Pt.3
General Chit Chat • 7880 • : F2d5thCavv2 -
-@TH3WH17ERABB17- -Q- ---TIME TO SHOW THE WORLD--- -Part- --44--
Dissecting Disinformation • 1171 • : Thoughtful3 -
Live: President Trump Addresses Libertarian National Convention In D.C. – 5/25/24
2024 Elections • 123 • : WeMustCare -
Mysterious Monoliths Are Back...
The Gray Area • 29 • : Caver78