It looks like you're using an Ad Blocker.
Please white-list or disable AboveTopSecret.com in your ad-blocking tool.
Thank you.
Some features of ATS will be disabled while you continue to use an ad-blocker.

1929 Stock Market chart update, coincidence or something else
page: 3share:
kx12x
I think it's time to stop blaming one party and realize they're all to blame.
I agree.
Bush started this, but Obama has had more than enough time to counter it and improve the situation.
He's done nothing but continue and expand the problems that Bush started, hence.. they are all in on it together!
ChaoticOrder
reply to post by webedoomed
I saw similar charts a couple years ago, and guess what? They never panned out.
You saying it doesn't prove anything. Find the graph and post it here. Though I some how doubt you will find it, and even if you do I doubt it will show mirroring anything close to what we are seeing here. Nearly every bump and dip in the graph is being mirrored. It doesn't take a mathematical genius to understand the astronomical odds of those two trends just being so similar by pure coincidence.edit on 5/2/2014 by ChaoticOrder because: (no reason given)
What a joke. The graph shown is far too narrow in scope for a pertinent discussion of the facts. Google Andex Chart and buy one, then go to bed and dream of a sheep with your face on it.
ChaoticOrder
reply to post by buster2010
That is a ridiculous generalization of the problem. Historically, republicans are supposed the be the ones promoting anti-socialist ideals such as minimal taxes for the big corporations and the democrats are supposed to be the ones undermining the free market with their wealth redistribution schemes and bailouts for bankrupted businesses. Rand Paul is a republican and so was his father, neither of them support government bailouts or wealth redistribution, but they do support a minimal sized government with minimal tax rates. But they are obviously not the norm within the republican party and what you are saying does have some truth to it. But the fact it does have some truth it just shows how backwards and distant from their party ideals politicians have become.edit on 5/2/2014 by ChaoticOrder because: (no reason given)
Historically the Republicans were conservatives but now they are conservative in name only they are now corporatists. When Reagan was elected they threw that out the door and serve only Wall Street now. Rand Paul like his father are libertarians they have said this many times. They ran under the Republican ticket because in the states they ran in there was virtually no chance of them winning if they ran under the libertarian ticket.
reply to post by 19KTankCommander
If that chat keeps up, it looks like we'll end up with a 20% correction, vsmore than 50% in the 29 crash. While the shape is the same, the scale isn't.
If that chat keeps up, it looks like we'll end up with a 20% correction, vsmore than 50% in the 29 crash. While the shape is the same, the scale isn't.
This is wrong comparison on so many levels, points on DOW, circumstances , different politics at that time, different scale of power.US is good for
now as long as you dont vote another Bush in the house like Jeb Bush.
reply to post by ChaoticOrder
I would have thought that only the 1% know of this and are getting ready to make some money when SHTF.
We are just the .25% of Conspiracy Theorists that are privy to some research by another member. No?
Actually, I highly doubt that even 1% of the population is aware of this graph or data similar to it.
I would have thought that only the 1% know of this and are getting ready to make some money when SHTF.
We are just the .25% of Conspiracy Theorists that are privy to some research by another member. No?
reply to post by 19KTankCommander
Fantastic Post! There is no QUESTION to the similarities shown in the graph..
Fantastic Post! There is no QUESTION to the similarities shown in the graph..
xavi1000
This is wrong comparison on so many levels, points on DOW, circumstances , different politics at that time, different scale of power...
Surely these points don't make the similarity wrong, just inexplicable.
reply to post by 19KTankCommander
Isn't it sad that that 85 years later we still have the quality of life for a generation dictated by numbers on a graph which are there primarily to benefit the few wealthy stock holders? People say things have changed which is true but have they really in the broader sense?
In other news the wall st journal has addressed the similarities with the data in a recent article: Stock Parallels to 1928-29 Really Aren't So Alarming (link not functional Google the title)
People quoted in the article talk about the fact that you could find similarities in the data with any period if you looked hard enough, usually ending with a crash. Others talk about data mining technologies advancement and how they are used to spot such trends.
They also however address the current instability of the market and that it could go bull any time soon.
Don't shoot the messenger, peace.
edit on 6-2-2014 by MongusePro because: Link not working
Did you chart a couple of other time periods also. Call me a conspiracist, but If someone is showing me a pattern, I want to see the anti pattern, or
the same pattern repeated many times
So, your telling me a false flag can happen any day now???? Sochi??????
Heres my Question;
IF the crash occurs AGAIN, and there is another "Great depression" triggered.
Are we finally going to say enough, and kick BOTH Parties that got us here out of office?
Anyone who currently holds office should be out on the streets for the Current state of this nation,
Every time someone sees a "rep" or "dem" running, by all right we should be laughing our assess off saying "not those A-holes again"
BUT nooooooo we all have to have a Sports team, and we stick by them no matter how #ty they are dont we...
By this point, Anyone who bangs their Two party drum makes me sick.
Yes it most likely will correct itself, but there is a huge difference between 1929 and now.
Even if the market crashed 50%, we have something they didn't back in 1929. A worldwide infrastructure and 7 billion + people.
Back in 1929 they didn't have the means to get things back up and running quickly again, today we do.
Even if the market crashed 50%, we have something they didn't back in 1929. A worldwide infrastructure and 7 billion + people.
Back in 1929 they didn't have the means to get things back up and running quickly again, today we do.
benrl
Heres my Question;
IF the crash occurs AGAIN, and there is another "Great depression" triggered.
Are we finally going to say enough, and kick BOTH Parties that got us here out of office?
Anyone who currently holds office should be out on the streets for the Current state of this nation,
Every time someone sees a "rep" or "dem" running, by all right we should be laughing our assess off saying "not those A-holes again"
BUT nooooooo we all have to have a Sports team, and we stick by them no matter how #ty they are dont we...
By this point, Anyone who bangs their Two party drum makes me sick.
Jesse Ventura was in an interview when they asked him if he was going to run for president and said that even though you can get in the running if you can't get into the debates then you have no chance of winning. And he is right most people here in the states most people think we only have two parties. And it's thanks to the media that people think that way how many times do they talk about candidates from other parties.
Realtruth
Yes it most likely will correct itself, but there is a huge difference between 1929 and now.
Even if the market crashed 50%, we have something they didn't back in 1929. A worldwide infrastructure and 7 billion + people.
Back in 1929 they didn't have the means to get things back up and running quickly again, today we do.
We also have enough weapons to destroy all life on Earth 40 times over in a single day.
Back then they didn't have that either.... when only World War could save the collapsing economies of the time.
God Bless,
19KTankCommander
I had to cut and past todays results, you can verify the chart by checking the Dows charts and going to McClellan.com for their chart for you own comparison.

I know I can check, but I have to call BS on this chart. It's just too much of a mirror image. It's either false, or somebody spent way too much time trying to manipulate the data to get it this close.
Uh-uh. Not buying it.
edit on 6-2-2014 by Blue Shift because: (no reason given)
reply to post by Blue Shift
It's absolutely false.
If anyone bothers to check the chart from 1929, they'll see a much different looking graph, which drops near 90%, not 50%.
Completely manipulated nonsense.
GD Chart
Not even remotely close!
Here's that whole shaping the context to fool gullible people info I was talking about:
An Incredibly Misleading Chart is Warning of a 1929 Style Market Crash
reply to post by ChaoticOrder
What's that about my "illogical" reasoning? Seems people don't want to apply reasoning that counters their irrational fears and preconceived notions.
It's absolutely false.
If anyone bothers to check the chart from 1929, they'll see a much different looking graph, which drops near 90%, not 50%.
Completely manipulated nonsense.
GD Chart
Not even remotely close!
Here's that whole shaping the context to fool gullible people info I was talking about:
An Incredibly Misleading Chart is Warning of a 1929 Style Market Crash
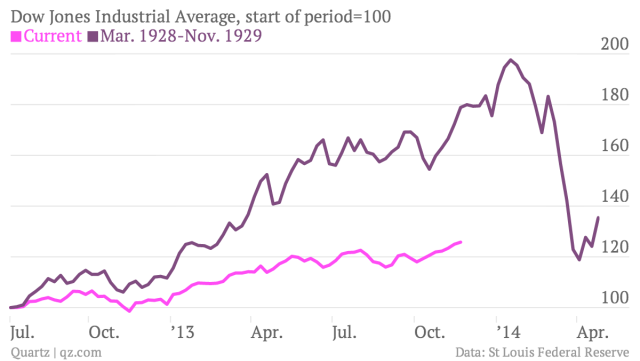
In McClellan’s chart, the y-axis for the 1928-29 line (on the right) uses a much different scale from the axis that applies to the current line (on the left). This is what makes the two lines look superficially similar. But if you index both series to their starting points—early July 2012 and mid-February 1928, which aligns the October 1929 crash with mid-January 2014—and put them on the same scale, the results tell a different story
reply to post by ChaoticOrder
What's that about my "illogical" reasoning? Seems people don't want to apply reasoning that counters their irrational fears and preconceived notions.
edit on 6-2-2014 by webedoomed because: notamathgeniusbutstilltopofmyclass.u?
SWCCFAN
I have been watching it like a hawk and was planning on doing a thread on this good job on the graphic. We all know what is coming we are over due. Maybe a terror attack a sochi will be the kickstart.
There will be no terror or doom event at the Olympics! Over the years it has become very apparent that whenever certain things are covered by MSM like terror alerts going on right now in the Olympics its only to keep us looking in that direction. Something else is going on under that guise. That you can be sure of.
Now the real question is what don't they want us knowing and looking at that they are doing right now???
reply to post by twfau
Agreed. Some days I even see it reaching a point where the "market" no longer exists. If everything is completely and openly controlled by a single person (or even a small entity), it will no longer have any usefulness.
Agreed. Some days I even see it reaching a point where the "market" no longer exists. If everything is completely and openly controlled by a single person (or even a small entity), it will no longer have any usefulness.
new topics
-
A Warning to America: 25 Ways the US is Being Destroyed
New World Order: 1 hours ago -
America's Greatest Ally
General Chit Chat: 1 hours ago -
President BIDEN's FBI Raided Donald Trump's Florida Home for OBAMA-NORTH KOREA Documents.
Political Conspiracies: 6 hours ago -
Maestro Benedetto
Literature: 8 hours ago -
Is AI Better Than the Hollywood Elite?
Movies: 8 hours ago -
Las Vegas UFO Spotting Teen Traumatized by Demon Creature in Backyard
Aliens and UFOs: 11 hours ago
top topics
-
President BIDEN's FBI Raided Donald Trump's Florida Home for OBAMA-NORTH KOREA Documents.
Political Conspiracies: 6 hours ago, 27 flags -
Supreme Court Oral Arguments 4.25.2024 - Are PRESIDENTS IMMUNE From Later Being Prosecuted.
Above Politics: 17 hours ago, 8 flags -
Weinstein's conviction overturned
Mainstream News: 16 hours ago, 8 flags -
Gaza Terrorists Attack US Humanitarian Pier During Construction
Middle East Issues: 13 hours ago, 8 flags -
Massachusetts Drag Queen Leads Young Kids in Free Palestine Chant
Social Issues and Civil Unrest: 15 hours ago, 7 flags -
Las Vegas UFO Spotting Teen Traumatized by Demon Creature in Backyard
Aliens and UFOs: 11 hours ago, 6 flags -
Meadows, Giuliani Among 11 Indicted in Arizona in Latest 2020 Election Subversion Case
Mainstream News: 14 hours ago, 5 flags -
2024 Pigeon Forge Rod Run - On the Strip (Video made for you)
Automotive Discussion: 12 hours ago, 4 flags -
Is AI Better Than the Hollywood Elite?
Movies: 8 hours ago, 3 flags -
Maestro Benedetto
Literature: 8 hours ago, 1 flags
active topics
-
The Acronym Game .. Pt.3
General Chit Chat • 7751 • : F2d5thCavv2 -
Salvador Dali's Moustaches
People • 28 • : zosimov -
Is AI Better Than the Hollywood Elite?
Movies • 17 • : ThePsycheaux -
The best Rice dish i've ever tasted... Kimchi Rice
Food and Cooking • 26 • : lamhaocc -
A Warning to America: 25 Ways the US is Being Destroyed
New World Order • 1 • : 727Sky -
Massachusetts Drag Queen Leads Young Kids in Free Palestine Chant
Social Issues and Civil Unrest • 15 • : tarantulabite1 -
America's Greatest Ally
General Chit Chat • 1 • : BingoMcGoof -
How ageing is" immune deficiency"
Medical Issues & Conspiracies • 35 • : annonentity -
HORRIBLE !! Russian Soldier Drinking Own Urine To Survive In Battle
World War Three • 49 • : Freeborn -
Gaza Terrorists Attack US Humanitarian Pier During Construction
Middle East Issues • 30 • : Asher47