It looks like you're using an Ad Blocker.
Please white-list or disable AboveTopSecret.com in your ad-blocking tool.
Thank you.
Some features of ATS will be disabled while you continue to use an ad-blocker.

Corona Virus Updates Part 2
page: 61share:
a reply to: muzzleflash
I'm not here for this at all, it seemed like a good place to see all coronavirus related stuff in one place, there were multiple links per page, much easier than twitter or google, then it turned into yourself writing ridiculously long posts saying same thing over and over. I'll make my own log of this without contributing on here anymore, my time here has been short lived 5 days I think
I'm not here for this at all, it seemed like a good place to see all coronavirus related stuff in one place, there were multiple links per page, much easier than twitter or google, then it turned into yourself writing ridiculously long posts saying same thing over and over. I'll make my own log of this without contributing on here anymore, my time here has been short lived 5 days I think
originally posted by: Halfswede
originally posted by: Necrose
People on ATS be like: hey look, exponential increase.
Despite adding less new cases than the day before, it's still exponential because that's the math on ATS.
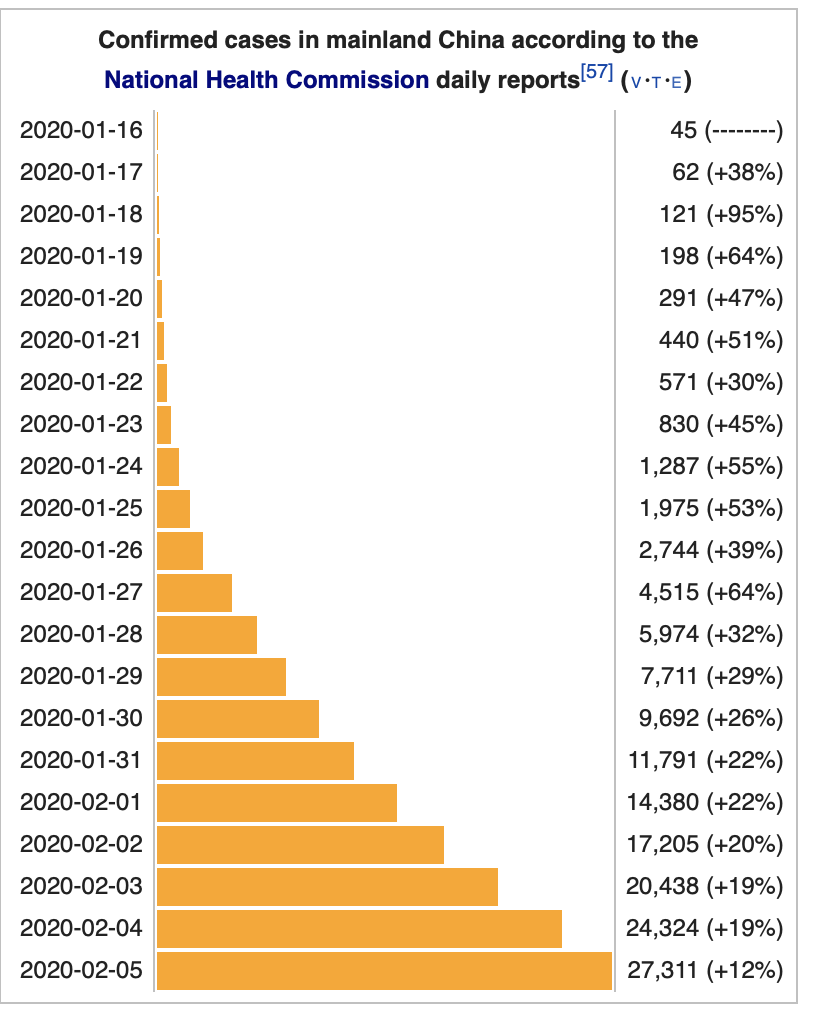
Your own graph is showing an exponential curve -- follow the tips of the bars. It can be easily fit with an exponential. Are you looking at this pic and seeing linear growth?? I tried to walk you through it before, but really really need to take some maths.
WHAT??
I can draw a straight line from around the 30th of January until today. It stopped being an exponential increase on the 28th.
a reply to: muzzleflash
Hey … respect to you and all that you say, but the only reason we disagree potentially - is that you believe the official numbers from China, and I do not. The US government lies; so, why trust the Chinese government which is even more tyrannical and centralized? I can't trust those numbers. The usual math of epidemiology does not mesh with them.
Hey … respect to you and all that you say, but the only reason we disagree potentially - is that you believe the official numbers from China, and I do not. The US government lies; so, why trust the Chinese government which is even more tyrannical and centralized? I can't trust those numbers. The usual math of epidemiology does not mesh with them.
originally posted by: jedi_hamster
originally posted by: Necrose
originally posted by: jedi_hamster
originally posted by: Necrose
This is what DYING OUT or CONTAINMENT looks like. Today we're gonna get a lower % increase than yesterday, it's 16% now, gonna be around 18% once the China report comes in.
this is what complete BS looks like. i did catch up on this thread already, but in case someone's still catching up and comes across those, i prefer to explain in simple terms, since apparently noone did.
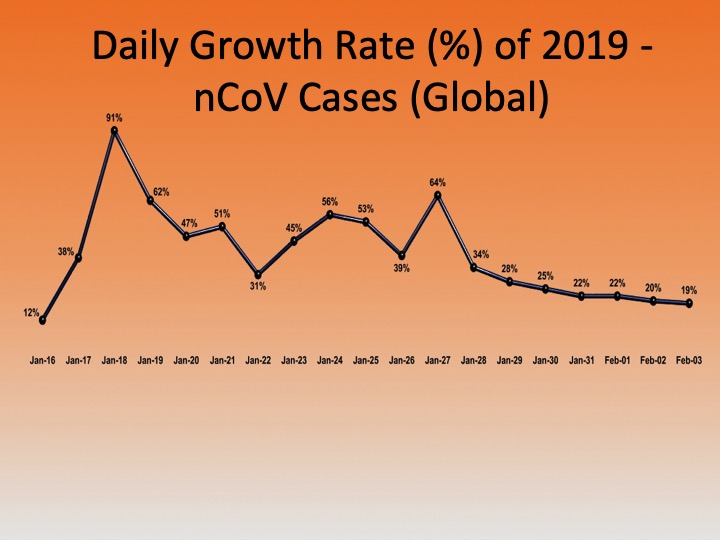
that graph is a manipulation. it's a growth rate. think of it as acceleration. when car's acceleration goes down, does it mean it's slowing down? of course not. it's just moving ahead with constant speed when the acceleration goes down to zero.
originally posted by: Necrose
originally posted by: ARM1968
Err, no it isn’t. Even the skewed official figures show its going up. a reply to: Necrose
I don't know man, I feel stupid explaining elementary school maths, simply put : a daily increase in % is declining, hence it's slowing down.
you should feel that way, since it's entirely wrong.
originally posted by: Necrose
originally posted by: ARM1968
originally posted by: Necrose
originally posted by: ARM1968
Err, no it isn’t. Even the skewed official figures show its going up. a reply to: Necrose
I don't know man, I feel stupid explaining elementary school maths, simply put : a daily increase in % is declining, hence it's slowing down.
You’re an idiot. Sorry to break it to you, as you’re clearly unaware. Enjoy.
Ok let's say hypothetically...
Today's increase is going to be 18% and the rate by which the number of confirmed cases increases is declining 1% per day.
Tomorrow 17%, then 16, 15, 14 and in 2 weeks it hits 0%, so 18 days from now the daily increase is going to be 0% = 0 new cases. What then? It has to top out at some point if it's not speeding up, but slowing down.
Instead of saying I'm an idiot, show me what's wrong with my calculations so both of us can be "aware".
EDIT: again, we're using China's officially reported numbers
0% daily increase of new cases DOES NOT EQUAL 0 new cases. it's a goddamn INCREASE.
once the increase of new cases goes down to zero, the number of new cases daily becomes constant, so the growth becomes linear. so far it isn't, it's exponential, as can be seen on every "infections per day" graph on the web available for this virus.
and that's all using the official numbers of course.
then comes this:
Tencent may have accidentally leaked real data on Wuhan virus deaths
Netizens also noticed that each time the screen with the large numbers appears, it shows a comparison with the previous day's data which demonstrates a "reasonable" incremental increase, much like comparisons of official numbers. This has led some netizens to speculate that Tencent has two sets of data, the real data and "processed" data.
check out recent videos showing smog in Wuhan. in a city with virtually all the traffic stopped. with all factories shut down. then ask yourself, what the hell could they be burning?
i know it was suggested they're burning bodies. i know Tencent leak was mentioned already. still, this thread gets more and more chaotic day after day, so i figured it could use a nudge. ignore all the naysayers, they'll just keep flooding you with distorted facts to "prove" their point.
focus, people.
ARE YOU SH!TTING ME? SO TELL ME HOW MANY NEW CASES WOULD THERE BE TODAY IF THE INCREASE WAS 0 %?
THE % IS NOT HOW MUCH MORE THAN THE DAY BEFORE, BUT % INCREASE FROM GRAND TOTAL !!!!!!!! SO 1% INCREASE WOULD BE ~250 cases, 10% = 2500 CASES, 100% = 25000 and the fkn 0% increase means = 0.0000000 new cases so the number of TOTAL cases stays the same as yesterday....
you're trying hard to distort the facts. infection rate graphs usually show the number of cases, period. like here:
wuflu.live...
then you can calculate daily increase percentage-wise from previous day, for 2/4 it's 3921 vs 3237, so 21% increase, for 2/3 3237 vs 2873 so 12% increase, and so on.
but you just can't look at it that way, because even when those numbers show it's accelerating, it's a distorted view. your "grand total" changes every day, so for example if you have 5000 cases in day one, 6000 cases in day two and 7000 cases in day three, you can claim it's 20% increase in day two and 16% increase in day three, so "it's slowing down" - which is complete BS.
I agree that it is exponential, but the exponential rise is on the decline. So that is a good thing. Even through the numbers keep going up, the exponential rate at which they do is going down. At this rate, in a week or so, we will see new cases level off and become linear for a bit, and then a decline.
Not the best news, but better than nothing.
originally posted by: Power_Semi
originally posted by: Necrose
This guy POWER SEMI thinks 12% increase means we got 12% more cases than yesterday even tho yesterday was around 4000 and we got 2900 today so far DDDDDDDD
IT'S -7% over yesterday (waiting for China so gonna be like -4%) but still.... LMAO !
That isn't what I said at all, I didn't mention 12% or -7% you did.
You're just showing your stupidity now.
If you're saying at 0% there would be no new cases, then how can there be more new cases at -7%.
You're contradicting yourself dummy.
This is simple math and you clearly don't understand it.
We have more total cases than the day before yesterday and the number of new cases is lower than yesterday's number of new cases.
TODAY'S INCREASE IS 7% LOWER THAN YESTERDAY'S INCREASE DUMMY.
originally posted by: Halfswede
originally posted by: Necrose
People on ATS be like: hey look, exponential increase.
Despite adding less new cases than the day before, it's still exponential because that's the math on ATS.
Your own graph is showing an exponential curve -- follow the tips of the bars. It can be easily fit with an exponential. Are you looking at this pic and seeing linear growth?? I tried to walk you through it before, but really really need to take some maths.
She doesn't understand mate, it's called the Dunning–Kruger effect:
It is a cognitive bias in which people assess their cognitive ability as greater than it is. It is related to the cognitive bias of illusory superiority and comes from the inability of people to recognize their lack of ability.
originally posted by: Necrose
originally posted by: Power_Semi
originally posted by: Necrose
This guy POWER SEMI thinks 12% increase means we got 12% more cases than yesterday even tho yesterday was around 4000 and we got 2900 today so far DDDDDDDD
IT'S -7% over yesterday (waiting for China so gonna be like -4%) but still.... LMAO !
That isn't what I said at all, I didn't mention 12% or -7% you did.
You're just showing your stupidity now.
If you're saying at 0% there would be no new cases, then how can there be more new cases at -7%.
You're contradicting yourself dummy.
This is simple math and you clearly don't understand it.
We have more total cases than the day before yesterday and the number of new cases is lower than yesterday's number of new cases.
TODAY'S INCREASE IS 7% LOWER THAN YESTERDAY'S INCREASE DUMMY.
Again, you said if the growth rate was 0% there would be no new cases and the total would be the same as yesterday - so how has the total number of cases gone up with a -7% increase then.
Clearly you do not have a clue what you're talking about.
a reply to: Necrose
If what’s reported is accurate though, which is getting mounting evidence to the contrary and think the point to bear in mind is that it took from beginning of December until mid jan to start seeing it jump up given that would you say it still increasing, slowing down or new cases are not being added ?
Imo Given the history of the world we live in and the governments of the world propensity for hiding the truth and covering things up faster than a cat crapping in a kids sand box id expect that figures are inaccurate and things are being covered up which makes everything a guess ( all be it educated but only based on what we’re drop fed🤷🏽♂️)
originally posted by: MetalThunder
Good news Detroit .... So far
Detroit Metro Airport traveler is cleared of coronavirus
The individual did not meet the Centers for Disease Control and Prevention criteria for coronavirus, the statement said.
The criteria for testing includes fever or lower respiratory illness and travel history to mainland China within 14 days of symptom onset or exposure to a laboratory-confirmed novel coronavirus case.
Strange that the article didn't mention where the patient came from.
"The individual did not meet the Centers for Disease Control and Prevention criteria for coronavirus, the statement said.
The criteria for testing includes fever or lower respiratory illness and travel history to mainland China within 14 days of symptom onset or exposure to a laboratory-confirmed novel coronavirus case. "
So she could have come from Vietnam, Taiwan, Japan... and still had a fever and or lower respiratory illness, the CDC would send her away. Just brilliant
a reply to: Necrose
I didn't say it increased since yesterday, and I said its been increasing with fluctuations.
Here is a week from Jan 28th to Feb 3rd according to bnonews.
Feb 3rd: 2,345 new cases and 64 new deaths in Hubei province, China
Feb 2nd: 2,103 new cases and 56 new deaths in Hubei province, China
Feb 1st: 1,921 new cases and 45 new deaths in Hubei province, China
Jan 31st: 1,347 new cases and 45 new deaths in Hubei province, China
Jan 30th: 903 new cases and 42 new deaths in Hubei province, China
Jan 29th: 1,032 new cases and 37 new deaths in Hubei province, China
Jan 28th: 840 new cases and 25 new deaths in Hubei province, China
Now maybe I am simple but to me it looks like it decreased in numbers provide from Jan 29th to Jan 30th but then shot up again on Jan 31st. I would call that increasing overall with fluctuations.
originally posted by: MrRCflying
originally posted by: jedi_hamster
originally posted by: Necrose
originally posted by: jedi_hamster
originally posted by: Necrose
This is what DYING OUT or CONTAINMENT looks like. Today we're gonna get a lower % increase than yesterday, it's 16% now, gonna be around 18% once the China report comes in.
this is what complete BS looks like. i did catch up on this thread already, but in case someone's still catching up and comes across those, i prefer to explain in simple terms, since apparently noone did.
that graph is a manipulation. it's a growth rate. think of it as acceleration. when car's acceleration goes down, does it mean it's slowing down? of course not. it's just moving ahead with constant speed when the acceleration goes down to zero.
originally posted by: Necrose
originally posted by: ARM1968
Err, no it isn’t. Even the skewed official figures show its going up. a reply to: Necrose
I don't know man, I feel stupid explaining elementary school maths, simply put : a daily increase in % is declining, hence it's slowing down.
you should feel that way, since it's entirely wrong.
originally posted by: Necrose
originally posted by: ARM1968
originally posted by: Necrose
originally posted by: ARM1968
Err, no it isn’t. Even the skewed official figures show its going up. a reply to: Necrose
I don't know man, I feel stupid explaining elementary school maths, simply put : a daily increase in % is declining, hence it's slowing down.
You’re an idiot. Sorry to break it to you, as you’re clearly unaware. Enjoy.
Ok let's say hypothetically...
Today's increase is going to be 18% and the rate by which the number of confirmed cases increases is declining 1% per day.
Tomorrow 17%, then 16, 15, 14 and in 2 weeks it hits 0%, so 18 days from now the daily increase is going to be 0% = 0 new cases. What then? It has to top out at some point if it's not speeding up, but slowing down.
Instead of saying I'm an idiot, show me what's wrong with my calculations so both of us can be "aware".
EDIT: again, we're using China's officially reported numbers
0% daily increase of new cases DOES NOT EQUAL 0 new cases. it's a goddamn INCREASE.
once the increase of new cases goes down to zero, the number of new cases daily becomes constant, so the growth becomes linear. so far it isn't, it's exponential, as can be seen on every "infections per day" graph on the web available for this virus.
and that's all using the official numbers of course.
then comes this:
Tencent may have accidentally leaked real data on Wuhan virus deaths
Netizens also noticed that each time the screen with the large numbers appears, it shows a comparison with the previous day's data which demonstrates a "reasonable" incremental increase, much like comparisons of official numbers. This has led some netizens to speculate that Tencent has two sets of data, the real data and "processed" data.
check out recent videos showing smog in Wuhan. in a city with virtually all the traffic stopped. with all factories shut down. then ask yourself, what the hell could they be burning?
i know it was suggested they're burning bodies. i know Tencent leak was mentioned already. still, this thread gets more and more chaotic day after day, so i figured it could use a nudge. ignore all the naysayers, they'll just keep flooding you with distorted facts to "prove" their point.
focus, people.
ARE YOU SH!TTING ME? SO TELL ME HOW MANY NEW CASES WOULD THERE BE TODAY IF THE INCREASE WAS 0 %?
THE % IS NOT HOW MUCH MORE THAN THE DAY BEFORE, BUT % INCREASE FROM GRAND TOTAL !!!!!!!! SO 1% INCREASE WOULD BE ~250 cases, 10% = 2500 CASES, 100% = 25000 and the fkn 0% increase means = 0.0000000 new cases so the number of TOTAL cases stays the same as yesterday....
you're trying hard to distort the facts. infection rate graphs usually show the number of cases, period. like here:
wuflu.live...
then you can calculate daily increase percentage-wise from previous day, for 2/4 it's 3921 vs 3237, so 21% increase, for 2/3 3237 vs 2873 so 12% increase, and so on.
but you just can't look at it that way, because even when those numbers show it's accelerating, it's a distorted view. your "grand total" changes every day, so for example if you have 5000 cases in day one, 6000 cases in day two and 7000 cases in day three, you can claim it's 20% increase in day two and 16% increase in day three, so "it's slowing down" - which is complete BS.
I agree that it is exponential, but the exponential rise is on the decline. So that is a good thing. Even through the numbers keep going up, the exponential rate at which they do is going down. At this rate, in a week or so, we will see new cases level off and become linear for a bit, and then a decline.
Not the best news, but better than nothing.
i certainly hope so.
but then, that growth wasn't exactly steady in the past weeks. it had its ups and downs, so i wouldn't say it's slowing down just yet. one or two day drop in exponential rate doesn't mean much, especially when it comes to official numbers. we'll have to wait a few more days to see where it's going.
my point is, the whole percentage view is a distorted one and serves nothing but screwing with official numbers.
originally posted by: MrRCflying
originally posted by: jedi_hamster
originally posted by: Necrose
originally posted by: jedi_hamster
originally posted by: Necrose
This is what DYING OUT or CONTAINMENT looks like. Today we're gonna get a lower % increase than yesterday, it's 16% now, gonna be around 18% once the China report comes in.
this is what complete BS looks like. i did catch up on this thread already, but in case someone's still catching up and comes across those, i prefer to explain in simple terms, since apparently noone did.
that graph is a manipulation. it's a growth rate. think of it as acceleration. when car's acceleration goes down, does it mean it's slowing down? of course not. it's just moving ahead with constant speed when the acceleration goes down to zero.
originally posted by: Necrose
originally posted by: ARM1968
Err, no it isn’t. Even the skewed official figures show its going up. a reply to: Necrose
I don't know man, I feel stupid explaining elementary school maths, simply put : a daily increase in % is declining, hence it's slowing down.
you should feel that way, since it's entirely wrong.
originally posted by: Necrose
originally posted by: ARM1968
originally posted by: Necrose
originally posted by: ARM1968
Err, no it isn’t. Even the skewed official figures show its going up. a reply to: Necrose
I don't know man, I feel stupid explaining elementary school maths, simply put : a daily increase in % is declining, hence it's slowing down.
You’re an idiot. Sorry to break it to you, as you’re clearly unaware. Enjoy.
Ok let's say hypothetically...
Today's increase is going to be 18% and the rate by which the number of confirmed cases increases is declining 1% per day.
Tomorrow 17%, then 16, 15, 14 and in 2 weeks it hits 0%, so 18 days from now the daily increase is going to be 0% = 0 new cases. What then? It has to top out at some point if it's not speeding up, but slowing down.
Instead of saying I'm an idiot, show me what's wrong with my calculations so both of us can be "aware".
EDIT: again, we're using China's officially reported numbers
0% daily increase of new cases DOES NOT EQUAL 0 new cases. it's a goddamn INCREASE.
once the increase of new cases goes down to zero, the number of new cases daily becomes constant, so the growth becomes linear. so far it isn't, it's exponential, as can be seen on every "infections per day" graph on the web available for this virus.
and that's all using the official numbers of course.
then comes this:
Tencent may have accidentally leaked real data on Wuhan virus deaths
Netizens also noticed that each time the screen with the large numbers appears, it shows a comparison with the previous day's data which demonstrates a "reasonable" incremental increase, much like comparisons of official numbers. This has led some netizens to speculate that Tencent has two sets of data, the real data and "processed" data.
check out recent videos showing smog in Wuhan. in a city with virtually all the traffic stopped. with all factories shut down. then ask yourself, what the hell could they be burning?
i know it was suggested they're burning bodies. i know Tencent leak was mentioned already. still, this thread gets more and more chaotic day after day, so i figured it could use a nudge. ignore all the naysayers, they'll just keep flooding you with distorted facts to "prove" their point.
focus, people.
ARE YOU SH!TTING ME? SO TELL ME HOW MANY NEW CASES WOULD THERE BE TODAY IF THE INCREASE WAS 0 %?
THE % IS NOT HOW MUCH MORE THAN THE DAY BEFORE, BUT % INCREASE FROM GRAND TOTAL !!!!!!!! SO 1% INCREASE WOULD BE ~250 cases, 10% = 2500 CASES, 100% = 25000 and the fkn 0% increase means = 0.0000000 new cases so the number of TOTAL cases stays the same as yesterday....
you're trying hard to distort the facts. infection rate graphs usually show the number of cases, period. like here:
wuflu.live...
then you can calculate daily increase percentage-wise from previous day, for 2/4 it's 3921 vs 3237, so 21% increase, for 2/3 3237 vs 2873 so 12% increase, and so on.
but you just can't look at it that way, because even when those numbers show it's accelerating, it's a distorted view. your "grand total" changes every day, so for example if you have 5000 cases in day one, 6000 cases in day two and 7000 cases in day three, you can claim it's 20% increase in day two and 16% increase in day three, so "it's slowing down" - which is complete BS.
I agree that it is exponential, but the exponential rise is on the decline. So that is a good thing. Even through the numbers keep going up, the exponential rate at which they do is going down. At this rate, in a week or so, we will see new cases level off and become linear for a bit, and then a decline.
Not the best news, but better than nothing.
Not necessarily.
Just one little monkey wrench to point out from about 5 or 6 monkeywrenches: you cn be reinfected with nCOV. So lets say people who recovered with varying degrees of damage to heart, lungs, immune system, etc.. become reinfected. I would say that their survival rates will be extremely lower. This is where you get the clusters of deaths. People will mistake this as well.. and apply stats and etc from previous coronaviruses or influenza events and this is completely not applicable.
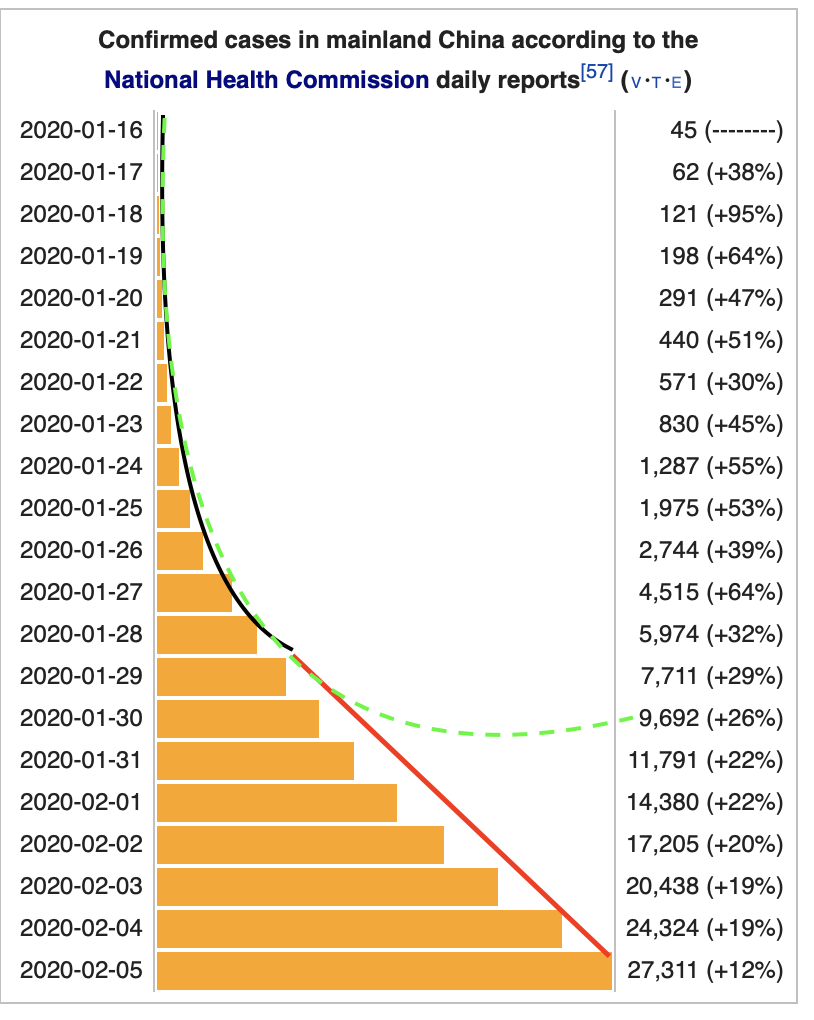
BLACK = EXPONENTIAL GROWTH
RED = LINEAR GROWTH
GREEN -- = WHAT WOULD HAVE BEEN AN EXPONENTIAL GROWTH
This is my last post regarding the subject of the exponential growth. It's barely linear. A linear growth would mean we get at least a higher number than yesterday. The number of new cases today is going to be lower than the number of new cases yesterday.
edit on 5-2-2020 by Necrose
because: (no reason given)
originally posted by: Necrose
BLACK = EXPONENTIAL GROWTH
RED = LINEAR GROWTH
GREEN -- = WHAT WOULD HAVE BEEN AN EXPONENTIAL GROWTH
This is my last post regarding the subject of the exponential growth. It's barely linear. A linear growth would mean we get at least a higher number than yesterday. The number of new cases today is going to be lower than the number of new cases yesterday.
HA HA HA HA HA!!!
You might call yourself Necrose but you'll always be Dunning-Kruger to me.
You can draw a straight line between any 2 points you mathematical imbecile.
originally posted by: Necrose
BLACK = EXPONENTIAL GROWTH
RED = LINEAR GROWTH
GREEN -- = WHAT WOULD HAVE BEEN AN EXPONENTIAL GROWTH
This is my last post regarding the subject of the exponential growth. It's barely linear. A linear growth would mean we get at least a higher number than yesterday. The number of new cases today is going to be lower than the number of new cases yesterday.
Doh. This is using the data on your plot and fitting it with the exponential curve parameters specified in the tool (circled) using MATLAB. Just keep digging. You simply don't even know what exponential growth means outside of some preconceived notion in your head. FYI, that R-value means it is a good fit btw.
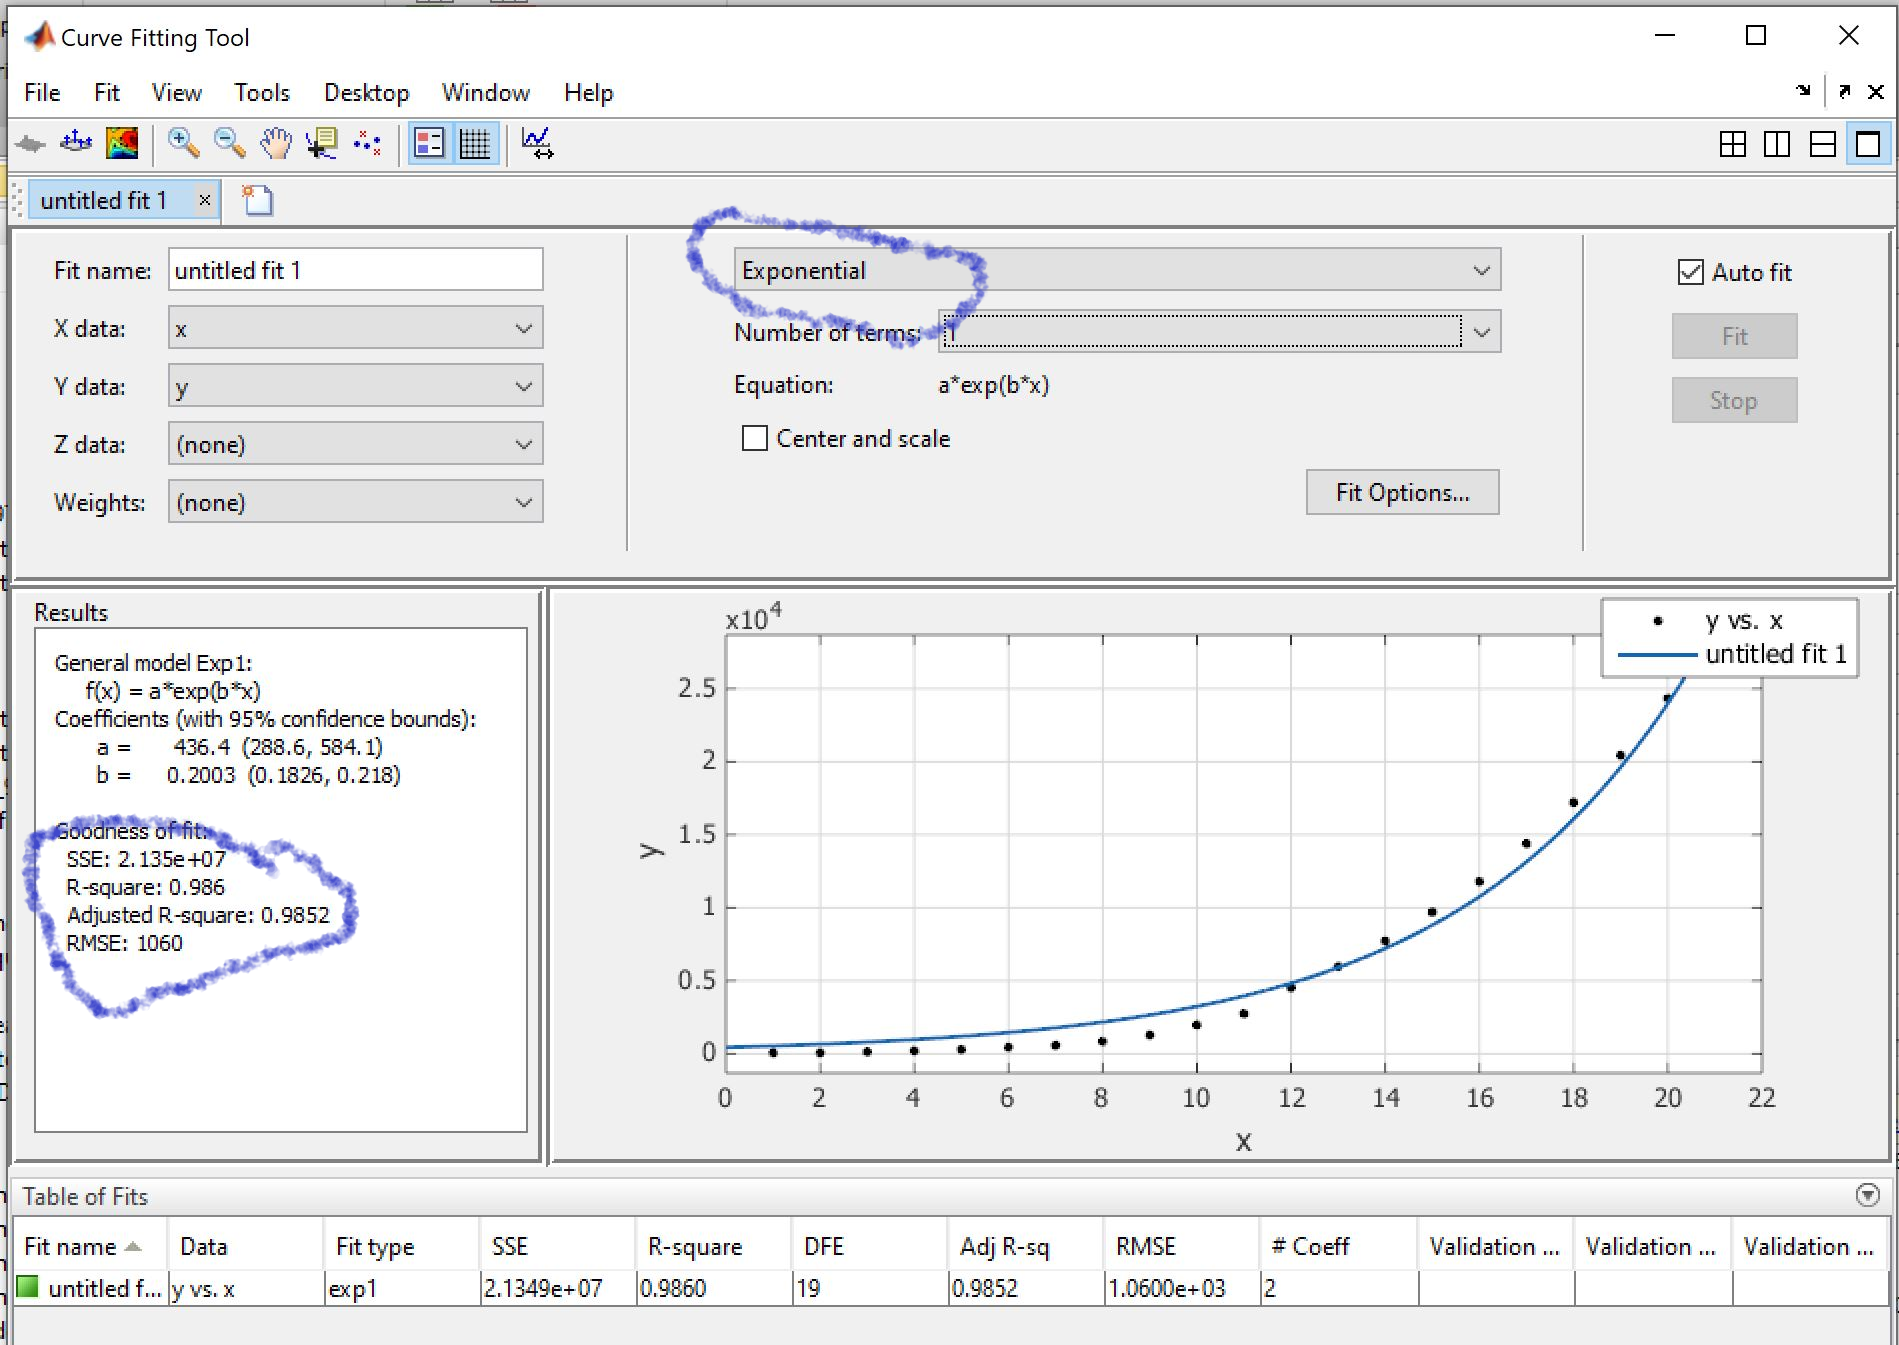
edit on 5-2-2020 by Halfswede because: (no reason given)
First, the good news. Seems this virus, is somewhat under control with the exception of China, and especially the province I can’t remember. Think
USA got another new case. As far as the China numbers. I don’t believe them at all. I feel bad for those people and how they are being treated.
Chances are we may never know the truth, in wuhan. Truth is stranger than fiction. This saying will probably apply in this scenario.
edit on
5-2-2020 by Bicent because: (no reason given)
originally posted by: Advantage
originally posted by: MrRCflying
originally posted by: jedi_hamster
originally posted by: Necrose
originally posted by: jedi_hamster
originally posted by: Necrose
This is what DYING OUT or CONTAINMENT looks like. Today we're gonna get a lower % increase than yesterday, it's 16% now, gonna be around 18% once the China report comes in.
this is what complete BS looks like. i did catch up on this thread already, but in case someone's still catching up and comes across those, i prefer to explain in simple terms, since apparently noone did.
that graph is a manipulation. it's a growth rate. think of it as acceleration. when car's acceleration goes down, does it mean it's slowing down? of course not. it's just moving ahead with constant speed when the acceleration goes down to zero.
originally posted by: Necrose
originally posted by: ARM1968
Err, no it isn’t. Even the skewed official figures show its going up. a reply to: Necrose
I don't know man, I feel stupid explaining elementary school maths, simply put : a daily increase in % is declining, hence it's slowing down.
you should feel that way, since it's entirely wrong.
originally posted by: Necrose
originally posted by: ARM1968
originally posted by: Necrose
originally posted by: ARM1968
Err, no it isn’t. Even the skewed official figures show its going up. a reply to: Necrose
I don't know man, I feel stupid explaining elementary school maths, simply put : a daily increase in % is declining, hence it's slowing down.
You’re an idiot. Sorry to break it to you, as you’re clearly unaware. Enjoy.
Ok let's say hypothetically...
Today's increase is going to be 18% and the rate by which the number of confirmed cases increases is declining 1% per day.
Tomorrow 17%, then 16, 15, 14 and in 2 weeks it hits 0%, so 18 days from now the daily increase is going to be 0% = 0 new cases. What then? It has to top out at some point if it's not speeding up, but slowing down.
Instead of saying I'm an idiot, show me what's wrong with my calculations so both of us can be "aware".
EDIT: again, we're using China's officially reported numbers
0% daily increase of new cases DOES NOT EQUAL 0 new cases. it's a goddamn INCREASE.
once the increase of new cases goes down to zero, the number of new cases daily becomes constant, so the growth becomes linear. so far it isn't, it's exponential, as can be seen on every "infections per day" graph on the web available for this virus.
and that's all using the official numbers of course.
then comes this:
Tencent may have accidentally leaked real data on Wuhan virus deaths
Netizens also noticed that each time the screen with the large numbers appears, it shows a comparison with the previous day's data which demonstrates a "reasonable" incremental increase, much like comparisons of official numbers. This has led some netizens to speculate that Tencent has two sets of data, the real data and "processed" data.
check out recent videos showing smog in Wuhan. in a city with virtually all the traffic stopped. with all factories shut down. then ask yourself, what the hell could they be burning?
i know it was suggested they're burning bodies. i know Tencent leak was mentioned already. still, this thread gets more and more chaotic day after day, so i figured it could use a nudge. ignore all the naysayers, they'll just keep flooding you with distorted facts to "prove" their point.
focus, people.
ARE YOU SH!TTING ME? SO TELL ME HOW MANY NEW CASES WOULD THERE BE TODAY IF THE INCREASE WAS 0 %?
THE % IS NOT HOW MUCH MORE THAN THE DAY BEFORE, BUT % INCREASE FROM GRAND TOTAL !!!!!!!! SO 1% INCREASE WOULD BE ~250 cases, 10% = 2500 CASES, 100% = 25000 and the fkn 0% increase means = 0.0000000 new cases so the number of TOTAL cases stays the same as yesterday....
you're trying hard to distort the facts. infection rate graphs usually show the number of cases, period. like here:
wuflu.live...
then you can calculate daily increase percentage-wise from previous day, for 2/4 it's 3921 vs 3237, so 21% increase, for 2/3 3237 vs 2873 so 12% increase, and so on.
but you just can't look at it that way, because even when those numbers show it's accelerating, it's a distorted view. your "grand total" changes every day, so for example if you have 5000 cases in day one, 6000 cases in day two and 7000 cases in day three, you can claim it's 20% increase in day two and 16% increase in day three, so "it's slowing down" - which is complete BS.
I agree that it is exponential, but the exponential rise is on the decline. So that is a good thing. Even through the numbers keep going up, the exponential rate at which they do is going down. At this rate, in a week or so, we will see new cases level off and become linear for a bit, and then a decline.
Not the best news, but better than nothing.
Not necessarily.
Just one little monkey wrench to point out from about 5 or 6 monkeywrenches: you cn be reinfected with nCOV. So lets say people who recovered with varying degrees of damage to heart, lungs, immune system, etc.. become reinfected. I would say that their survival rates will be extremely lower. This is where you get the clusters of deaths. People will mistake this as well.. and apply stats and etc from previous coronaviruses or influenza events and this is completely not applicable.
So true. Even still, we should take every bit of good news we can. That is assuming that the official numbers can be trusted.
new topics
-
President BIDEN's FBI Raided Donald Trump's Florida Home for OBAMA-NORTH KOREA Documents.
Political Conspiracies: 3 hours ago -
Maestro Benedetto
Literature: 5 hours ago -
Is AI Better Than the Hollywood Elite?
Movies: 5 hours ago -
Las Vegas UFO Spotting Teen Traumatized by Demon Creature in Backyard
Aliens and UFOs: 9 hours ago -
2024 Pigeon Forge Rod Run - On the Strip (Video made for you)
Automotive Discussion: 9 hours ago -
Gaza Terrorists Attack US Humanitarian Pier During Construction
Middle East Issues: 10 hours ago -
The functionality of boldening and italics is clunky and no post char limit warning?
ATS Freshman's Forum: 11 hours ago
top topics
-
President BIDEN's FBI Raided Donald Trump's Florida Home for OBAMA-NORTH KOREA Documents.
Political Conspiracies: 3 hours ago, 25 flags -
Krystalnacht on today's most elite Universities?
Social Issues and Civil Unrest: 15 hours ago, 9 flags -
University of Texas Instantly Shuts Down Anti Israel Protests
Education and Media: 17 hours ago, 8 flags -
Weinstein's conviction overturned
Mainstream News: 13 hours ago, 8 flags -
Supreme Court Oral Arguments 4.25.2024 - Are PRESIDENTS IMMUNE From Later Being Prosecuted.
Above Politics: 15 hours ago, 8 flags -
Massachusetts Drag Queen Leads Young Kids in Free Palestine Chant
Social Issues and Civil Unrest: 12 hours ago, 7 flags -
Gaza Terrorists Attack US Humanitarian Pier During Construction
Middle East Issues: 10 hours ago, 7 flags -
Las Vegas UFO Spotting Teen Traumatized by Demon Creature in Backyard
Aliens and UFOs: 9 hours ago, 6 flags -
Meadows, Giuliani Among 11 Indicted in Arizona in Latest 2020 Election Subversion Case
Mainstream News: 12 hours ago, 5 flags -
2024 Pigeon Forge Rod Run - On the Strip (Video made for you)
Automotive Discussion: 9 hours ago, 4 flags
active topics
-
Truth Social goes public, be careful not to lose your money
Mainstream News • 130 • : Astyanax -
Las Vegas UFO Spotting Teen Traumatized by Demon Creature in Backyard
Aliens and UFOs • 11 • : AwakeNotWoke -
President BIDEN's FBI Raided Donald Trump's Florida Home for OBAMA-NORTH KOREA Documents.
Political Conspiracies • 15 • : AwakeNotWoke -
Is AI Better Than the Hollywood Elite?
Movies • 13 • : Justoneman -
Hate makes for strange bedfellows
US Political Madness • 47 • : 19Bones79 -
-@TH3WH17ERABB17- -Q- ---TIME TO SHOW THE WORLD--- -Part- --44--
Dissecting Disinformation • 689 • : daskakik -
University of Texas Instantly Shuts Down Anti Israel Protests
Education and Media • 265 • : Astrocometus -
Gaza Terrorists Attack US Humanitarian Pier During Construction
Middle East Issues • 27 • : ToneD -
Reason of the Existence
The Gray Area • 21 • : BingoMcGoof -
Supreme Court Oral Arguments 4.25.2024 - Are PRESIDENTS IMMUNE From Later Being Prosecuted.
Above Politics • 85 • : Sookiechacha