It looks like you're using an Ad Blocker.
Please white-list or disable AboveTopSecret.com in your ad-blocking tool.
Thank you.
Some features of ATS will be disabled while you continue to use an ad-blocker.

Corona Virus Updates Part 2
page: 62share:
Look guys, we're going to find out how serious this is one way or another at some point in time.
All this back and forth arguing about percentages won't matter if it starts affecting our lives in some form or another. Unfortunately, the only "proof" were going to get is total chaos or business as usual. Time will tell all.
All this back and forth arguing about percentages won't matter if it starts affecting our lives in some form or another. Unfortunately, the only "proof" were going to get is total chaos or business as usual. Time will tell all.
originally posted by: 1Angrylightbulb
a reply to: Necrose
I didn't say it increased since yesterday, and I said its been increasing with fluctuations.
Here is a week from Jan 28th to Feb 3rd according to bnonews.
Feb 3rd: 2,345 new cases and 64 new deaths in Hubei province, China
Feb 2nd: 2,103 new cases and 56 new deaths in Hubei province, China
Feb 1st: 1,921 new cases and 45 new deaths in Hubei province, China
Jan 31st: 1,347 new cases and 45 new deaths in Hubei province, China
Jan 30th: 903 new cases and 42 new deaths in Hubei province, China
Jan 29th: 1,032 new cases and 37 new deaths in Hubei province, China
Jan 28th: 840 new cases and 25 new deaths in Hubei province, China
Now maybe I am simple but to me it looks like it decreased in numbers provide from Jan 29th to Jan 30th but then shot up again on Jan 31st. I would call that increasing overall with fluctuations.
If it doesn't shoot up tomorrow (let's say they report 2700), will you agree with me?
Keeping in mind here that you'd be a fool to go by the officially released numbers for a multitude of reasons (one of the main being that they can
only test so many people per a day), does this chart look like evidence that it's definitely slowing down?
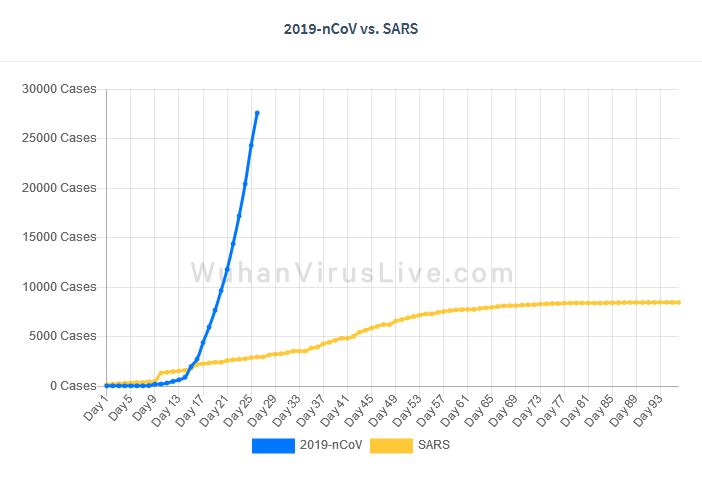
1 single day where the amount of new confirmed cases is slightly lower than the previous day is not even close to enough evidence to say it's decreasing... you'd need multiple days showing the same trend. It's called fluctuations... and that can be to do with any number of reasons. On that particular day for whatever reason they could only test XXX many people, and in all likelihood has nothing to do with the actual amount of people infected. Speculating that it's slowing down at this point, especially considering we're reliant on the CCP's official numbers which even they admitted they can only test so many per a day, is idiotic.
1 single day where the amount of new confirmed cases is slightly lower than the previous day is not even close to enough evidence to say it's decreasing... you'd need multiple days showing the same trend. It's called fluctuations... and that can be to do with any number of reasons. On that particular day for whatever reason they could only test XXX many people, and in all likelihood has nothing to do with the actual amount of people infected. Speculating that it's slowing down at this point, especially considering we're reliant on the CCP's official numbers which even they admitted they can only test so many per a day, is idiotic.
edit on 5/2/20 by Navieko because: (no reason given)
originally posted by: Halfswede
originally posted by: Necrose
BLACK = EXPONENTIAL GROWTH
RED = LINEAR GROWTH
GREEN -- = WHAT WOULD HAVE BEEN AN EXPONENTIAL GROWTH
This is my last post regarding the subject of the exponential growth. It's barely linear. A linear growth would mean we get at least a higher number than yesterday. The number of new cases today is going to be lower than the number of new cases yesterday.
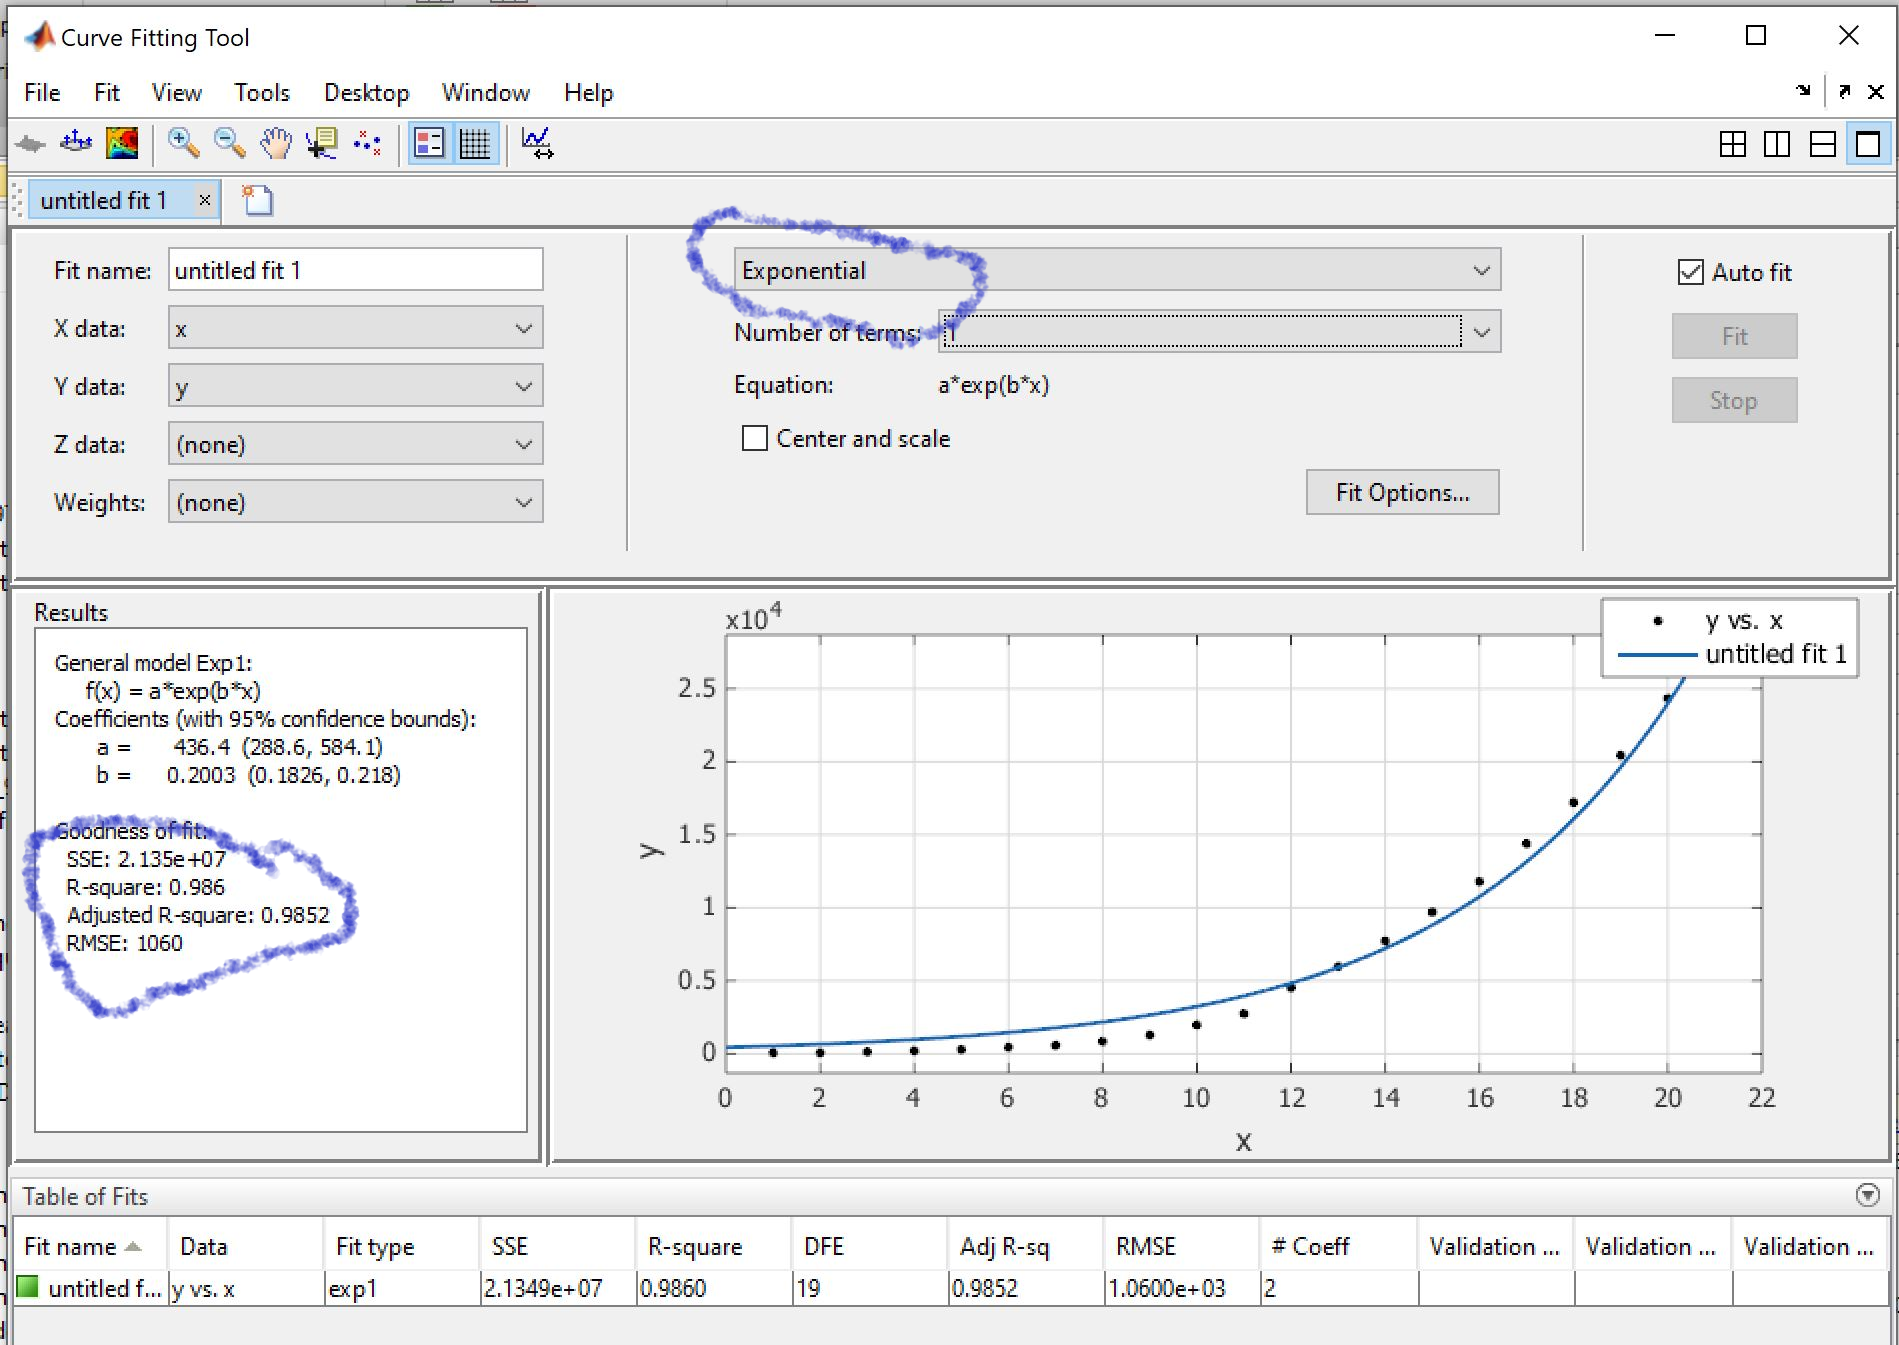
Doh. This is using the data on your plot and fitting it with the exponential curve parameters specified in the tool (circled) using MATLAB. Just keep digging. You simply don't even know what exponential growth means outside of some preconceived notion in your head.
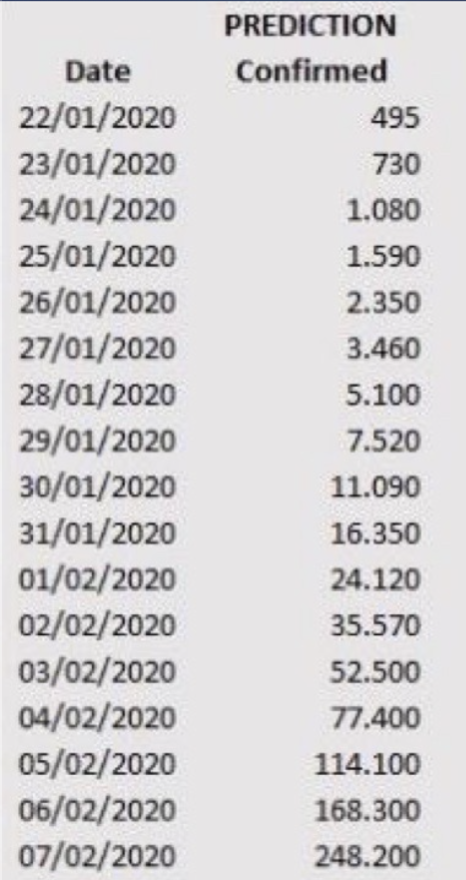
Is there a way to use Matlab to extrapolate the future using the current numbers and days/dates? It would be interesting to see if it comes up with a bell curve, and an approximate date/day when it will reach the peak.
originally posted by: Pommer89
a reply to: muzzleflash
I'm not here for this at all, it seemed like a good place to see all coronavirus related stuff in one place, there were multiple links per page, much easier than twitter or google, then it turned into yourself writing ridiculously long posts saying same thing over and over. I'll make my own log of this without contributing on here anymore, my time here has been short lived 5 days I think
I wouldn't take it so personal. ATS is at least fairly well moderated so it's much better than other forums. But back and forth bickering is not exclusive to ATS, not by any means.
a reply to: muzzleflash
star for you, just because I do understand where you are coming from and if my reply to you yesterday made you feel that bad then I can tell you that this wasn't the intention behind what I said and I sincerely apologize for it ...
star for you, just because I do understand where you are coming from and if my reply to you yesterday made you feel that bad then I can tell you that this wasn't the intention behind what I said and I sincerely apologize for it ...
originally posted by: MrRCflying
originally posted by: Halfswede
originally posted by: Necrose
BLACK = EXPONENTIAL GROWTH
RED = LINEAR GROWTH
GREEN -- = WHAT WOULD HAVE BEEN AN EXPONENTIAL GROWTH
This is my last post regarding the subject of the exponential growth. It's barely linear. A linear growth would mean we get at least a higher number than yesterday. The number of new cases today is going to be lower than the number of new cases yesterday.
Doh. This is using the data on your plot and fitting it with the exponential curve parameters specified in the tool (circled) using MATLAB. Just keep digging. You simply don't even know what exponential growth means outside of some preconceived notion in your head.
Is there a way to use Matlab to extrapolate the future using the current numbers and days/dates? It would be interesting to see if it comes up with a bell curve, and an approximate date/day when it will reach the peak.
There's no way to predict a peak since no one will know how long there will be more infected people.
All you can do to try and predict the future is calculate an average growth rate and calculate the doubling time:
Doubling time (in days) = 70/average % increase per day.
Then if the rate of infection stays the same the number of cases will double each X days.
But there's no way to know when that will slow down.
(Before Necrose tries nit picking it - the "70" is roughly the natural logrithm of 2 mulitplied by 100 - that's how you work out the doubling time. It's actually 69.odd but people use 70 because it's close enough).
edit on -06:0020203America/ChicagoWed, 05 Feb 2020 17:19:41
-0600_thAmerica/Chicago0219 by Power_Semi because: (no reason given)
originally posted by: Necrose
originally posted by: 1Angrylightbulb
a reply to: Necrose
I didn't say it increased since yesterday, and I said its been increasing with fluctuations.
Here is a week from Jan 28th to Feb 3rd according to bnonews.
Feb 3rd: 2,345 new cases and 64 new deaths in Hubei province, China
Feb 2nd: 2,103 new cases and 56 new deaths in Hubei province, China
Feb 1st: 1,921 new cases and 45 new deaths in Hubei province, China
Jan 31st: 1,347 new cases and 45 new deaths in Hubei province, China
Jan 30th: 903 new cases and 42 new deaths in Hubei province, China
Jan 29th: 1,032 new cases and 37 new deaths in Hubei province, China
Jan 28th: 840 new cases and 25 new deaths in Hubei province, China
Now maybe I am simple but to me it looks like it decreased in numbers provide from Jan 29th to Jan 30th but then shot up again on Jan 31st. I would call that increasing overall with fluctuations.
If it doesn't shoot up tomorrow (let's say they report 2700), will you agree with me?
I would have to see a few days of lower numbers coming out Hubei to say I think it is slowing down in that province.
originally posted by: Necrose
originally posted by: AcerM
a reply to: Necrose
It's even turning back in time
I knew somebody would nit-pick my 30-second screenshot edit
if you would only spend those 30 seconds to rethink what you're saying.
look at the graph posted by Navieko above.
then ignore the percentages you're seeing in official data, those are NOT comparable day-by-day, since the total changes every day, so as i've pointed out, even if the growth would be linear, with the same amount of new cases every day (lets say 1000), percentage-wise it would be "slowing down", since total is rising, so 1000 is in time becoming lower and lower percentage of the total. does it mean it's slowing down in such case? of course not, it's growing steadily.
they include percentage data in those tables to manipulate people. there are lies, damn lies and statistics.
also, one or two days of lower increase doesn't mean it's slowing down - when you look at the data, such bumps did happen already. just fluctuations, at least for now.
new topics
-
Electrical tricks for saving money
Education and Media: 1 hours ago -
VP's Secret Service agent brawls with other agents at Andrews
Mainstream News: 2 hours ago -
Sunak spinning the sickness figures
Other Current Events: 3 hours ago -
Nearly 70% Of Americans Want Talks To End War In Ukraine
Political Issues: 3 hours ago -
Late Night with the Devil - a really good unusual modern horror film.
Movies: 5 hours ago -
Cats Used as Live Bait to Train Ferocious Pitbulls in Illegal NYC Dogfighting
Social Issues and Civil Unrest: 6 hours ago -
The Good News According to Jesus - Episode 1
Religion, Faith, And Theology: 8 hours ago -
HORRIBLE !! Russian Soldier Drinking Own Urine To Survive In Battle
World War Three: 10 hours ago
top topics
-
SETI chief says US has no evidence for alien technology. 'And we never have'
Aliens and UFOs: 17 hours ago, 8 flags -
Cats Used as Live Bait to Train Ferocious Pitbulls in Illegal NYC Dogfighting
Social Issues and Civil Unrest: 6 hours ago, 8 flags -
Florida man's trip overseas ends in shock over $143,000 T-Mobile phone bill
Social Issues and Civil Unrest: 13 hours ago, 8 flags -
VP's Secret Service agent brawls with other agents at Andrews
Mainstream News: 2 hours ago, 7 flags -
Former Labour minister Frank Field dies aged 81
People: 15 hours ago, 4 flags -
Bobiverse
Fantasy & Science Fiction: 13 hours ago, 3 flags -
HORRIBLE !! Russian Soldier Drinking Own Urine To Survive In Battle
World War Three: 10 hours ago, 3 flags -
Nearly 70% Of Americans Want Talks To End War In Ukraine
Political Issues: 3 hours ago, 3 flags -
Sunak spinning the sickness figures
Other Current Events: 3 hours ago, 3 flags -
Late Night with the Devil - a really good unusual modern horror film.
Movies: 5 hours ago, 2 flags
active topics
-
VP's Secret Service agent brawls with other agents at Andrews
Mainstream News • 19 • : NoCorruptionAllowed -
VirginOfGrand says hello
Introductions • 5 • : burritocat -
The Reality of the Laser
Military Projects • 44 • : Zaphod58 -
SETI chief says US has no evidence for alien technology. 'And we never have'
Aliens and UFOs • 42 • : Boomer1947 -
NASA Researchers Discover a Parallel Universe That Runs Backwards through Time - Alongside Us
Space Exploration • 71 • : charlyv -
Sunak spinning the sickness figures
Other Current Events • 4 • : annonentity -
Cats Used as Live Bait to Train Ferocious Pitbulls in Illegal NYC Dogfighting
Social Issues and Civil Unrest • 12 • : Hakaiju -
HORRIBLE !! Russian Soldier Drinking Own Urine To Survive In Battle
World War Three • 28 • : budzprime69 -
Huge ancient city found in the Amazon.
Ancient & Lost Civilizations • 61 • : Therealbeverage -
Should Biden Replace Harris With AOC On the 2024 Democrat Ticket?
2024 Elections • 49 • : Therealbeverage