It looks like you're using an Ad Blocker.
Please white-list or disable AboveTopSecret.com in your ad-blocking tool.
Thank you.
Some features of ATS will be disabled while you continue to use an ad-blocker.

Quake Watch 2015
page: 26share:
originally posted by: lurksoften
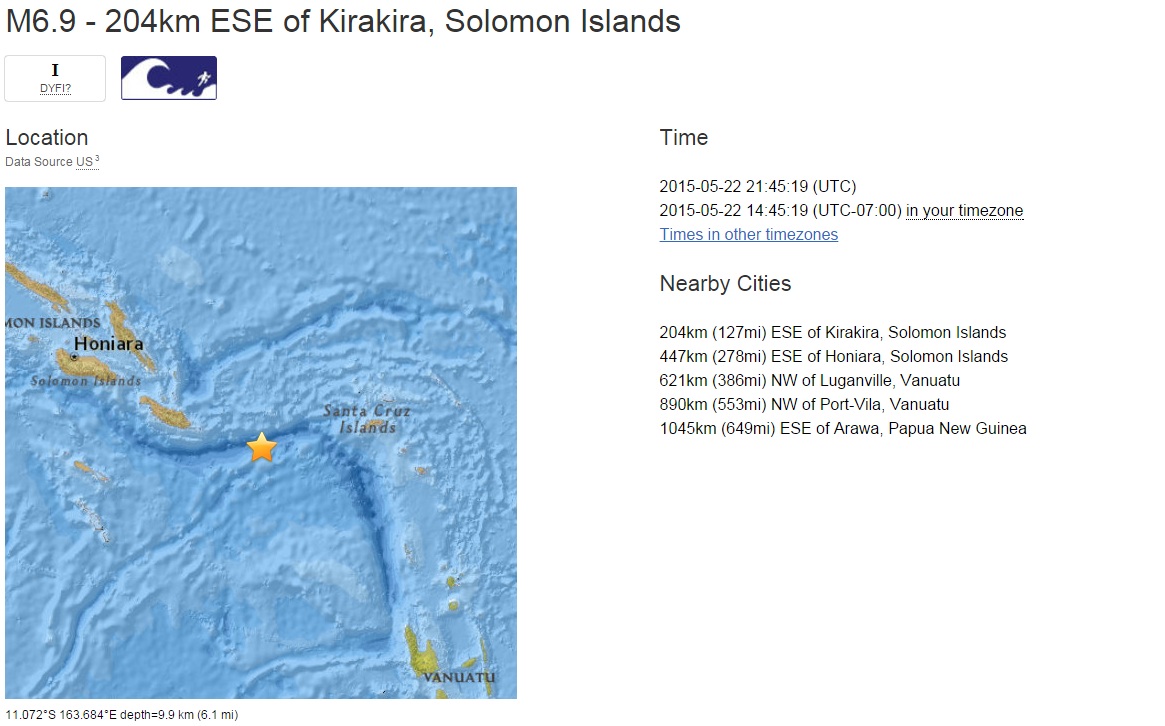
M6.8 - 205km ESE of Kirakira, Solomon Islands
11.086°S 163.685°E depth=8.0 km (5.0 mi)
Time
2015-05-22 21:45:22 (UTC)
2015-05-22 16:45:22 (UTC-05:00) in your timezone
Times in other timezones
Nearby Cities
213km (132mi) W of Lata, Solomon Islands
466km (290mi) ESE of Honiara, Solomon Islands
613km (381mi) NW of Luganville, Vanuatu
884km (549mi) NNW of Port-Vila, Vanuatu
1061km (659mi) ESE of Arawa, Papua New Guinea
USGS
6.7 EMSC
Nevada EQ was also downgraded further to 4.8
Now up to a 6.9
6.9
204km ESE of Kirakira, Solomon Islands
2015-05-22 14:45:19 UTC-07:009.9 km
earthquake.usgs.gov...
edit on 7/30/2012 by dreamfox1 because: (no reason
given)
files.abovetopsecret.com...
edit on 7/30/2012 by dreamfox1 because: (no reason given)
Again !!!!
earthquake.usgs.gov...
M6.8 - 177km ESE of Kirakira, Solomon Islands
Time
2015-05-22 23:59:35 (UTC)
2015-05-22 16:59:35 (UTC-07:00) in your timezone
Times in other timezones
Nearby Cities
177km (110mi) ESE of Kirakira, Solomon Islands
420km (261mi) ESE of Honiara, Solomon Islands
638km (396mi) NW of Luganville, Vanuatu
905km (562mi) NW of Port-Vila, Vanuatu
1020km (634mi) ESE of Arawa, Papua New Guinea
edit on 7/30/2012 by dreamfox1 because: (no reason given)
originally posted by: dreamfox1
Again !!!!
earthquake.usgs.gov...
M6.8 - 177km ESE of Kirakira, Solomon Islands
Time
2015-05-22 23:59:35 (UTC)
2015-05-22 16:59:35 (UTC-07:00) in your timezone
Times in other timezones
Nearby Cities
177km (110mi) ESE of Kirakira, Solomon Islands
420km (261mi) ESE of Honiara, Solomon Islands
638km (396mi) NW of Luganville, Vanuatu
905km (562mi) NW of Port-Vila, Vanuatu
1020km (634mi) ESE of Arawa, Papua New Guinea
Very eerie. I wonder what's up. Maybe we'll find out soon.
further to post by: muzzy
in response to a query by: lurksoften
I was only looking at M9's, when you go down to M8.5+ (I didn't read the text properly the first time) there may actually be something to this.
I have data back 1700 years to 314AD, at least M8+ anyways.
M8.5+'s are hard to miss, people remember them, and talk about it to the next generation, if there were any prior to 314AD then they should show up on some of the Jap or Chinese historical records. It will take some time to research those, I do have some Middle East, Chinese and Japanese papers that I intend to go through. That Google Maps Classic termination in Feb 2015 threw a spanner in the M7+Project. I have to start from scratch, Bing Maps might do, will see how it goes, can Bing handle 1700+ maps?
Anyway there may be some credit to the theorists theory over the longer term too.
I did a graph and threw in some bands ( these are called "error bars") and it does seem to be a sort of clustering, basically from 1700 on I see 7 clusters of M8.5+ quakes.
It becomes more obvious on the 2nd graph.
obviously this is not the full size image, it is 1367pixels wide, so you need to rightclickviewimage or open rightclickopenimageinnewtab to see it at its best.
1700 to 1716 = 16 year period of activity
1716 to 1746 = 30 year gap
1746 to 1755 = 9 year period of activity
1755 to 1822 = 67 year gap
1822 to 1868 = 46 year period of activity
1868 to 1899 = 31 year gap
1899 to 1906 = 7 year period of activity
1906 to 1917 = 11 year gap
1917 to 1923 = 6 year period of activity
1923 to 1950 = 27 year gap
1950 to 1964 = 14 year period of activity
1964 to 2004 = 40 year gap
2004 to 2012 = 8 year period of activity
It's not evenly spaced, so not much use for forecasting.
The "gap" may be the key, as 3 of the gaps are around the 30 year mark
Interesting though.
edit on 05u14114115 by muzzy because: (no reason given)
Hi Muzzy, I was reading an article that popped up on Facebook and was wondering what your opinion is. I was hoping for some info from Westcoast, but
all quiet over on that thread. ....
dutchsinse.com..." target="_blank" class="postlink">5/22/2015 — Whole
West coast moved over 48 hours a reply to: muzzy
The thought of dormant volcanos coming back to life is a worry and the article suggests that there is much pressure release going on presently. Also a friend is concerned about some planetary alignments coming up over the next week and some predictions about increased movement.
Thanks in advance for your reply.
a reply to: zenius
link doesn't work. But I copied and pasted the bold part.
I cut bloggers like this some slack, when I first researched earthquakes in 2006 I freaked out too, I had no idea there were so many of them!
At first I kept an eye on M3+ quakes and that was enough to get excited about but when I found the smaller quakes below that it was a bit overwhelming.
The World isn't suddenly experiencing a massive uptick in earthquakes, it is just that the blogger just noticed them.
From what I have learned since 2006, its not the number of quakes to be worried about, or even the amount of energy being released by each one
it is when the quake numbers are unusually low that is the time to be worried.
If earthquakes stop altogether, we are done for!
earthquakes drive volcanoes, volcanoes created life
and volcanoes may end life too!
there is no timeline
Nothing spectacular about this one, I just needed to test that ikimaps to Bing Maps was still working.
One thing that caught my eye in the data was the number of ~M1 aftershocks JMA found, the Ryukyu islands are a fair way from the 4 main islands of Japan and seldom show up in the Preliminary data from NIED, it takes 2-3 days for the JMA technicians to plot that area. They must have some really sensitive equipment in Japan.
Lat/Long: 28.562, 129.62
UTC: 22/05/2015 13:28:46
JST: 22/05/2015 22:28:46
Depth: 20.6
Mag: 5.1 ML
Location: NEAR AMAMI-OSHIMA ISLAND (Kagoshima Prefecture, Ryukyu islands, Japan)
Energy Released: 673.609687 tonnes of TNT
Source: JMA Status: reviewed
aftershocks
mag~1= 18
mag1= 27
mag2= 3
mag3= 1
iki-Bingmap
a reply to: pheonix358
sorry about your back, been there/done that, for nearly 12 years. Last year was a bad one for my back, I put it out twice, was off work for 6 weeks overall.
Have recovered from last year thanks to physiotherapy exercises.
Depends on your exact problem, but try doing the brace for impact or crash position 5 times, i.e. sit in a chair and lean forward slowly and touch your hands to the floor between your legs, then slowly sit up straight again, repeat 5 times.
Do this every time your back hurts and I guarantee the pain will ease. After a few days do it 10 times at least twice a day to strengthen your back muscles.
I tried chiropractors for years, but it never had the immediate result that the physiotherapy had.
Once your back is injured it will never be 100% again, its just a matter of being careful and doing the exercises.
I wish I had a bit more time to chime in on the Solomon Islands. I'll just note that to me this is a definitely a "double tap" earthquake.
Whateverthatmeans. Also, (this is rattling around in my head) what's up Nevada. Still.
Things are getting odd
earthquake.usgs.gov...
M6.3 - southern Mid-Atlantic Ridge
Time
2015-05-24 04:53:22 (UTC)
2015-05-23 21:53:22 (UTC-07:00) in your timezone
Nearby Cities
910km (565mi) W of Jamestown, Saint Helena
2436km (1514mi) ESE of Sao Jose da Coroa Grande, Brazil
2437km (1514mi) ESE of Tamandare, Brazil
2438km (1515mi) ESE of Maragogi, Brazil
2585km (1606mi) S of Monrovia, Liberia
Time
2015-05-24 04:53:22 (UTC)
2015-05-23 21:53:22 (UTC-07:00) in your timezone
edit on 7/30/2012 by dreamfox1 because: (no reason given)
lets put things in perspective eh.
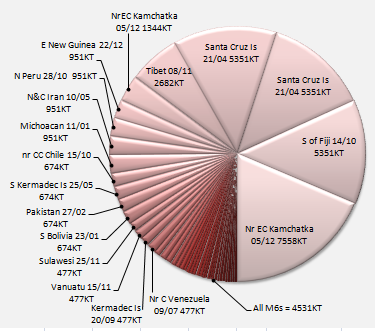
As Puterman (missing his input) and I have been saying for years, its not the number of quakes its the energy released that counts.
If we take the M7+Project and re-invent it as the M6.5+Project, and particular look at 2015, this is how the energy has been released so far.
The numbers for the energy released by each quake are KT for Kilotons of TNT, that is, the usual TTNT divided by 1000.
Note that all the 15 quakes M6.5- 6.99 added together only equal 2753KT or about one M7.51 event
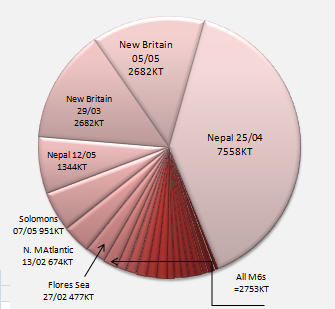
I am thinking of using these pie graphs as the thumbnail for the 6.5+Project instead of the map screenshots, as the maps don't fit inside the thumbnail box space
significantearthquakes.blogspot.co.nz...
a lot of work to do.
As Puterman (missing his input) and I have been saying for years, its not the number of quakes its the energy released that counts.
If we take the M7+Project and re-invent it as the M6.5+Project, and particular look at 2015, this is how the energy has been released so far.
The numbers for the energy released by each quake are KT for Kilotons of TNT, that is, the usual TTNT divided by 1000.
Note that all the 15 quakes M6.5- 6.99 added together only equal 2753KT or about one M7.51 event
I am thinking of using these pie graphs as the thumbnail for the 6.5+Project instead of the map screenshots, as the maps don't fit inside the thumbnail box space
significantearthquakes.blogspot.co.nz...
a lot of work to do.
a reply to: muzzy
I think that is where alot of us get stuck. We see alot of quakes and we freak. I have been trying to re - train my brain to think of earthquakes in energy instead.
I still freak, but I am more apt to go and seek the energy info before I pee in my pants. LOL!!!
I like the pie graph. I appreciate all your work.
a reply to: crappiekat
thanks.
That graph doesn't mean to diminish the damage and loss of life a smaller quake can do (sic Christchurch M6.2), or even the accumulation of all the M6's that is still a lot of energy released. 2015 is only half way, so I'm sure the graph will change by the end of the year.
I did 1997 to see what they may look like, its a bit messier
before I go too far with these I wonder if I should put the magnitude in there, as well as/instead of the KT number, or maybe make a "key" to put on each page??
edit on 0500000014314315 by muzzy because: (no reason given)
originally posted by: Nyiah
a reply to: dreamfox1
That's not odd, both N & S stretches of the ridge pump out ones that size, and bigger.
What exactly makes it odd??
This size does not happen that regularly
Biggest Earthquakes Near Northern Mid Atlantic Ridge
Map data ©2015 Google, INEGI Imagery ©2015 NASA, TerraMetrics
Terms of Use
Map
Satellite
24 years ago 6.4 magnitude, 9 km depth
Northern Mid Atlantic Ridge
21 years ago 6.3 magnitude, 29 km depth
Northern Mid Atlantic Ridge
8 years ago 6.3 magnitude, 14 km depth
Ponta Delgada, Azores, Portugal
12 years ago 6.3 magnitude, 10 km depth
Northern Mid Atlantic Ridge
38 years ago 6.3 magnitude, 33 km depth
Northern Mid Atlantic Ridge
5 years ago 6.3 magnitude, 10 km depth
Northern Mid Atlantic Ridge
earthquaketrack.com...
a reply to: muzzy
NEAR AMAMI-OSHIMA ISLAND 5.1 aftershocks
50 more
new iki-Bing Map
One thing that is missing from the iki-Bing process it being able to set the zoom height, it always goes to the bounds set by the icons, even thoguh I set the height on the KMZ file
NEAR AMAMI-OSHIMA ISLAND 5.1 aftershocks
50 more
new iki-Bing Map
One thing that is missing from the iki-Bing process it being able to set the zoom height, it always goes to the bounds set by the icons, even thoguh I set the height on the KMZ file
new topics
-
What is the white pill?
Philosophy and Metaphysics: 18 minutes ago -
Mike Pinder The Moody Blues R.I.P.
Music: 1 hours ago -
Putin, Russia and the Great Architects of the Universe
ATS Skunk Works: 4 hours ago -
A Warning to America: 25 Ways the US is Being Destroyed
New World Order: 8 hours ago
top topics
-
President BIDEN's FBI Raided Donald Trump's Florida Home for OBAMA-NORTH KOREA Documents.
Political Conspiracies: 14 hours ago, 31 flags -
A Warning to America: 25 Ways the US is Being Destroyed
New World Order: 8 hours ago, 14 flags -
Is AI Better Than the Hollywood Elite?
Movies: 16 hours ago, 4 flags -
Mike Pinder The Moody Blues R.I.P.
Music: 1 hours ago, 2 flags -
Maestro Benedetto
Literature: 15 hours ago, 1 flags -
Putin, Russia and the Great Architects of the Universe
ATS Skunk Works: 4 hours ago, 1 flags -
What is the white pill?
Philosophy and Metaphysics: 18 minutes ago, 1 flags
active topics
-
A Warning to America: 25 Ways the US is Being Destroyed
New World Order • 20 • : jidnum2 -
President BIDEN's FBI Raided Donald Trump's Florida Home for OBAMA-NORTH KOREA Documents.
Political Conspiracies • 23 • : xuenchen -
Gaza Terrorists Attack US Humanitarian Pier During Construction
Middle East Issues • 62 • : CarlLaFong -
Meadows, Giuliani Among 11 Indicted in Arizona in Latest 2020 Election Subversion Case
Mainstream News • 17 • : network dude -
New whistleblower Jason Sands speaks on Twitter Spaces last night.
Aliens and UFOs • 69 • : Ophiuchus1 -
Putin, Russia and the Great Architects of the Universe
ATS Skunk Works • 16 • : CristianVictoria -
Alternate Electors vs Fake Electors - What is the Difference.
2024 Elections • 123 • : frogs453 -
Massachusetts Drag Queen Leads Young Kids in Free Palestine Chant
Social Issues and Civil Unrest • 17 • : ToneD -
Hate makes for strange bedfellows
US Political Madness • 51 • : network dude -
The Acronym Game .. Pt.3
General Chit Chat • 7755 • : F2d5thCavv2