It looks like you're using an Ad Blocker.
Please white-list or disable AboveTopSecret.com in your ad-blocking tool.
Thank you.
Some features of ATS will be disabled while you continue to use an ad-blocker.
share:
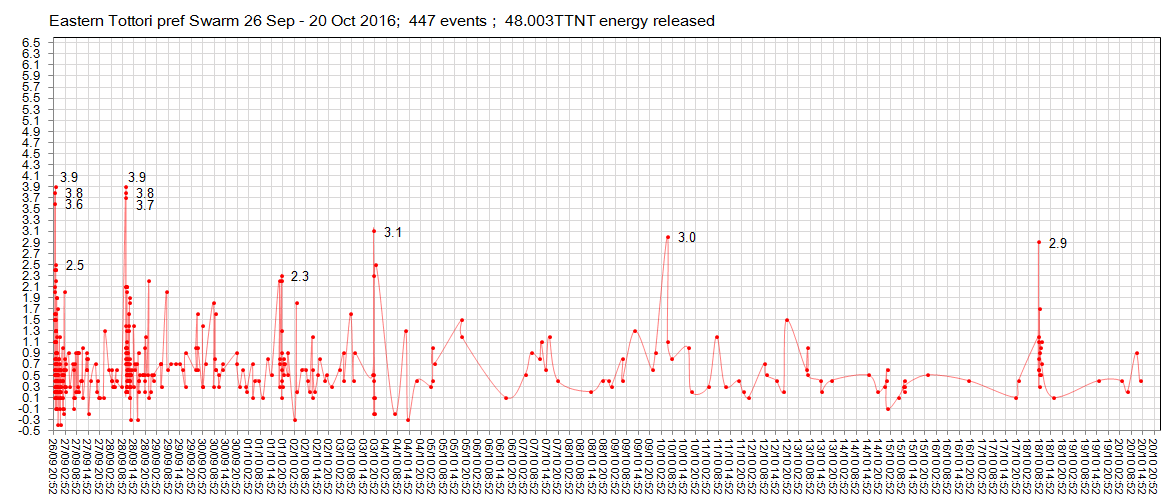
Here is the revised Tottori graph to fill in the gap between 29th Sept and 21st Oct.
A couple of surges, but still all small stuff.
Nothing to indicate a 6.6 was on the cards.
That 2.9 on the 18th Oct did chuck out quite a lot of aftershocks (12) for a 2.9
thats all I can see
The reason I made a page about Tottori in the first place was because of how the two 3.9's were almost duplicates 37 hours apart.
It went 3.6, 3.8. 3.9 then a bunch of smaller ones for 36 3/4 hours, then 3.8, 3.7, 3.9 and another bunch of smaller ones again.
rightclickviewimageforfullsize
I downloaded the NIED preliminary data ...... 755 events for the area known as Western Honshu, narrowed that down to Eastern Tottori Pref. leaves mag~1= 33
mag1= 369
mag2= 249
mag3= 66
mag4= 10
mag5= 0
mag6= 1
total= 728
What I thoguht was a 5 seems to be just a 4.8
although they upped the mainshock to 6.1 (from 6.0 last night)
This is still Prelimiary though.
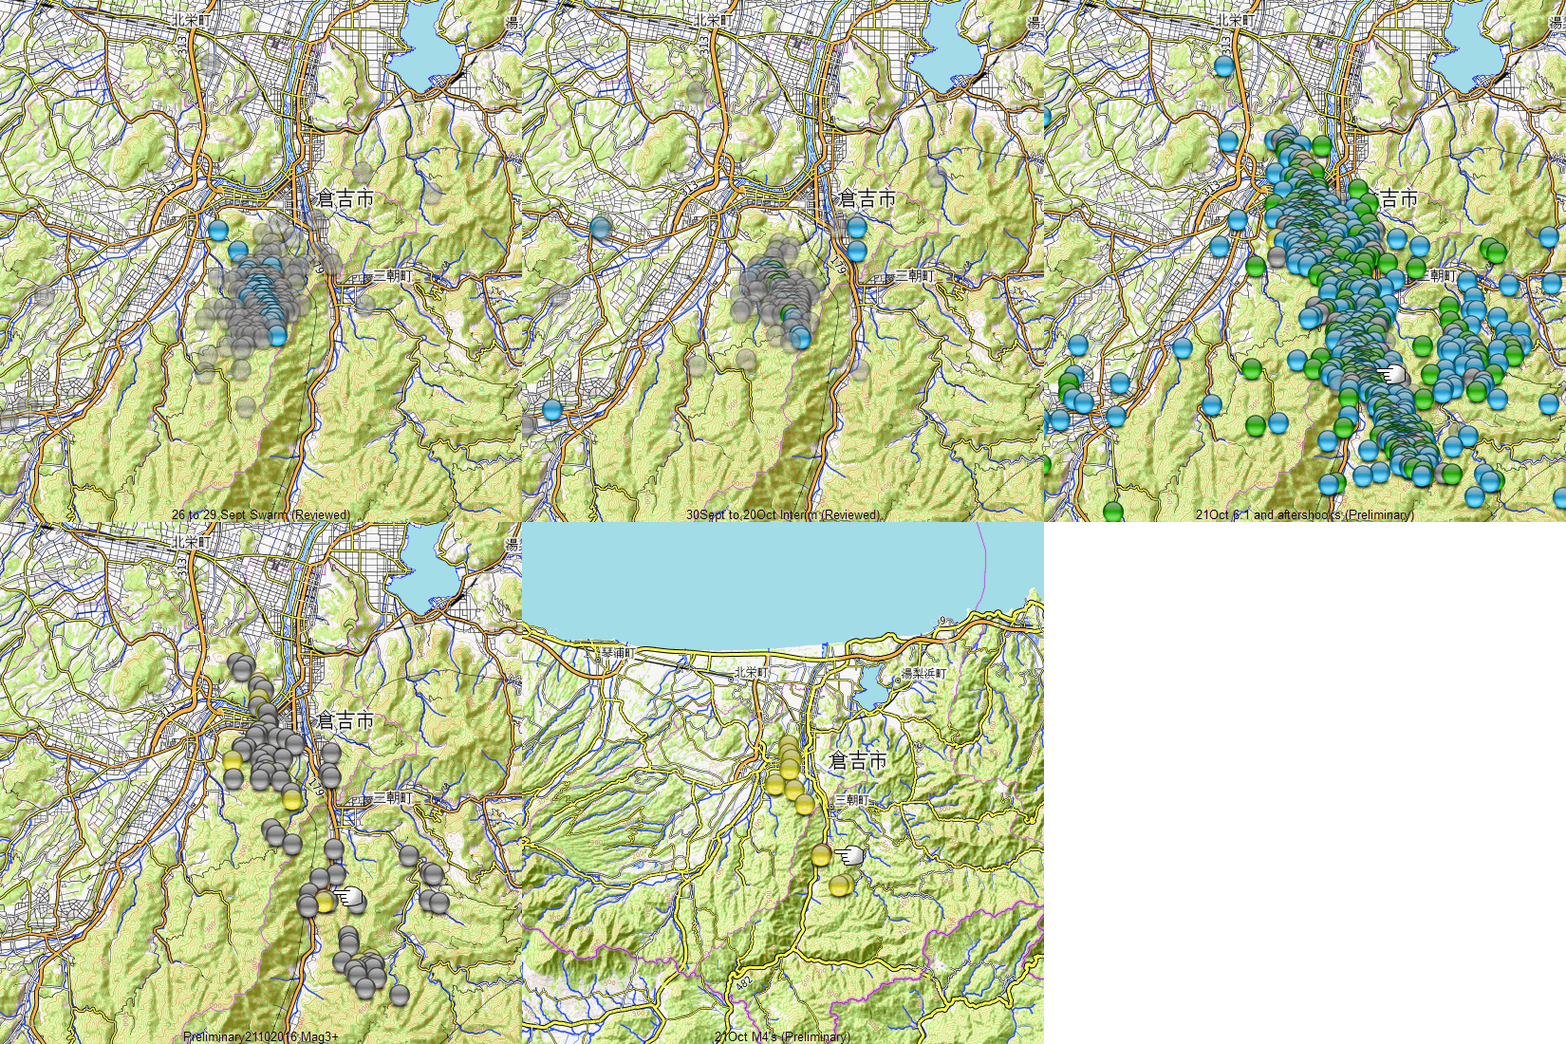
I made some static images of the series, from 29 Sept to today.
Out popped the first one, the Swarm of 26-29 Sept, all good, quite tightly spread, lots of ~M1's in it
Did the second one, same area really, more M2's in the period 30 Sept-20 Oct, although less of them overall
Then the Preliminary data of the Aftershocks of the 6.6
When the map opened I almost fell back in my chair, the area was huge, like 10 times the size!
I had to set the zoom further out to catch the majority and run the other ones through again
to make this GIF
A couple of surges, but still all small stuff.
Nothing to indicate a 6.6 was on the cards.
That 2.9 on the 18th Oct did chuck out quite a lot of aftershocks (12) for a 2.9
thats all I can see
The reason I made a page about Tottori in the first place was because of how the two 3.9's were almost duplicates 37 hours apart.
It went 3.6, 3.8. 3.9 then a bunch of smaller ones for 36 3/4 hours, then 3.8, 3.7, 3.9 and another bunch of smaller ones again.
rightclickviewimageforfullsize

I downloaded the NIED preliminary data ...... 755 events for the area known as Western Honshu, narrowed that down to Eastern Tottori Pref. leaves mag~1= 33
mag1= 369
mag2= 249
mag3= 66
mag4= 10
mag5= 0
mag6= 1
total= 728
What I thoguht was a 5 seems to be just a 4.8
although they upped the mainshock to 6.1 (from 6.0 last night)
This is still Prelimiary though.
I made some static images of the series, from 29 Sept to today.
Out popped the first one, the Swarm of 26-29 Sept, all good, quite tightly spread, lots of ~M1's in it
Did the second one, same area really, more M2's in the period 30 Sept-20 Oct, although less of them overall
Then the Preliminary data of the Aftershocks of the 6.6
When the map opened I almost fell back in my chair, the area was huge, like 10 times the size!
I had to set the zoom further out to catch the majority and run the other ones through again
to make this GIF

edit on 1000000029429416 by muzzy because: (no reason given)
originally posted by: muzzy
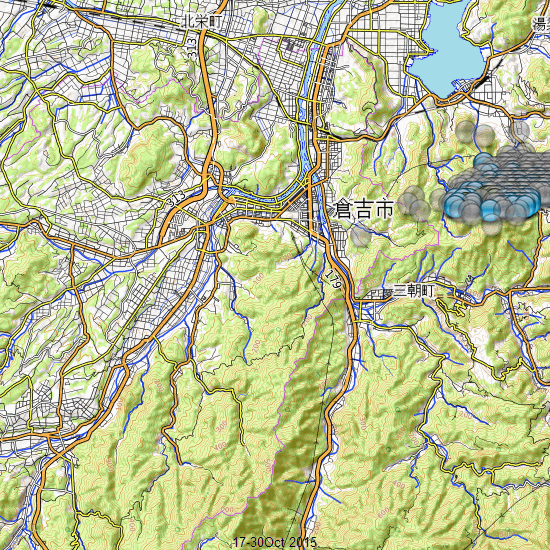
I'm sure there was something happened here before, the area is familiar, before Sept this year I mean. I often start a report then don't publish it because it didn't turn into anything of significance.
Ha! here it is, same time last year, 18-28 Oct 2015, a Swarm with a 4.2 and a 4.3 in it
5-10km NE of the 2016 swarm and yesterdays 6.1, 6.2, 6.6 (pick one)
japanquakes.blogspot.co.nz...
I added it to the Featured Reports category, so it is easier to find.
edit on 1000000029429416 by muzzy because: (no reason given)
The crew at NIED must be struggling with the sheer volume of events at Tottori, this from their site this morning
"Hypocenter lists on Oct 21, 2016 are not available."
That's JST they are talking about.
usually they put out the data for two days back NZST at around midnight my time.
There are 570 new Preliminary (automatically retrieved) events since yesterday,
total aftershocks now is at 1,264
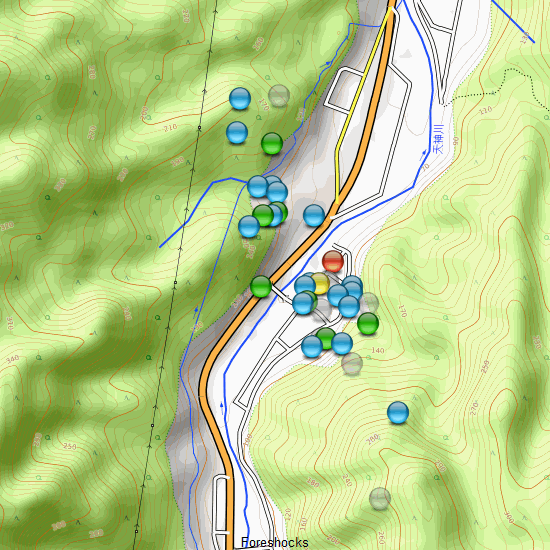
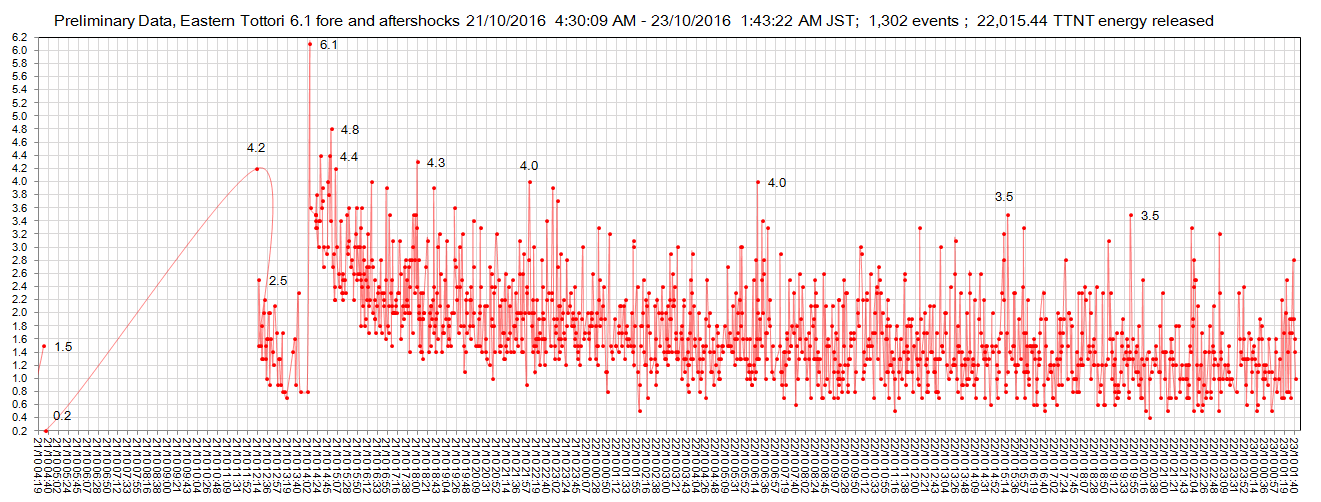
Time will tell when the Reviewed Data comes out, but the Preliminary data shows a 4.2 Foreshock, map below shows it (yellow icon)very close to the 6.1 location
I did a graph of the Preliminary data anyway, looks pretty standard. Could be used in conjunction with the graph I posted earlier, but don't forget these numbers will change when the reviewed data comes out
rightclickviewimageforfullsize
"Hypocenter lists on Oct 21, 2016 are not available."
That's JST they are talking about.
usually they put out the data for two days back NZST at around midnight my time.
There are 570 new Preliminary (automatically retrieved) events since yesterday,
total aftershocks now is at 1,264
edit on 1000000029529516 by muzzy because: (no reason given)
Time will tell when the Reviewed Data comes out, but the Preliminary data shows a 4.2 Foreshock, map below shows it (yellow icon)very close to the 6.1 location

I did a graph of the Preliminary data anyway, looks pretty standard. Could be used in conjunction with the graph I posted earlier, but don't forget these numbers will change when the reviewed data comes out
rightclickviewimageforfullsize

edit on 1000000029529516 by muzzy because: (no reason given)
Still no Reviewed data from NIED
this is unprecedented over 48 hrs now
nothing
oh well
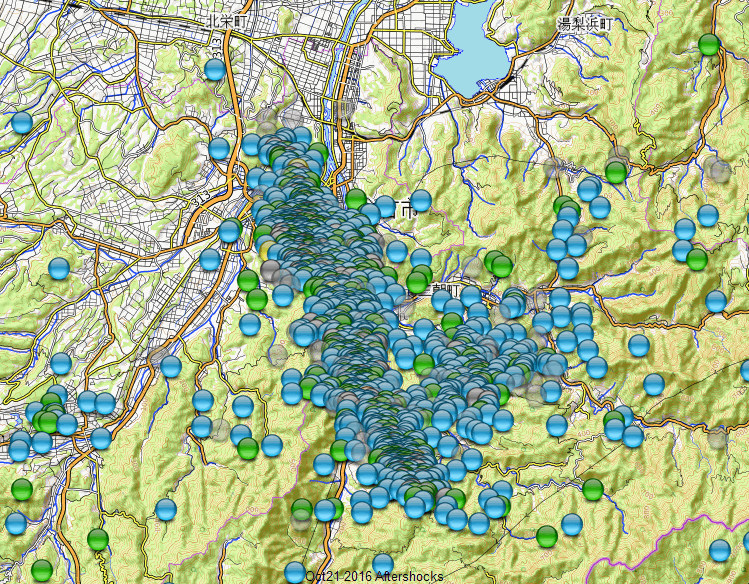
preliminary data map below, was at 1520 aftershocks, 5 hours ago.
this is unprecedented over 48 hrs now
nothing
oh well
preliminary data map below, was at 1520 aftershocks, 5 hours ago.

edit on 1000000029629616 by muzzy because: (no reason given)
Still no Reviewed data from NIED, 60 hours have passed !!
up to 1915 aftershocks (preliminary)
mag~1= 285
mag1= 1167
mag2= 371
mag3= 82
mag4= 9
mag5= 0
mag6= 1
JMA have only published 181 reviewed events so far
www.jma.go.jp...
I have gone ahead and published a page anyway, includes
NZTopo Map, Summary Count, Google Earth gadget, GE KMZ Link, Timeline Graph and the first 15 hours of the 100trace graphs (magnitudes unmarked) Eastern Tottori 6.1 and aftershocks (preliminary)
up to 1915 aftershocks (preliminary)
mag~1= 285
mag1= 1167
mag2= 371
mag3= 82
mag4= 9
mag5= 0
mag6= 1
JMA have only published 181 reviewed events so far
www.jma.go.jp...
edit on 1000000029629616 by muzzy because: (no reason given)
I have gone ahead and published a page anyway, includes
NZTopo Map, Summary Count, Google Earth gadget, GE KMZ Link, Timeline Graph and the first 15 hours of the 100trace graphs (magnitudes unmarked) Eastern Tottori 6.1 and aftershocks (preliminary)
edit on 1000000029629616 by muzzy because: (no reason given)
NEW ZEALAND
If you follow my NZEQ blog you may have noticed a slight change in activity over New Zealand, by viewing the thumbnails on the front page?
there is a shift away from East Cape, which has been the centre of movement for the last 7 weeks since the 7.1 there.
Yesterday UTC we had 5 more quakes (1.5 to 3.04, shallow 5-12km.) on the Alpine Fault east of Inchbonnie, in the Taverners Creek Valley, where there were 4 quakes on the 14th Oct.
May be nothing, but it has been a long time since we had any activity at all on the central part of the Alpine Fault.
Whether there is a bigger one brewing or not time will tell. New Zealand doesn't tend to have Foreshocks to big events like California or Japan does, they just hit out of the blue.
There have been big ones in the area before, but they were on the other side of the Taramakau River to the south, closer to Cass.
When, Mag
09/03/1929 10:50:00, 7.01
24/11/1995 06:18:58, 6.20
29/05/1995 10:06:42, 5.50
10/05/1993 17:08:10, 5.30
25/11/1995 08:16:17, 5.19
05/11/1943 14:39:40, 5.05
I did a search specifically for the Taverners Creek Valley 96 results since 1963, the biggest a 4.02 on 1978-01-01 11:25:39. I will have a look over that later and see if there are any matches to the bigger quakes to the south.
Christchurch had a bit of a twitch as well yesterday, 4 quakes there, 1.5 to 2.7
And a couple of high 2's at Arawhata River south of Jackson Bay on the West Coast.
TOTTORI JAPAN
The NIED reviwed data is finally in.......
the mainshock;
6.6 Magnitude calculated using displacement.
6.0 Magnitude calculated using velocity.
and 6.1 Mw according to AQUA www.hinet.bosai.go.jp...
For the 21st Oct JST, 1845 events for the whole day for all of Japan. Of those 1270 for Eastern Tottori, thats 3 times the number in the Preliminary data !!!! No wonder it took them 4 days to plot them all.
I will do the reviewed data this morning, but keep the preliminary data going on the Tottori page as well, as it is more up to date.
edit on
1000000029729716 by muzzy because: fixed some bad grammar and had missed a word
further on TOTTORI
First look at the map for 21 Oct 2016 JST.
The final location of the 6.6ML is 152 metres SE of the prelimianary location
It may be hard to find on the NZ Topo Map as there are two other quakes at the same spot and the icon won't split on NZ Topo, it is better to use the Google Earth gadget, where you can split them apart by clicking the top one, look 152m to the SE of the yellow 4.2 on the Hwy179 valley, about 2/3 way down in the aftershock cluster, just on the lower slopes of the hill there, the 3 stacked icon will have a darker base than the others around it. Which coloured icon you see will depend on the size of your device screen, on mine if you don't alter the preset tilt on the GE Gadget and just zoom straight to the location I described, the top icon is a grey one.
one of those was a 2.0 at JST: 21/10/2016 12:50:07 (UTC: 21/10/2016 03:50:07), before the 6.6, which makes it the official Foreshock, although there were others in the area as well.
Of note in the aftershocks is the one I called a M5 @ 21/10/2016 14:53:18 JST, that I seen on the 100trace graphs, it showed on the NIED preliminary data as a 4.8, has indeed been reviewed as a 5.0
BTW I have quit doing the Japan area region split graph from the 20th on, it just takes too much time. The graphs are still there on the pages I did them for, but now the thumbnails on the front page are like the NZ ones. For Japan I have made the new thumbnails from mag 2+ loactions, putting them all on (average 600 per day) they all looked the same. Basically the thumnail is a "heatmap" without the colours. Naturally the thumb for 21 Oct has a big black dot showing over Tottori.
I think my spare time would be better spent getting the Google Earth gadget on the archived pages and doing more historic archiving, there are well over a million events to process.
and
a lot more "foreshocks", in the 12 hours prior there were 74 events, right in the Maki area where the 6.6 happened
preliminary data only show 38
that 4.2 at 21/10/2016 12:12:23 down in the valley flat which was 1hr 55minutes before the 6.6 looks like it was the trigger
but how were they to know? Even if they had 2 hours warning to get out of Dodge (Maki), who is going to make that call?
It's slightly different than L'Aquilla, Italy where they had hundreds and hundreds of foreshocks. And they didn't evacuate there anyway.
Only the Chinese have the balls to make a decision like that. 1975 Haicheng earthquake
I have loaded the Foreshock data on a Google Earth gadget on the page, below the Preliminary Timeline graph. Tottori page
Too bad you can't open the gadget on mobile, or insert it here on ATS.
Once I have the main map done I will reverse the order, and leave the Preliminary maps and graph at the bottom, just for future reference.
First look at the map for 21 Oct 2016 JST.
The final location of the 6.6ML is 152 metres SE of the prelimianary location
It may be hard to find on the NZ Topo Map as there are two other quakes at the same spot and the icon won't split on NZ Topo, it is better to use the Google Earth gadget, where you can split them apart by clicking the top one, look 152m to the SE of the yellow 4.2 on the Hwy179 valley, about 2/3 way down in the aftershock cluster, just on the lower slopes of the hill there, the 3 stacked icon will have a darker base than the others around it. Which coloured icon you see will depend on the size of your device screen, on mine if you don't alter the preset tilt on the GE Gadget and just zoom straight to the location I described, the top icon is a grey one.
one of those was a 2.0 at JST: 21/10/2016 12:50:07 (UTC: 21/10/2016 03:50:07), before the 6.6, which makes it the official Foreshock, although there were others in the area as well.
Of note in the aftershocks is the one I called a M5 @ 21/10/2016 14:53:18 JST, that I seen on the 100trace graphs, it showed on the NIED preliminary data as a 4.8, has indeed been reviewed as a 5.0
BTW I have quit doing the Japan area region split graph from the 20th on, it just takes too much time. The graphs are still there on the pages I did them for, but now the thumbnails on the front page are like the NZ ones. For Japan I have made the new thumbnails from mag 2+ loactions, putting them all on (average 600 per day) they all looked the same. Basically the thumnail is a "heatmap" without the colours. Naturally the thumb for 21 Oct has a big black dot showing over Tottori.
I think my spare time would be better spent getting the Google Earth gadget on the archived pages and doing more historic archiving, there are well over a million events to process.
edit on 1000000029729716 by muzzy because: (no reason given)
and
a lot more "foreshocks", in the 12 hours prior there were 74 events, right in the Maki area where the 6.6 happened
preliminary data only show 38
that 4.2 at 21/10/2016 12:12:23 down in the valley flat which was 1hr 55minutes before the 6.6 looks like it was the trigger
but how were they to know? Even if they had 2 hours warning to get out of Dodge (Maki), who is going to make that call?
It's slightly different than L'Aquilla, Italy where they had hundreds and hundreds of foreshocks. And they didn't evacuate there anyway.
Only the Chinese have the balls to make a decision like that. 1975 Haicheng earthquake
edit on 1000000029729716 by muzzy because: (no reason given)
I have loaded the Foreshock data on a Google Earth gadget on the page, below the Preliminary Timeline graph. Tottori page
Too bad you can't open the gadget on mobile, or insert it here on ATS.
Once I have the main map done I will reverse the order, and leave the Preliminary maps and graph at the bottom, just for future reference.
edit
on 1000000029729716 by muzzy because: (no reason given)
a reply to: muzzy
Damn I forgot to download the Preliminary data yesterday, now it has moved on to the 24-25th JST
I'll have to leave that there where it was at, there is a gap in the data now of half a day at the end of the 23rd.
There is no archive of Preliminary data, usually the end of the Reviewed and start of the Preliminary match up, but because there was a 4 day delay on the Reviewed they don't blend together right now
They have only released the 21st, there is nothing after that.
I think we get the picture now anyway
15km long fault NW to SE.
What I wanted to do was compare the two.
Its a hard thing to see unless you use a table with three columns and compare them by time, but even that doesn't work to clearly as some of the times have changed by a few seconds, so the rows don't match up.
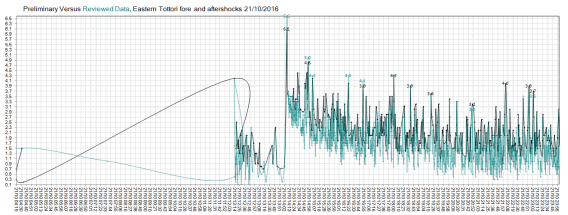
I tried a few things and came up with this, graph comparison
The black event points and lines are the preliminary (automatic)
and the teal coloured event points and lines are the reviewed (by a human)
I know those animations can be annoying, so here is a thumbnail of the two combined
if you want to see the full size animation click here
Interesting eh, initially the higher magnitudes (above 3.0) were lower than the reviewed ones, then they balanced out and either matched exactly or were higher than the reviewed. I wonder if the seismograph reset itself 26 minutes after the mainshock?, because thats when it reading started to be more accurate (no change on review) or maybe someone back at base threw a switch to re-calibrate them.
Right throughout the lower magnitudes (beloe 3.0) were too high, but heck there sure were a lot more of them than the automatic system picked up.
Damn I forgot to download the Preliminary data yesterday, now it has moved on to the 24-25th JST
I'll have to leave that there where it was at, there is a gap in the data now of half a day at the end of the 23rd.
There is no archive of Preliminary data, usually the end of the Reviewed and start of the Preliminary match up, but because there was a 4 day delay on the Reviewed they don't blend together right now
They have only released the 21st, there is nothing after that.
I think we get the picture now anyway
15km long fault NW to SE.
What I wanted to do was compare the two.
Its a hard thing to see unless you use a table with three columns and compare them by time, but even that doesn't work to clearly as some of the times have changed by a few seconds, so the rows don't match up.
I tried a few things and came up with this, graph comparison
The black event points and lines are the preliminary (automatic)
and the teal coloured event points and lines are the reviewed (by a human)
I know those animations can be annoying, so here is a thumbnail of the two combined

if you want to see the full size animation click here
Interesting eh, initially the higher magnitudes (above 3.0) were lower than the reviewed ones, then they balanced out and either matched exactly or were higher than the reviewed. I wonder if the seismograph reset itself 26 minutes after the mainshock?, because thats when it reading started to be more accurate (no change on review) or maybe someone back at base threw a switch to re-calibrate them.
Right throughout the lower magnitudes (beloe 3.0) were too high, but heck there sure were a lot more of them than the automatic system picked up.
edit on 1000000029729716 by muzzy because: hey it may seem I'm obssessing with this, but after Kyushu and Kumamoto its quite easy to do,
always thinking of new ways to present the data, also today I drew a bunch of sectional drawings for my work, a processed and loaded over 200 work
related images to my company web site, because its been raining again. I have to do something to keep my mind occupied otherwise I'd go crazy. I used
to drink beer.
edit on 1000000029729716 by muzzy because: (no reason given)
JMA Unified Hypocenter Catalog
█ Oct 22, 2016
-----Origin Time--------OTerr---Lat---LatErr---Long--LonErr---Dep--DepErr-Mag---------Region------------------------
Hypocenter lists on Oct 22, 2016 are not available.
█ Oct 23, 2016
-----Origin Time--------OTerr---Lat---LatErr---Long--LonErr---Dep--DepErr-Mag---------Region------------------------
Hypocenter lists on Oct 23, 2016 are not available.
█ Oct 24, 2016
-----Origin Time--------OTerr---Lat---LatErr---Long--LonErr---Dep--DepErr-Mag---------Region------------------------
Hypocenter lists on Oct 24, 2016 are not available.
█ Oct 25, 2016
-----Origin Time--------OTerr---Lat---LatErr---Long--LonErr---Dep--DepErr-Mag---------Region------------------------
Hypocenter lists on Oct 25, 2016 are not available.
damn this is frustrating
Hypocenter lists from Jun 3, 2002 (JST) to the day before yesterday are available.
█ Oct 22, 2016
-----Origin Time--------OTerr---Lat---LatErr---Long--LonErr---Dep--DepErr-Mag---------Region------------------------
Hypocenter lists on Oct 22, 2016 are not available.
█ Oct 23, 2016
-----Origin Time--------OTerr---Lat---LatErr---Long--LonErr---Dep--DepErr-Mag---------Region------------------------
Hypocenter lists on Oct 23, 2016 are not available.
█ Oct 24, 2016
-----Origin Time--------OTerr---Lat---LatErr---Long--LonErr---Dep--DepErr-Mag---------Region------------------------
Hypocenter lists on Oct 24, 2016 are not available.
█ Oct 25, 2016
-----Origin Time--------OTerr---Lat---LatErr---Long--LonErr---Dep--DepErr-Mag---------Region------------------------
Hypocenter lists on Oct 25, 2016 are not available.
damn this is frustrating
edit on 1000000029829816 by muzzy because: (no reason given)
4.2 Certaldo, Italy.
earthquake.usgs.gov...-info
I appreciate the Totorri info. I have been watching and wondering when something bigger is going to occur.
Oh Muzzy, Have yourself a beer. Just not when your working on the roofs. LOL!!!
earthquake.usgs.gov...-info
I appreciate the Totorri info. I have been watching and wondering when something bigger is going to occur.
Oh Muzzy, Have yourself a beer. Just not when your working on the roofs. LOL!!!
a reply to: crappiekat
yeah I could kick myself that I missed 21 hours of data off NIED
I had no idea they would take so long to determine the locations and magnitudes of the aftershocks
If I had of known I would have made sure I got all the automatic data as it came out, there is no way to get the missing 21 hours now.
It has really messed up my graph
it is now 5.5 days and all we got is the first 9hrs and 51minutes worth
I seen that Italian quake and had a look on INGV they only gave it a 3.9, but it has been converted to Mw, USGS are still in mb.
cnt.rm.ingv.it...
and looking on ISIDe, the data feed for INGV, there have been NO aftershocks
edit on 1000000029929916 by muzzy because: (no reason given)
meanwhile,
mag, time, lat, long, depth, where
5.0, 25/10/2016 11:46, 16.83°S, 173.95°W, 141, Tonga Islands
5.8, 25/10/2016 16:10, 15.60°S, 175.07°W, 10, Tonga Islands
6.0, 26/10/2016 5:19, 15.57°S, 174.99°W, 10, Tonga Islands
geofon.gfz-potsdam.de...
mag, time, lat, long, depth, where
5.0, 25/10/2016 11:46, 16.83°S, 173.95°W, 141, Tonga Islands
5.8, 25/10/2016 16:10, 15.60°S, 175.07°W, 10, Tonga Islands
6.0, 26/10/2016 5:19, 15.57°S, 174.99°W, 10, Tonga Islands
geofon.gfz-potsdam.de...
edit on 1000000029929916 by muzzy because: (no reason given)
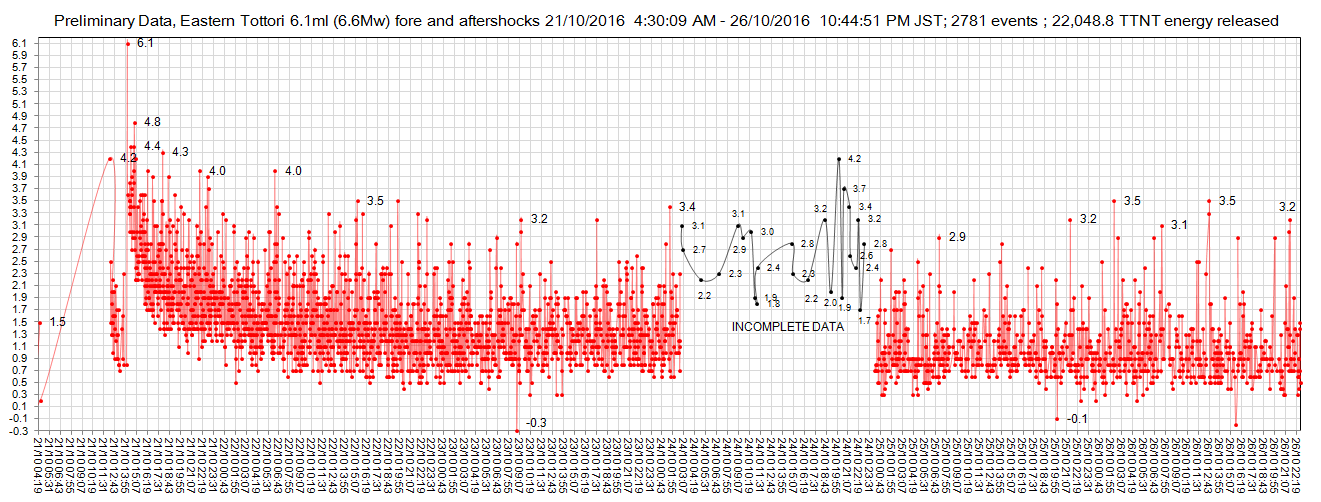
For continuity I have lifted 24 events that were available on the JMA [Information on seismic intensity at each site] page
www.jma.go.jp...
and squeezed them into the 21 hour gap, I see there was a 4.2 in that bunch, which would have been the 4th biggest aftershock, so worth putting in.
Pretty vague data though, a bit like LDEO where the location isn't too accurate and all the depths are the same (10km) and the time only shows h:mm
all the 24 events were at 35.4,133.9, or 35.4,133.8 and one at 35.4,133.7
rightclickviewimageforfullsize
I read that NIED did a test using the Preliminary Catalog to "test large inland aftershock sequences in Japan using real‐time data from the High Sensitivity Seismograph Network (Hi‐net) automatic hypocenter catalog (Hi‐net catalog), in which earthquakes are detected and determined automatically in real time. Employing the Omori–Utsu and Gutenberg–Richter models, we find that the proposed probability forecast estimated from the Hi‐net catalog outperforms the generic model with fixed parameter values for the standard aftershock activity in Japan. Therefore, the real‐time aftershock data from the Hi‐net catalog can be effectively used to tailor forecast models to a target aftershock sequence."
bssa.geoscienceworld.org...
I don't know what they did with the tests, I can't access bssa as I don't have an account with them, its probably a bunch of formulas and calculations that I wouldn't understand anyway.
but the Japanese are at the forefront of early earthquake warning (and forecasting?), so it probably pays not to dismiss the Hi‐net Preliminary Catalog as easily as I have in the recent past.
I have found the Hi‐net catalog PC coverage was only of the 4 main islands, and it missed many offshore events, and as I showed yesterday the magnitudes are either lower, the same, or higher than the manually reviewed data.
The Hi‐net catalog PC is a bit like the NZ Geonet's SeisComP3 system which gathers the data right away automatically, and often has up to 10 attempts at locating the quake, before a human steps in to take a look. Like on this one yesterday 4.8 East Cape Ridge, see Quake History at the bottom of the page, started as a 3.2 and ended up being a 4.8. The machines got close after the 9th attempt at 4.4. So not very accurate, but quicker than waiting for hours, if not days, for a scientist to pour over the graphs locating the quakes.
and squeezed them into the 21 hour gap, I see there was a 4.2 in that bunch, which would have been the 4th biggest aftershock, so worth putting in.
Pretty vague data though, a bit like LDEO where the location isn't too accurate and all the depths are the same (10km) and the time only shows h:mm
all the 24 events were at 35.4,133.9, or 35.4,133.8 and one at 35.4,133.7
rightclickviewimageforfullsize

I read that NIED did a test using the Preliminary Catalog to "test large inland aftershock sequences in Japan using real‐time data from the High Sensitivity Seismograph Network (Hi‐net) automatic hypocenter catalog (Hi‐net catalog), in which earthquakes are detected and determined automatically in real time. Employing the Omori–Utsu and Gutenberg–Richter models, we find that the proposed probability forecast estimated from the Hi‐net catalog outperforms the generic model with fixed parameter values for the standard aftershock activity in Japan. Therefore, the real‐time aftershock data from the Hi‐net catalog can be effectively used to tailor forecast models to a target aftershock sequence."
bssa.geoscienceworld.org...
I don't know what they did with the tests, I can't access bssa as I don't have an account with them, its probably a bunch of formulas and calculations that I wouldn't understand anyway.
but the Japanese are at the forefront of early earthquake warning (and forecasting?), so it probably pays not to dismiss the Hi‐net Preliminary Catalog as easily as I have in the recent past.
I have found the Hi‐net catalog PC coverage was only of the 4 main islands, and it missed many offshore events, and as I showed yesterday the magnitudes are either lower, the same, or higher than the manually reviewed data.
The Hi‐net catalog PC is a bit like the NZ Geonet's SeisComP3 system which gathers the data right away automatically, and often has up to 10 attempts at locating the quake, before a human steps in to take a look. Like on this one yesterday 4.8 East Cape Ridge, see Quake History at the bottom of the page, started as a 3.2 and ended up being a 4.8. The machines got close after the 9th attempt at 4.4. So not very accurate, but quicker than waiting for hours, if not days, for a scientist to pour over the graphs locating the quakes.
5.4 Visso, Italy
earthquake.usgs.gov...-info
Another one.
On August 24, 2016 they had a 4.9
earthquake-report.com...
Looking around at other sites, I wondered if USGS might go up on this one.
They did. 5.5
earthquake.usgs.gov...-info
earthquake.usgs.gov...-info
Another one.
On August 24, 2016 they had a 4.9
earthquake-report.com...
edit on 26-10-2016 by crappiekat because: to add
link
Looking around at other sites, I wondered if USGS might go up on this one.
They did. 5.5
earthquake.usgs.gov...-info
edit on 26-10-2016 by crappiekat because: to add
a reply to: crappiekat
6.0 Italy.
But no one has posted it yet
Here it is.
earthquake.usgs.gov...-info
I was hearing 6.4. That's why I didn't see it on USGS. They were changing it when I went to look.
Also this one popped off at the same time. 5.2 Acension Island
earthquake.usgs.gov...-info
Went back up to a 6.1.
6.0 Italy.
But no one has posted it yet
Here it is.
earthquake.usgs.gov...-info
edit on 26-10-2016 by crappiekat because: (no reason given)
I was hearing 6.4. That's why I didn't see it on USGS. They were changing it when I went to look.
Also this one popped off at the same time. 5.2 Acension Island
earthquake.usgs.gov...-info
edit on 26-10-2016 by crappiekat because: (no reason
given)
edit on 26-10-2016 by crappiekat because: to add link
edit on 26-10-2016 by crappiekat because: (no reason
given)
edit on 26-10-2016 by crappiekat because: (no reason given)
Went back up to a 6.1.
edit on 26-10-2016 by crappiekat because: to add
edit on 26-10-2016 by crappiekat because: sp
Man, Italy has been rocking it all day.
earthquake-report.com...
Just praying the death toll isn't like August.
earthquake-report.com...
Just praying the death toll isn't like August.
a reply to: crappiekat
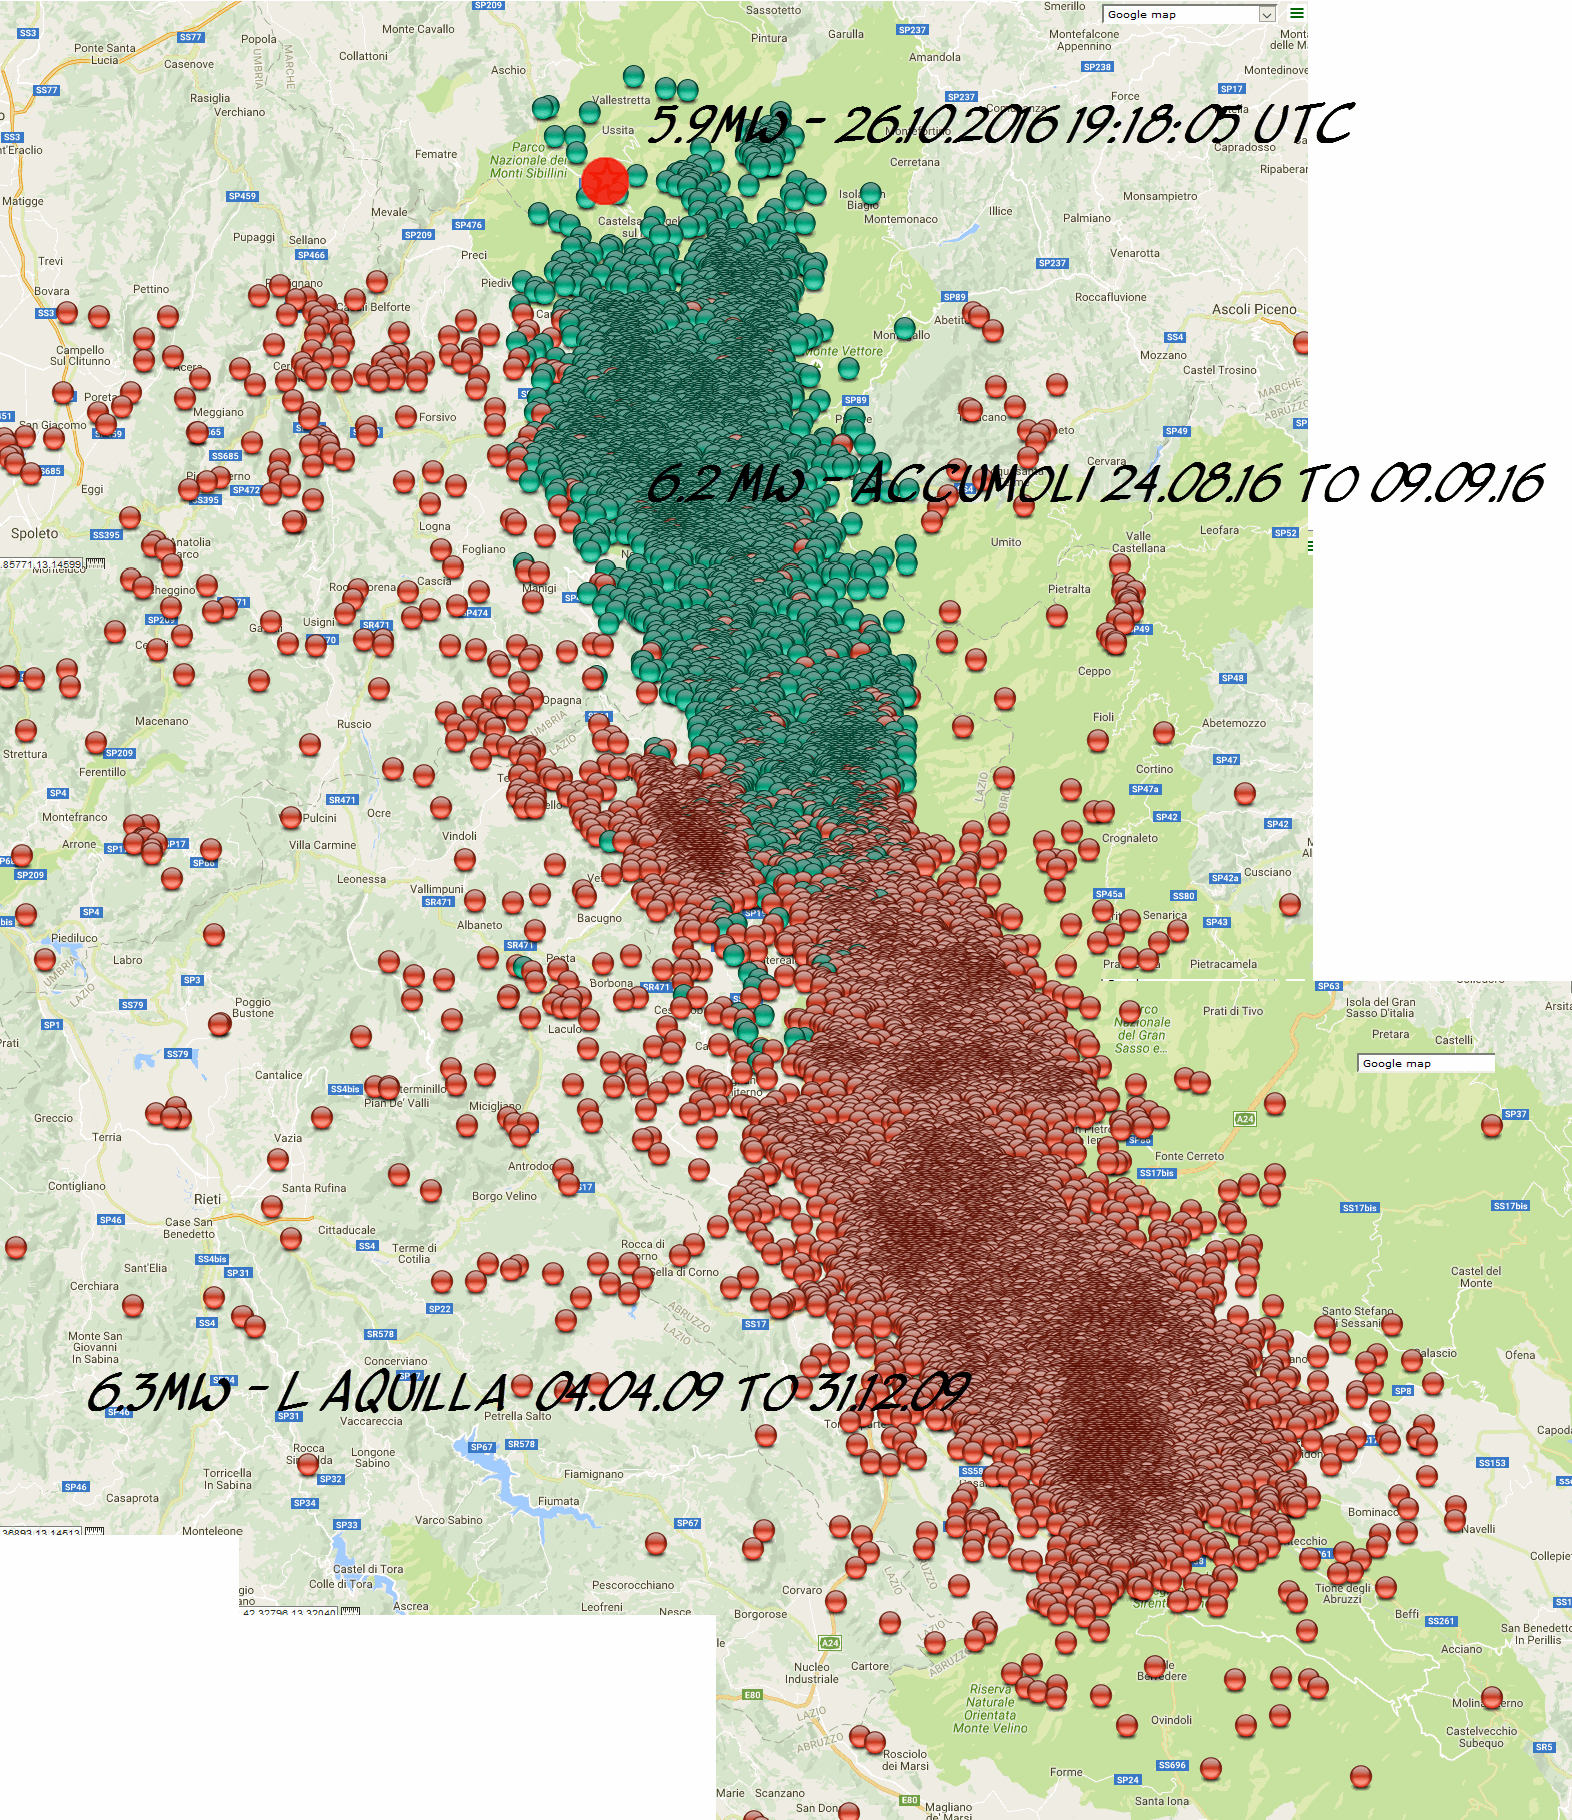
I heard about this on the truck radio on the way into the city this morning, reporter from there was saying not expecting it to be as bad as back in August Accumoli, Lazio, 6.0ML (6.2Mw) as a lot of people had left the area. But has been raining a lot in the area lately so landslides are a worry.
A quick look on the map and it seems to be right at the north end of the aftershock series from Accumoli.
Seems like the fault/s are working northwards from L'Aquilla each M6.
I only followed Accumoli for 16 days, 7009 aftershocks, they were fading a bit, the highest in the last few days (15-16th day) was 2.7.
I will go back and gather all the data right the way through. I think I did see some 4's on GFZ in the interim period.
What we need to do is look at the BIG PICTURE, which is only going to get bigger after this!
At least they are dropping in magnitude 0.1 point at a time
rightclickviewimagefortheBIGPICTURE (It's really big)

edit on 1000000030030016 by muzzy because: (no reason given)
a reply to: muzzy
timedout
actually if you are looking on a phone you don't need to righclickviewimageforfullsize, you just unpinch two fingers and it will get bigger, with no loss of quality (text etc) on the map. Must be because the image is big to start with.
Never noticed that before.
just had a search 40km circle around Accumoli 9 Sept (where I left off) to yesterday,
#Terremoti totali: 11,060
holy smokes !!!
I dropped the ball on that one
should have followed it through.
Oh and what is North of this new series?
62km north is ..........
Gubbio
i did a study onthe Gubbio valley in 2014, been a few big micro/minor mag swarms there.
edit on 1000000030030016 by muzzy because: (no reason
given)
Visso, Italy @ 23:24:11 (hh:mm:ss) elapsed time from the 5.4Mw 26/10/2016 17:10:36
mag1= 80
mag2= 294
mag3= 65
mag4= 4
mag5= 2 (5.4Mw & 5.9Mw)
total= 445
total energy released= 12,898.414 TTNT
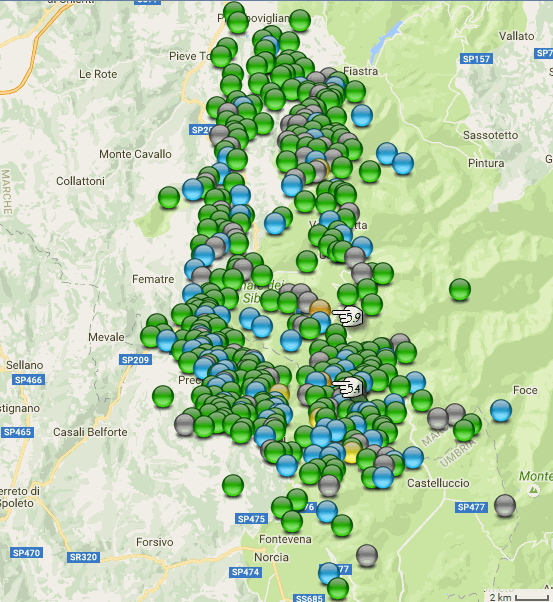
The official location
of the 5.9 is 42.915,13.128,"SP134, 62039 Visso MC, Italy"
and the 5.4 is 42.879,13.129,"Località Rapegna, 62039 Castel Sant'angelo Sul Nera MC, Italy"
So the aftershocks are all north of Norica, which means the fault has unzipped further north since the Accumoli 6.1Mw quake in August.
mag1= 80
mag2= 294
mag3= 65
mag4= 4
mag5= 2 (5.4Mw & 5.9Mw)
total= 445
total energy released= 12,898.414 TTNT

The official location
of the 5.9 is 42.915,13.128,"SP134, 62039 Visso MC, Italy"
and the 5.4 is 42.879,13.129,"Località Rapegna, 62039 Castel Sant'angelo Sul Nera MC, Italy"
So the aftershocks are all north of Norica, which means the fault has unzipped further north since the Accumoli 6.1Mw quake in August.
new topics
-
Gov Kristi Noem Shot and Killed "Less Than Worthless Dog" and a 'Smelly Goat
2024 Elections: 9 minutes ago -
Falkville Robot-Man
Aliens and UFOs: 23 minutes ago -
James O’Keefe: I have evidence that exposes the CIA, and it’s on camera.
Whistle Blowers and Leaked Documents: 1 hours ago -
Australian PM says the quiet part out loud - "free speech is a threat to democratic dicourse"...?!
New World Order: 1 hours ago -
Ireland VS Globalists
Social Issues and Civil Unrest: 2 hours ago -
Biden "Happy To Debate Trump"
Mainstream News: 2 hours ago -
RAAF airbase in Roswell, New Mexico is on fire
Aliens and UFOs: 3 hours ago -
What is the white pill?
Philosophy and Metaphysics: 4 hours ago -
Mike Pinder The Moody Blues R.I.P.
Music: 5 hours ago -
Putin, Russia and the Great Architects of the Universe
ATS Skunk Works: 8 hours ago
top topics
-
A Warning to America: 25 Ways the US is Being Destroyed
New World Order: 12 hours ago, 21 flags -
Biden "Happy To Debate Trump"
Mainstream News: 2 hours ago, 7 flags -
Mike Pinder The Moody Blues R.I.P.
Music: 5 hours ago, 7 flags -
What is the white pill?
Philosophy and Metaphysics: 4 hours ago, 5 flags -
Australian PM says the quiet part out loud - "free speech is a threat to democratic dicourse"...?!
New World Order: 1 hours ago, 5 flags -
RAAF airbase in Roswell, New Mexico is on fire
Aliens and UFOs: 3 hours ago, 4 flags -
Putin, Russia and the Great Architects of the Universe
ATS Skunk Works: 8 hours ago, 3 flags -
Ireland VS Globalists
Social Issues and Civil Unrest: 2 hours ago, 3 flags -
James O’Keefe: I have evidence that exposes the CIA, and it’s on camera.
Whistle Blowers and Leaked Documents: 1 hours ago, 3 flags -
Falkville Robot-Man
Aliens and UFOs: 23 minutes ago, 1 flags
active topics
-
Putin, Russia and the Great Architects of the Universe
ATS Skunk Works • 25 • : SchrodingersRat -
Gov Kristi Noem Shot and Killed "Less Than Worthless Dog" and a 'Smelly Goat
2024 Elections • 5 • : Sookiechacha -
Candidate TRUMP Now Has Crazy Judge JUAN MERCHAN After Him - The Stormy Daniels Hush-Money Case.
Political Conspiracies • 795 • : Threadbarer -
Ditching physical money
History • 22 • : StudioNada -
Biden "Happy To Debate Trump"
Mainstream News • 33 • : YourFaceAgain -
Falkville Robot-Man
Aliens and UFOs • 3 • : KKLOCO -
University of Texas Instantly Shuts Down Anti Israel Protests
Education and Media • 296 • : KrustyKrab -
Krystalnacht on today's most elite Universities?
Social Issues and Civil Unrest • 10 • : xuenchen -
Russia Ukraine Update Thread - part 3
World War Three • 5736 • : YourFaceAgain -
Manor Lords - Medieval City Builder with RTS Combat - Early Access 26th April
Video Games • 7 • : gortex
