It looks like you're using an Ad Blocker.
Please white-list or disable AboveTopSecret.com in your ad-blocking tool.
Thank you.
Some features of ATS will be disabled while you continue to use an ad-blocker.

Quake Watch 2013
page: 52share:
reply to post by ericblair4891
Hey Eric, I checked your link. It timed out for me; as did the recent quakes link. It is probably a problem with their site. That or we both need to be paranoid.
The folks in Oklahoma must be getting used to these earthquakes. I noticed only 11 folks have reported feeling this latest Mag 3.4.
I hope the residents aren't becoming complacent--many structures in the area aren't build to withstand shaking much larger than a mid mag 5...
edit on 3/6/2013 by Olivine because: editting
more at PEI (South Africa, not the Canadaian PEI) from LDEO
2013 3 6 15 43 12.0 -43.25 40.25 33.0 [color=9E7BFF]4.9 PRINCE EDWARD ISLANDS REGION
2013 3 6 14 52 56.0 -43.50 39.50 33.0 [color=9E7BFF] 4.9 PRINCE EDWARD ISLANDS REGION
2013 3 6 14 28 32.0 -43.25 40.25 33.0 [color=9E7BFF]4.9 PRINCE EDWARD ISLANDS REGION
2013 3 6 14 9 20.0 -43.25 39.75 33.0 [color=9E7BFF]4.8 PRINCE EDWARD ISLANDS REGION
2013 3 6 14 1 36.0 -43.25 40.25 33.0 [color=9E7BFF] 4.9 PRINCE EDWARD ISLANDS REGION
Here's a more complete list of that spasm at Yellowstone last night. The depths are interesting. One of the earthquakes took place above ground. I
know this isn't true. I'm just humouring myself. I understand uncertainty.
.....................................................................depthkm............................................
0.9 2013/03/05 00:15:02 44.091N 110.449W 4.3 ....... 58 km (36 mi) NE of Alta, WY
0.4 2013/03/04 14:29:56 44.468N 110.560W 3.5 ...... 48 km (30 mi) ESE of West Yellowstone, MT
-0.4 2013/03/04 14:29:47 44.473N 110.576W 4.3 .......... 47 km (29 mi) ESE of West Yellowstone, MT
1.0 2013/03/04 14:29:27 44.475N 110.582W 3.8 ......... 46 km (29 mi) ESE of West Yellowstone, MT
1.2 2013/03/04 14:21:50 44.475N 110.572W 3.5 ........ 47 km (29 mi) ESE of West Yellowstone, MT
2.0 2013/03/04 14:19:57 44.469N 110.570W 4.4 ........ 48 km (30 mi) ESE of West Yellowstone, MT
0.7 2013/03/04 14:06:37 44.469N 110.573W 4.8 ........ 47 km (29 mi) ESE of West Yellowstone, MT
2.3 2013/03/04 14:04:57 44.467N 110.549W 2.0 ......... 49 km (31 mi) ESE of West Yellowstone, MT
1.4 2013/03/04 14:04:02 44.471N 110.584W 5.3 ........... 47 km (29 mi) ESE of West Yellowstone, MT
1.9 2013/03/04 14:02:56 44.472N 110.571W 4.7 ......... 47 km (29 mi) ESE of West Yellowstone, MT
1.9 2013/03/04 14:02:42 44.474N 110.573W -2.8 ........ 47 km (29 mi) ESE of West Yellowstone, MT
1.9 2013/03/04 14:02:15 44.478N 110.576W 0.1 .......... 47 km (29 mi) ESE of West Yellowstone, MT
2.2 2013/03/04 14:01:24 44.477N 110.570W 2.9 .......... 47 km (29 mi) ESE of West Yellowstone, MT
0.7 2013/03/04 13:58:27 44.474N 110.575W 2.3 .......... 47 km (29 mi) ESE of West Yellowstone, MT
1.4 2013/03/04 13:57:37 44.472N 110.562W 4.8 .......... 48 km (30 mi) ESE of West Yellowstone, MT
1.5 2013/03/04 13:57:14 44.469N 110.572W 5.1 ........... 47 km (29 mi) ESE of West Yellowstone, MT
0.2 2013/03/04 13:56:49 44.477N 110.571W 6.9 ........... 47 km (29 mi) ESE of West Yellowstone, MT
1.6 2013/03/04 13:55:40 44.479N 110.660W -3.5 .......... 41 km (25 mi) ESE of West Yellowstone, MT
1.1 2013/03/04 13:50:17 44.479N 110.591W 2.2 ........... 46 km (28 mi) ESE of West Yellowstone, MT
0.6 2013/03/04 13:49:55 44.470N 110.569W 7.3 ........... 48 km (30 mi) ESE of West Yellowstone, MT
1.8 2013/03/04 13:49:18 44.426N 110.444W 2.8 ...........59 km (36 mi) ESE of West Yellowstone, MT
1.4 2013/03/04 13:49:10 44.479N 110.576W 2.4 ............47 km (29 mi) ESE of West Yellowstone, MT
0.7 2013/03/04 12:44:51 44.286N 110.463W 9.9 ............ 66 km (41 mi) SE of West Yellowstone, MT
0.3 2013/03/04 12:02:37 44.727N 111.022W 1.3 ............10 km ( 6 mi) NE of West Yellowstone, MT
1.0 2013/03/04 10:01:47 44.719N 111.035W 7.2 ............8 km ( 5 mi) NE of West Yellowstone, MT
edit on 6-3-2013 by ericblair4891 because: (no reason given)
M5.6 - 36km NNW of Hualian, Taiwan
2013-03-07 03:36:47 UTC
Event Time
2013-03-07 03:36:47 UTC
2013-03-07 11:36:47 UTC+08:00 at epicenter
2013-03-06 22:36:47 UTC-05:00 system time
Location
24.268°N 121.428°E depth=9.6km (6.0mi)
Nearby Cities
36km (22mi) NNW of Hualian, Taiwan
56km (35mi) SW of Su'ao, Taiwan
57km (35mi) NE of Buli, Taiwan
63km (39mi) SSW of Yilan, Taiwan
775km (482mi) ENE of Hong Kong, Hong Kong
2013-03-07 03:36:47 UTC
Event Time
2013-03-07 03:36:47 UTC
2013-03-07 11:36:47 UTC+08:00 at epicenter
2013-03-06 22:36:47 UTC-05:00 system time
Location
24.268°N 121.428°E depth=9.6km (6.0mi)
Nearby Cities
36km (22mi) NNW of Hualian, Taiwan
56km (35mi) SW of Su'ao, Taiwan
57km (35mi) NE of Buli, Taiwan
63km (39mi) SSW of Yilan, Taiwan
775km (482mi) ENE of Hong Kong, Hong Kong
edit on 6-3-2013 by kennvideo because: more info
reply to post by muzzy
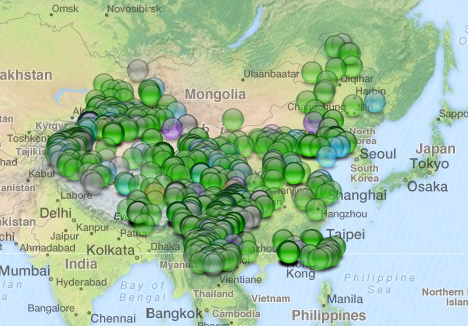
Had a crack at China February 2013.
A few hurdles, mainly the Chinese writing, I tried to translate the locations using Google Translate but it threw a fit and only converted about half of them.
Also the CENC covers the Whole World, so I had to narrow it down to just China and the border regions.
In the end I went with F_E Region names, a lot easier.all round
[color=lime](click image for interactive map, opens in new tab/window)
summary
mag1= 119
mag2= 667
mag3= 132
mag4= 29
mag5= 4
mag6= 0
mag7= 0
Total = 951
TTNT= 6, 043.601
New Page on Earthquake Archives called ...... ta da...... China
I will add more maps when I get time, data goes back to 1831BC
edit on 6-3-2013 by muzzy because: add link
I had a blogger - a real genuine geologist - link to my Santa Cruz seismograms sequence yesterday.
I think that you folks will like his blog - February: What a month to miss was the post but he has a lot of stuff I have not explored yet.
Enjoy!
I think that you folks will like his blog - February: What a month to miss was the post but he has a lot of stuff I have not explored yet.
Enjoy!
many thanks to the ONE person who read the China blog page
I've added January map this morning, includes the 6.3Ms at Lake Issyk-Kul Region on 29/01/2013, although its not actually in China, (Lake Issyk-Kul is in Kyrgystan) and the quake and aftershocks were in Kazakhstan the effects would surely have been felt in Northern Xinjiang. China.
Same with Burma, although they do have some central Burma quakes listed I've only used the ones that have "Myanmar-China Border Region" in the name, those of a bigger size would effect Yunnan.
This is where F_E Regions are handy
Earthquakes do not recognize political borders
I'll have to check out the F_E map for China, its a big country
edit on 7-3-2013 by muzzy because: (no reason given)
Click image for a larger version
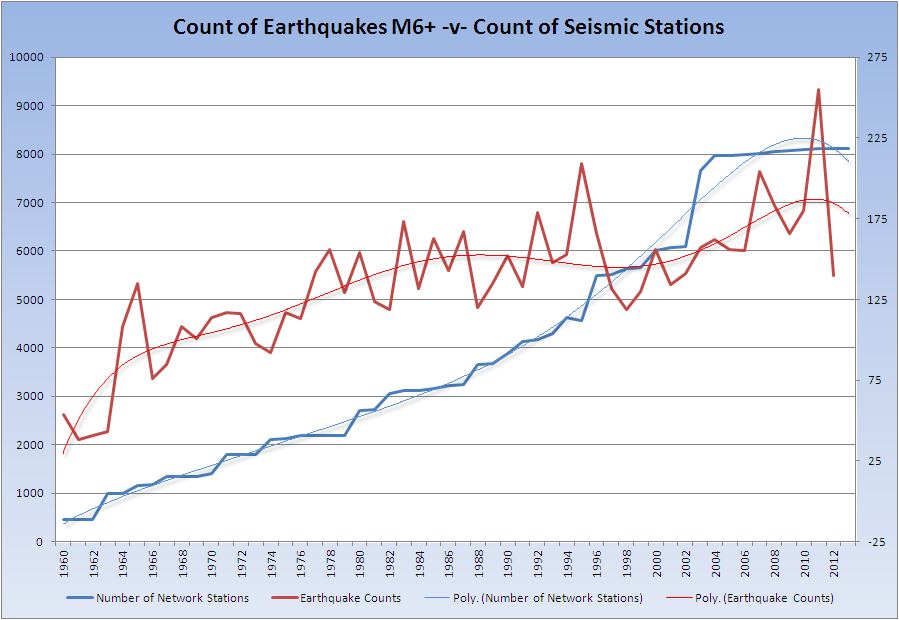
Finally stirred my lazy bones as I needed the information for another project. You can read a little more detail of sources here.
The project is concerned with SFU/AP indexes and earthquakes counts/energy to see if there is a correlation between solar output and earthquakes. This is work in progress as there is much to study, but initially this is the chart. I needed to confirm my suspicions as to why the counts just seem to go up until the last couple of years.
Click image for a larger version
On my Quake Watch blog I said:
Today, or over yesterday after 0700 UTC, they did just that and downgraded to 5.9.
It is farcical really. We know these are going to change yet it is ALWAYS over the 7 days - usually the 8th day after the event that the data changes. Stupidity, pig-ignorance or an agenda? Sack the interns and get someone to do the job properly.
If the other main agencies can get it right within a day or two, or actually usually on the day, why can't the USGS?
Note: The details below I am NOT entering yet as a Mag 6+ as the USGS data clearly shows it is not despite what the site may say.
2013-02-28 03:09:44, -17.770, 167.340, 6.1, 15.1, Vanuatu
Today, or over yesterday after 0700 UTC, they did just that and downgraded to 5.9.
It is farcical really. We know these are going to change yet it is ALWAYS over the 7 days - usually the 8th day after the event that the data changes. Stupidity, pig-ignorance or an agenda? Sack the interns and get someone to do the job properly.
If the other main agencies can get it right within a day or two, or actually usually on the day, why can't the USGS?
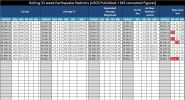
I have not created the Geophysical report yet this week but I have done all the charts for it. I thought I would share the stats table here since I
have things to do and the report may be a day or two in the making.
Note that currently as at this time (09:15 UTC 09 Mar) both Mag 6 and Mag 7 are past their average days between events.
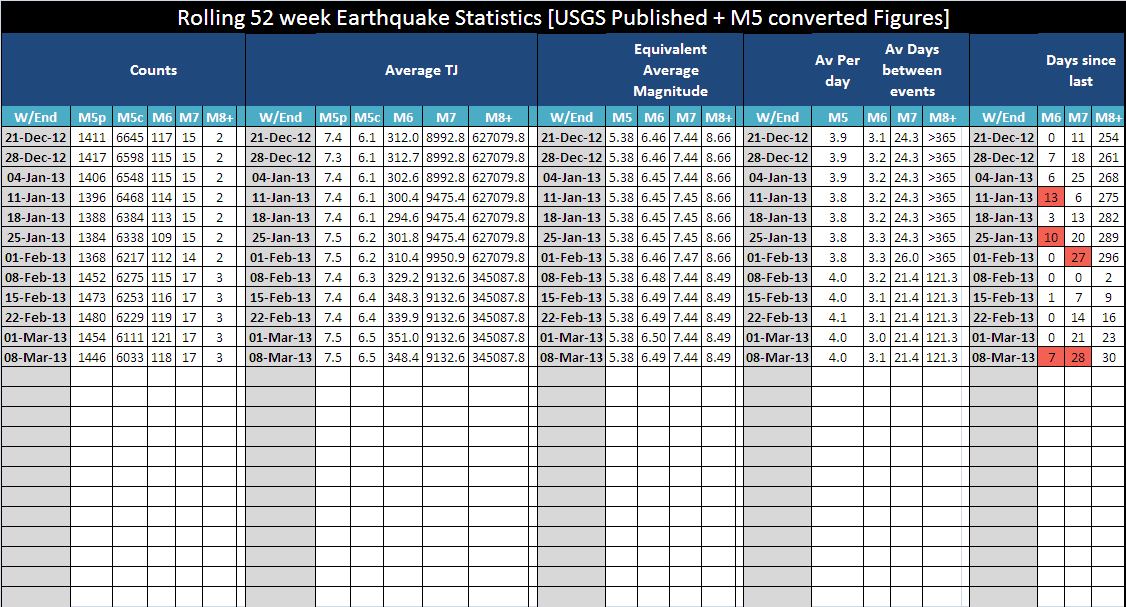
Click the image for the bigger picture.
PS don't know if I mentioned it but the 7.0 in Santa Cruz on the 08 Feb at 15:36 got uplifted to 7.1 at some point.
earthquake.usgs.gov...
Note that currently as at this time (09:15 UTC 09 Mar) both Mag 6 and Mag 7 are past their average days between events.

Click the image for the bigger picture.
PS don't know if I mentioned it but the 7.0 in Santa Cruz on the 08 Feb at 15:36 got uplifted to 7.1 at some point.
earthquake.usgs.gov...
edit on 9/3/2013 by PuterMan because: (no reason given)
reply to post by PuterMan
Because they have to compare data before another event,I mean they are waiting for another event in the same area to compare the two to see .....!?
If the other main agencies can get it right within a day or two, or actually usually on the day, why can't the USGS?
reply to post by PuterMan
Clicking image. Nothing
I'm sure it's me.
Clicking image. Nothing
I'm sure it's me.
edit on 9-3-2013 by crappiekat because: to add
reply to post by crappiekat
Mm, works OK for me. Don't know what to suggest.
See if the thumbnail expands for you
Mm, works OK for me. Don't know what to suggest.
See if the thumbnail expands for you
reply to post by piequal3because14
The thing is that the other agencies would surely by that logic have to do the same, but they don't and they get it right pretty much on the button.
I know that the determination of magnitude is a black art and shrouded in mystique and each agency boils the formula in a different way but the USGS cauldron would seem to be defective and the correct result seeps out of the bubbling mass of tails of newt and eyes of frog after the brew has cooled for a week.
Now in reality the cauldron is most likely a computer program and it would seem that the algorithm is defective in the initial instance as time and time again they shoot high and then drop down. To be fair I have looked at this in some depth in the past and on the whole the values change both up and down, but slightly more down, but it seems that recently it has wavered on the high side for low Mag 6.
The worrying thing is that these are then purported to have been checked by a seismologist and yet the seismologist seems incapable of looking at other sites stroking his long grey beard and saying to himself "Mm, the other wizards have a lower value and the moment tensors that we have done show it is lower. Wonder why that is?" Then he decides to ignore the fact that on the USGS site the tensor solutions show the quake as a lower value and let the world think that the quake is, for example, a 6.1 instead of a 5.9.
What is more curious is that this happens more often with quakes just on or above the M6 value than with any other magnitude. This year this has happened to at least 3 - all of which were reduced to the figure that the other agencies saw in their crystal ball in the initial instance.
It is not that I particularly mind as these things will sort themselves out in time, but if the USGS wish to look complete pratts then they should carry on as they are. Maybe if someone from USGS is reading this they should go back to the Chief Wizard and report the fact that they are considered inept and ineffective in their initial assessments.
"OMG Great Wizard. Peons out there, who matter not, consider that the Geological Survey of the Greatest Nation on the Planet in all of history since time immemorial now and ever shall be is inept by comparison to those pesky Europeans and in particular the Germans, and even the damn communists. What shall we do?"
A voice boomed from the heights of Mount Shasta, renamed Mount Olympus to be more fitting.
"Ignore them. We know best, for we are the best of the best of the best and they are just the rest."
I'm almost positive this is just my imagination, but. I could have sworn I saw the signature of helicopters all over the Yellowstone webicorders.
Even if I was certatin it's not my paranoia, I don't think there'd be anyway to prove it. So, I'll chalk it sown to snow-machines and snow-plows.
reply to post by ericblair4891
I could have sworn that I heard helicopters early this morning and they would have come my way.
I could have sworn that I heard helicopters early this morning and they would have come my way.
edit on 9-3-2013 by prophetboy12 because: (no
reason given)
Sunday March 10 2013,
10:18:17 UTC
15 minutes ago off the coast of Guatemala
5.8
17.1 USGS Feed
10:18:17 UTC
15 minutes ago off the coast of Guatemala
5.8
17.1 USGS Feed
reply to post by PuterMan
I thought it is a psychological program.
Because sometimes the magnitude it is not important but the psycological effect.
Leading ,leading,leading.
A computer program?
Now in reality the cauldron is most likely a computer program and it would seem that the algorithm is defective in the initial instance as time and time again they shoot high and then drop down. To be fair I have looked at this in some depth in the past and on the whole the values change both up and down, but slightly more down, but it seems that recently it has wavered on the high side for low Mag 6.
I thought it is a psychological program.
Because sometimes the magnitude it is not important but the psycological effect.
Funding,funding funding.
What is more curious is that this happens more often with quakes just on or above the M6 value than with any other magnitude. This year this has happened to at least 3 - all of which were reduced to the figure that the other agencies saw in their crystal ball in the initial instance.
It is not that I particularly mind as these things will sort themselves out in time, but if the USGS wish to look complete pratts then they should carry on as they are. Maybe if someone from USGS is reading this they should go back to the Chief Wizard and report the fact that they are considered inept and ineffective in their initial assessments.
Leading ,leading,leading.
new topics
-
A Warning to America: 25 Ways the US is Being Destroyed
New World Order: 38 minutes ago -
America's Greatest Ally
General Chit Chat: 1 hours ago -
President BIDEN's FBI Raided Donald Trump's Florida Home for OBAMA-NORTH KOREA Documents.
Political Conspiracies: 6 hours ago -
Maestro Benedetto
Literature: 7 hours ago -
Is AI Better Than the Hollywood Elite?
Movies: 8 hours ago -
Las Vegas UFO Spotting Teen Traumatized by Demon Creature in Backyard
Aliens and UFOs: 11 hours ago
top topics
-
President BIDEN's FBI Raided Donald Trump's Florida Home for OBAMA-NORTH KOREA Documents.
Political Conspiracies: 6 hours ago, 27 flags -
Krystalnacht on today's most elite Universities?
Social Issues and Civil Unrest: 17 hours ago, 9 flags -
Supreme Court Oral Arguments 4.25.2024 - Are PRESIDENTS IMMUNE From Later Being Prosecuted.
Above Politics: 17 hours ago, 8 flags -
Weinstein's conviction overturned
Mainstream News: 16 hours ago, 8 flags -
Gaza Terrorists Attack US Humanitarian Pier During Construction
Middle East Issues: 12 hours ago, 8 flags -
Massachusetts Drag Queen Leads Young Kids in Free Palestine Chant
Social Issues and Civil Unrest: 14 hours ago, 7 flags -
Las Vegas UFO Spotting Teen Traumatized by Demon Creature in Backyard
Aliens and UFOs: 11 hours ago, 6 flags -
Meadows, Giuliani Among 11 Indicted in Arizona in Latest 2020 Election Subversion Case
Mainstream News: 14 hours ago, 5 flags -
2024 Pigeon Forge Rod Run - On the Strip (Video made for you)
Automotive Discussion: 12 hours ago, 4 flags -
Is AI Better Than the Hollywood Elite?
Movies: 8 hours ago, 3 flags
active topics
-
Salvador Dali's Moustaches
People • 28 • : zosimov -
Is AI Better Than the Hollywood Elite?
Movies • 17 • : ThePsycheaux -
The best Rice dish i've ever tasted... Kimchi Rice
Food and Cooking • 26 • : lamhaocc -
A Warning to America: 25 Ways the US is Being Destroyed
New World Order • 1 • : 727Sky -
Massachusetts Drag Queen Leads Young Kids in Free Palestine Chant
Social Issues and Civil Unrest • 15 • : tarantulabite1 -
America's Greatest Ally
General Chit Chat • 1 • : BingoMcGoof -
How ageing is" immune deficiency"
Medical Issues & Conspiracies • 35 • : annonentity -
HORRIBLE !! Russian Soldier Drinking Own Urine To Survive In Battle
World War Three • 49 • : Freeborn -
Gaza Terrorists Attack US Humanitarian Pier During Construction
Middle East Issues • 30 • : Asher47 -
Electrical tricks for saving money
Education and Media • 8 • : anned1