It looks like you're using an Ad Blocker.
Please white-list or disable AboveTopSecret.com in your ad-blocking tool.
Thank you.
Some features of ATS will be disabled while you continue to use an ad-blocker.

Tremors felt 45 miles away from Bayou Corne Sinkhole!
page: 25share:
reply to post by happykat39
I was too late to add this to the original post...
The whole erosion issue is worse when salt is involved. It is easier to wash away with flowing water than rock.
Think of it this way, when the tide is high there are several more feet of water over the high tide area, and that water has weight. More weight = more pressure. Also, the cyclic nature of the tides act as a pump to force water into the faults at high tide and lets that water flow back out at low tide. While the effect of this is small it does, over enough time, cause erosion of the faults and makes it easier for them to slip and cause an earthquake.
I was too late to add this to the original post...
The whole erosion issue is worse when salt is involved. It is easier to wash away with flowing water than rock.
reply to post by Honor93
Doing well man, hope you are also! Good to see you in the threads (here and the Indy explosion thread, I haven't posted there but I have kept up), and to see that you are still providing valuable sources to those interested.
Looking a bit further into the bubbling etc in Napoleonville, I have found the following map:
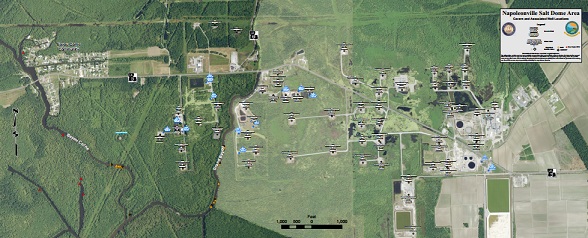
Map
This shows that there is bubbling being reported in many locations throughout the area.
The above referenced map and a host of other information can be found at the DNR page for the Bayou Corne Incident
Another interesing document I found contains the following image:
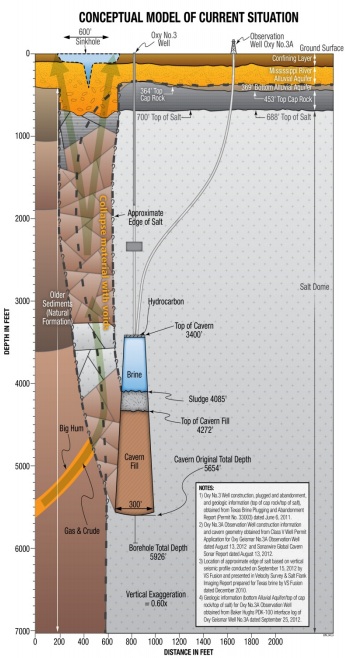
Source
This shows the caprock that AuntB was discussing and also shows what they think has occurred in relation to the collapse beneath the area the sinkhole formed.
There are also maps that show base clay and more bubbling sites. As you can see, there is bubbling occurring well away from the immediate vicinity of the sinkhole itself. This may indicate more instability than is initially thought.
As far as seismos and how sensitive and accurate they are, that depends on a number of factors, I will ask over in Quake Watch and see if I can get someone a bit more familiar with them to see if they can get more specific answers to your questions on those.
Doing well man, hope you are also! Good to see you in the threads (here and the Indy explosion thread, I haven't posted there but I have kept up), and to see that you are still providing valuable sources to those interested.
Looking a bit further into the bubbling etc in Napoleonville, I have found the following map:
Map
This shows that there is bubbling being reported in many locations throughout the area.
The above referenced map and a host of other information can be found at the DNR page for the Bayou Corne Incident
Another interesing document I found contains the following image:
Source
This shows the caprock that AuntB was discussing and also shows what they think has occurred in relation to the collapse beneath the area the sinkhole formed.
There are also maps that show base clay and more bubbling sites. As you can see, there is bubbling occurring well away from the immediate vicinity of the sinkhole itself. This may indicate more instability than is initially thought.
As far as seismos and how sensitive and accurate they are, that depends on a number of factors, I will ask over in Quake Watch and see if I can get someone a bit more familiar with them to see if they can get more specific answers to your questions on those.
reply to post by jadedANDcynical
some days better than others and thanks for asking.
yeah, i'm still floating around, glad you noticed
************
wow. that's an interesting link, thanks
question - it's dated from Oct, is there a more recent briefing available ?
say, did you happen to notice that the bubbling areas are concentrated S of the sinkhole and so are the Deep Formations ?
to me, that is surprising as i would think the swamp areas would show effects first.
(path of least resistance and all)
i'm so not impressed that the diagrams (purposely?) fail to clearly identify the aquifer location.
( like everyone knows what "alluvial" means )
ok, with this conceptual graph, i have a question.
as i wasn't aware of the Big Hum prior to reading about in enenews, based on the graph (alone), are they surmising that it is contributing to the gas/oil slick on the surface of the sinkhole ?
ETA -- regarding the seismos, a better question for those at Quake would be their placement addresses so we can view them too ... i don't know how to pinpoint them but i know some Quake members do.
edit on 26-11-2012 by Honor93 because: ETA
Originally posted by CajunBoy
reply to post by jadedANDcynical
Those are the sites, but I think what he is trying to say is that is not nearly enough to catch all the activity. Most of the tremors that happen are less that 4 on the reicter scale and would probably need a few more monitors to pick it up.
Not so. All that is required is three seismographs to be able to triangulate. Seismos can pick up down as low as Magnitude -1 or lower if the sensitivity is set to record that and especially if they are sat right on top of the area. (Yes I did mean minus 1. That is not a typo)
reply to post by Honor93
The network in which those seismos are placed is GS. The details of the GS network can be found here.
The LA series are about half way down and have red flags beside them denoting that they have real-time data.
You can see the latitude and longitude. If you click the link you get the details for the station - instrument type etc and a link to Google Maps for the location.
Further down the page you will see the links for Bud Tools. This takes you to the buffer of uniform data page where you should click on the Quack image. On the Quack page click on Explore Data.
In the network column go down to GS and click on it. The stations in the GS net that have public data will appear (adn some that don't). Click on LA01 for example. You will then see the three channels BHE (East/West movement), BHN(North/South movement, BHZ(Vertical movement)
Click on BHZ. The bottom of the Measurements column shows you the days that data is available in ordinal day format. Today for example is 331.
Click once on the link for the day you want and a new column Display Data will appear.
To see the seismogram for the day click on "Webicorder of selected time series data", or you can view "Webicorder of selected time series data". The rest of it won't mean a lot to you.
You can view any seismo in the world that is a part of the _REALTIME virtual network. (Warning - big page. Not advised for dial-up unless you are patient. Normally around 2 Mb)
Enjoy!
i don't know how to pinpoint them but i know some Quake members do
The network in which those seismos are placed is GS. The details of the GS network can be found here.
The LA series are about half way down and have red flags beside them denoting that they have real-time data.
You can see the latitude and longitude. If you click the link you get the details for the station - instrument type etc and a link to Google Maps for the location.
Further down the page you will see the links for Bud Tools. This takes you to the buffer of uniform data page where you should click on the Quack image. On the Quack page click on Explore Data.
In the network column go down to GS and click on it. The stations in the GS net that have public data will appear (adn some that don't). Click on LA01 for example. You will then see the three channels BHE (East/West movement), BHN(North/South movement, BHZ(Vertical movement)
Click on BHZ. The bottom of the Measurements column shows you the days that data is available in ordinal day format. Today for example is 331.
Click once on the link for the day you want and a new column Display Data will appear.
To see the seismogram for the day click on "Webicorder of selected time series data", or you can view "Webicorder of selected time series data". The rest of it won't mean a lot to you.
You can view any seismo in the world that is a part of the _REALTIME virtual network. (Warning - big page. Not advised for dial-up unless you are patient. Normally around 2 Mb)
Enjoy!
Originally posted by Honor93
reply to post by jadedANDcynical
howdy J&C, how you doin' ?
wow, that image seems rather confusing from what i've seen in other links provided
(just above this post).
it looks like the area known as the "production zone" which is N ? of the salt dome has the greatest concentration of monitors and if the activity is eminating from the dome region in other directions, they might be too centralized to detect much.
just off the cuff, if these were active a week ago, did they detect the recent growth of the sinkhole ?
East of the dome I believe but don't quote me.
See my response to CajunBoy as regards detection.
Please detail precise dates, or use the instructions I gave above to retrieve the seismos for the relevant days. I have to be off and do some work now but I will call back this evening.
And there ya go folks, hope PMs posts answer your questions.
Honor, I will look into those queries you posited tomorrow. It's way past bed time for me now and I'm a little drowsy...
Honor, I will look into those queries you posited tomorrow. It's way past bed time for me now and I'm a little drowsy...
reply to post by Honor93
What is contributing to the oil on the sinkhole is, there is a oil deposit underneath the hole but at 12,000 ft. The hole displaced a lot of the ground above that deposit and oil just began to push up along with methane.
Sorry guys, I am just getting back from BC. All it well it seems. No real strange happenings when I was there.
It is currently raining out here and it looks like it will be an all day event. Last rain down here around the sinkhole was November 4th.
edit
on 26-11-2012 by CajunBoy because: (no reason given)
folkworm.ceri.memphis.edu...
ALL the helicorders in the area yesterday looked really weird, lots of activity like all week. The Bayou Corne recorder looks like it had a busy couple days. But wait! Dr. Horton told us there was no activity! Yesterday, there was stupid amounts of activity but no work at the site.
ALL the helicorders in the area yesterday looked really weird, lots of activity like all week. The Bayou Corne recorder looks like it had a busy couple days. But wait! Dr. Horton told us there was no activity! Yesterday, there was stupid amounts of activity but no work at the site.
edit on 26-11-2012 by CajunBoy because: (no reason given)
reply to post by CajunBoy
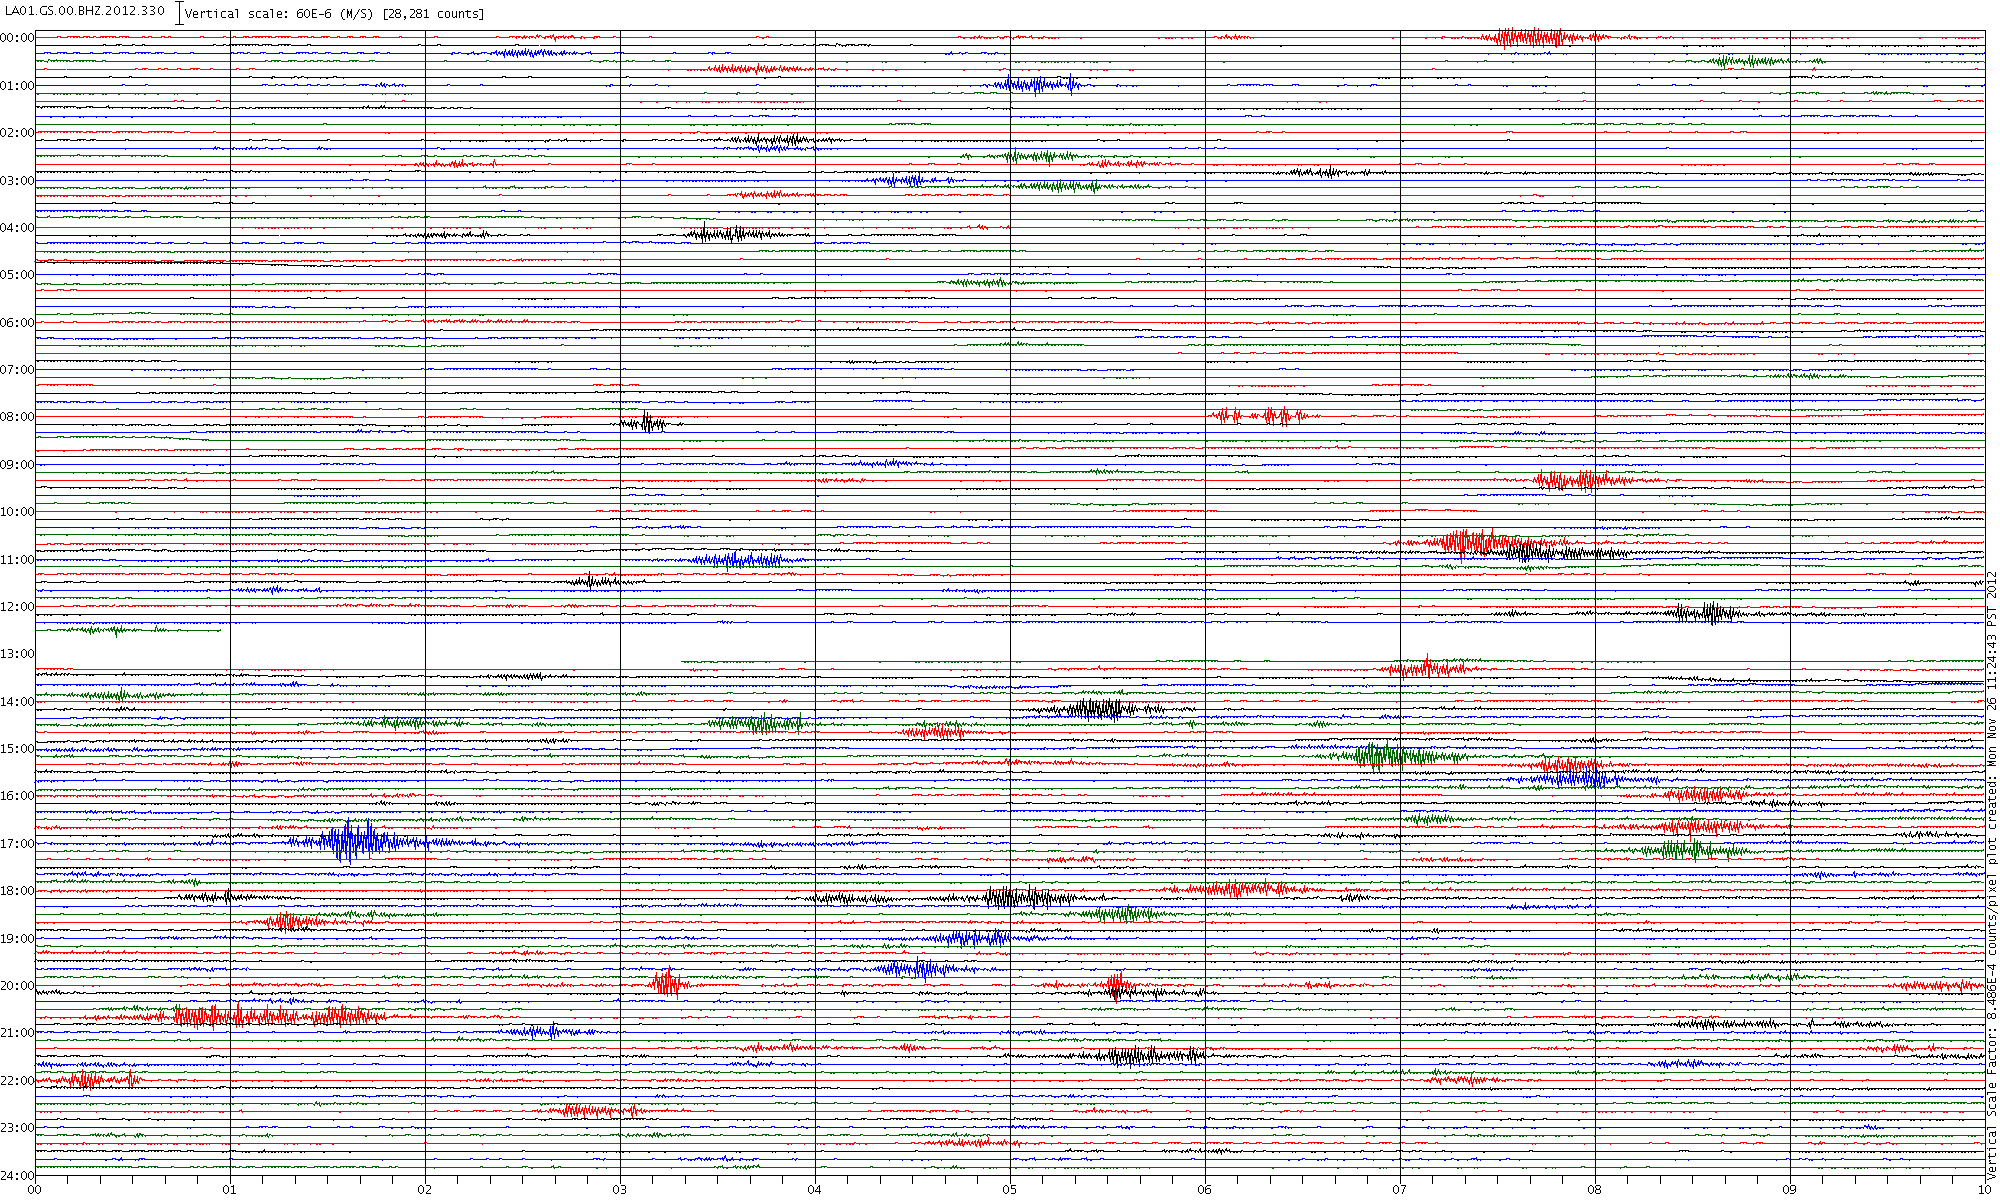
Following PM's instructions (and admittedly, I might be off but I don't think I am), Here is the plot for 11/25/2012 for the LA01 helicorder:
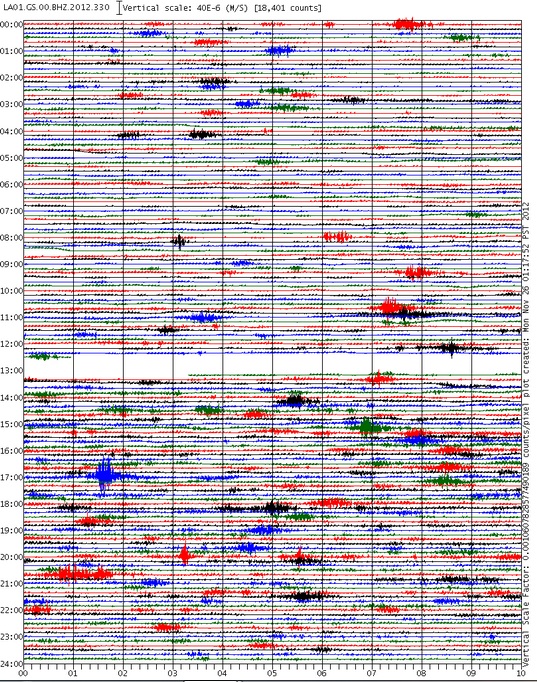
Source
If this is what you are seeing, It think that those are extremely tiny movements due to the scale shown at the top of the graph (Vertical scale: 40E-6 (M/S)...). Not only that, but none of the movements seem to have the characteristic sharp spike associated with seismic movement.
There is a block from about 12:45ish to 1:15ish (I think these are UTC times) which seems to be missing, but that is probably network drop out or the unit itself dropping data.
Do you remember any specific days that people reported feeling rumbling in the area? I will look to see if I can locate those with the site PM linked above and we can see what the seismos show on those days.
It looks like it goes back 3 weeks inclusive of today.
Here is today's plot up to the time of this post, btw:
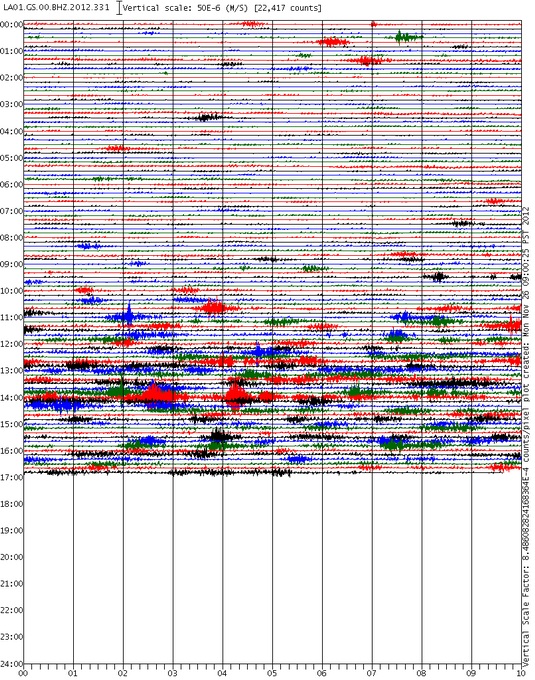
Source
Not sure if the source links for the webicorders will work past 3 weeks from now if someone reads this post at a later date.
As you can see the activity picks up between 10 and 11:00, and increases as the day goes on.
Again, none of this looks seismic to my extremely untrained eye (and the scale is a bit different, 50E-6...), but take this with a pinch of salt; no pun intended.
Following PM's instructions (and admittedly, I might be off but I don't think I am), Here is the plot for 11/25/2012 for the LA01 helicorder:
Source
If this is what you are seeing, It think that those are extremely tiny movements due to the scale shown at the top of the graph (Vertical scale: 40E-6 (M/S)...). Not only that, but none of the movements seem to have the characteristic sharp spike associated with seismic movement.
There is a block from about 12:45ish to 1:15ish (I think these are UTC times) which seems to be missing, but that is probably network drop out or the unit itself dropping data.
Do you remember any specific days that people reported feeling rumbling in the area? I will look to see if I can locate those with the site PM linked above and we can see what the seismos show on those days.
It looks like it goes back 3 weeks inclusive of today.
Here is today's plot up to the time of this post, btw:
Source
Not sure if the source links for the webicorders will work past 3 weeks from now if someone reads this post at a later date.
As you can see the activity picks up between 10 and 11:00, and increases as the day goes on.
Again, none of this looks seismic to my extremely untrained eye (and the scale is a bit different, 50E-6...), but take this with a pinch of salt; no pun intended.
Originally posted by Honor93
reply to post by jadedANDcynical
some days better than others and thanks for asking.
yeah, i'm still floating around, glad you noticed
Glad to hear about the better days
And of course I noticed, you made quite an impression on me in that hoax thread...
************
wow. that's an interesting link, thanks
question - it's dated from Oct, is there a more recent briefing available ?
say, did you happen to notice that the bubbling areas are concentrated S of the sinkhole and so are the Deep Formations ?
to me, that is surprising as i would think the swamp areas would show effects first.
(path of least resistance and all)
This is the most recent briefing I have been able to find and I know there have been a significant amount of updates made since October. I will keep searching to see if I can locate a more up to date version of this document.
I did notice the bubbling locations and thought it was odd myself.
i'm so not impressed that the diagrams (purposely?) fail to clearly identify the aquifer location.
( like everyone knows what "alluvial" means )
Does this help?
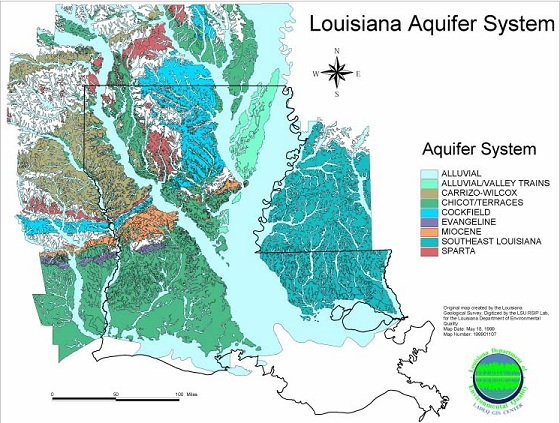
Source
ok, with this conceptual graph, i have a question.
as i wasn't aware of the Big Hum prior to reading about in enenews, based on the graph (alone), are they surmising that it is contributing to the gas/oil slick on the surface of the sinkhole ?
I'm going to have to read up on the Big Hum and get back to you on this.
Considering Southeast Louisiana is all swamp but just drained out and leveed up, anything can be effected.
I am now thinking about it, TB doesn't work pass 5pm for some odd reason and it looks like the activity pretty much slows down at that point. Much of the activity happened Tuesday and Wednesday (11/20 and 11/21) night from the resident reports. They also reported foul odor during or just right after the tremors. May this be just small eruptions of methane or H2S coming up in random areas that no one can find because it just closes up after due to the ground being swamp?
To me this seems plausible, a lot of the area is pretty much impossible to get to unless there is a road going to it. That or you have a pirogue and some boots to get deep into the swamp.
You have to remember Texas Brine hid the H2S for 24 hours, there may be more things we yet to find out about. They are seriously downplaying this hole down here and it is getting annoying.
edit on 26-11-2012 by CajunBoy because: (no reason given)
edit on 26-11-2012 by CajunBoy
because: (no reason given)
Also, forgot to add, there was NO work yesterday at the sinkhole so anything on the graph for yesterday is not from Texas Brine.
reply to post by CajunBoy
You will know about it soon enough!
H2S, hydrogen Sulphide, ROTTEN EGGS.
when this H2S starts to be detected in the shallow well aquifer
You will know about it soon enough!
H2S, hydrogen Sulphide, ROTTEN EGGS.
reply to post by jadedANDcynical
No the web references will not work past the realtime archive date. If that is three weeks then anything old than that is gone.
I am not going to tell you how to do this next magic, only because you need to understand how the charts are produced before you start fiddling with the parameters.
When you note that the scales are different you are correct and you are not visually comparing like for like.
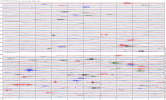
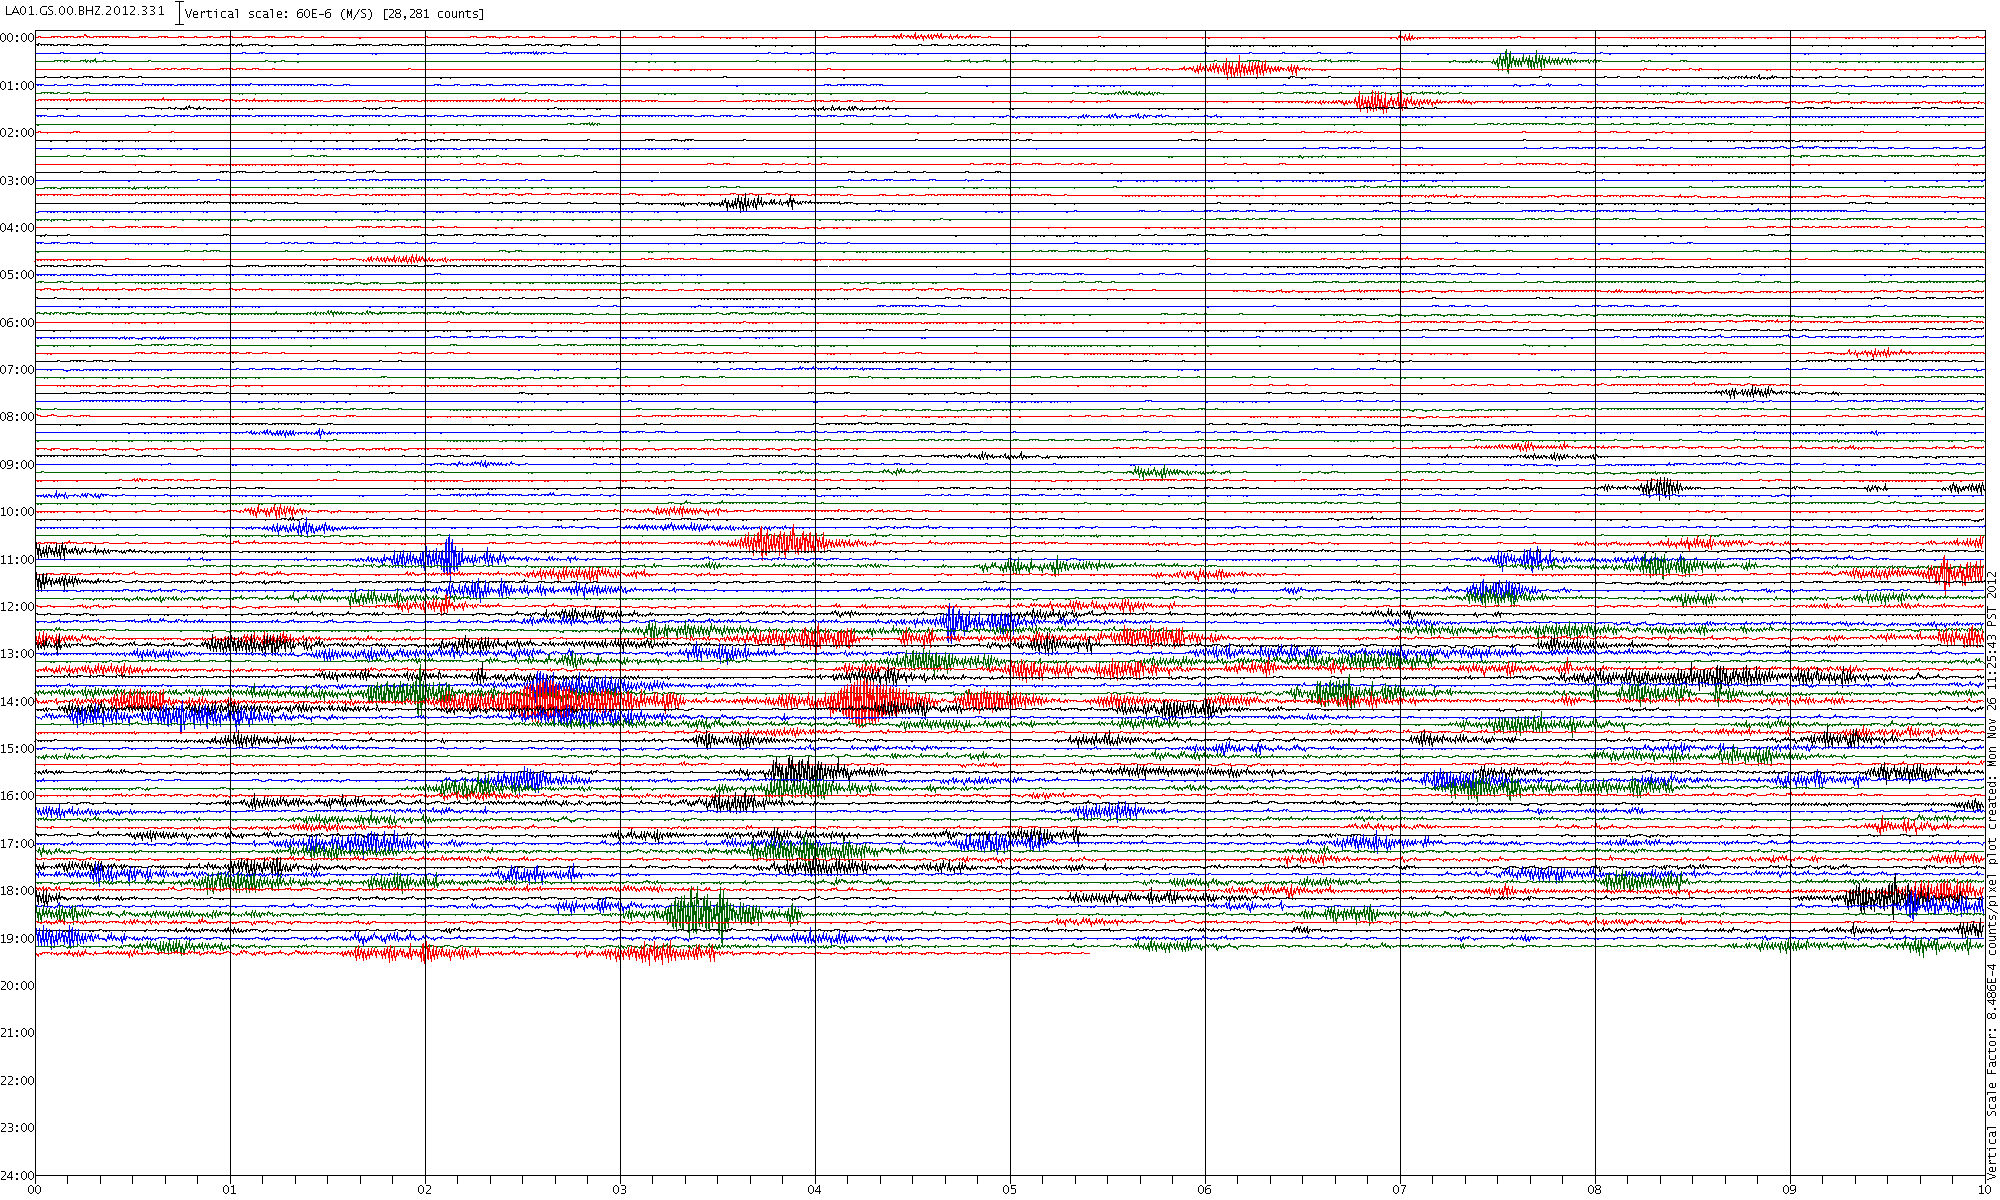
Here are those two days again with a much larger plot and BOTH at the same scale.
Day 330
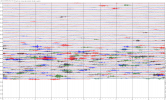
Day 331 (as far as it goes at this time)
I love the larger scale as it makes things so much easier to see.
No the web references will not work past the realtime archive date. If that is three weeks then anything old than that is gone.
I am not going to tell you how to do this next magic, only because you need to understand how the charts are produced before you start fiddling with the parameters.
When you note that the scales are different you are correct and you are not visually comparing like for like.
Here are those two days again with a much larger plot and BOTH at the same scale.
Day 330
Day 331 (as far as it goes at this time)
I love the larger scale as it makes things so much easier to see.
reply to post by jadedANDcynical
Just an additional point. Note that most activity occurs after 10 am UTC on the plots?
Note that day 330 is relatively smaller traces than day 331?
Given that this area is UTC -5 that would suggest that something starts to happen around 5am local time. On day 330 it only happens infrequently and with less amplitude and later in the day.
Think Sunday, no trucks only cars getting busier around 9 am. The following day (331) and the wagons (trucks) hit the road around 5.
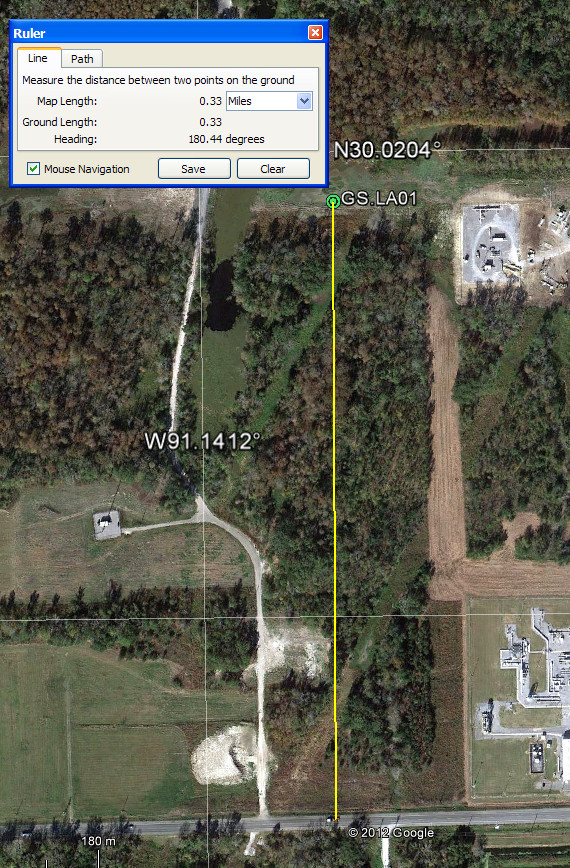
Classic cultural noise in my humble opinion. There will be a road near that seismo. Mind the name of the seismo "GS.LA01 North of Hwy 70, Belle Rose, LA USA" seems to suggest there may be a little traffic!
You can't get much closer than that without compromising the seismo completely
Just an additional point. Note that most activity occurs after 10 am UTC on the plots?
Note that day 330 is relatively smaller traces than day 331?
Given that this area is UTC -5 that would suggest that something starts to happen around 5am local time. On day 330 it only happens infrequently and with less amplitude and later in the day.
Think Sunday, no trucks only cars getting busier around 9 am. The following day (331) and the wagons (trucks) hit the road around 5.
Classic cultural noise in my humble opinion. There will be a road near that seismo. Mind the name of the seismo "GS.LA01 North of Hwy 70, Belle Rose, LA USA" seems to suggest there may be a little traffic!
You can't get much closer than that without compromising the seismo completely
reply to post by PuterMan
Always traffic on Hwy 70 it's is the only road that passes through the Pierre Part community. It stretches from LA 1 in Napoleonville and goes all the way to Morgan City along the coast. The entire drive is swamp swamp and more swamp. So the only traffic on this road really is Pierre Part residents.
Always traffic on Hwy 70 it's is the only road that passes through the Pierre Part community. It stretches from LA 1 in Napoleonville and goes all the way to Morgan City along the coast. The entire drive is swamp swamp and more swamp. So the only traffic on this road really is Pierre Part residents.
reply to post by CajunBoy
Here is a sound file of a bit of that. Sound file .FLAC 330 Kb (WinAmp plays flac files)
Trucks, cars, whatever it is vehicles for certain. That is 20 x speed but it is absolutely NOT any seismic activity. Not no way no how.
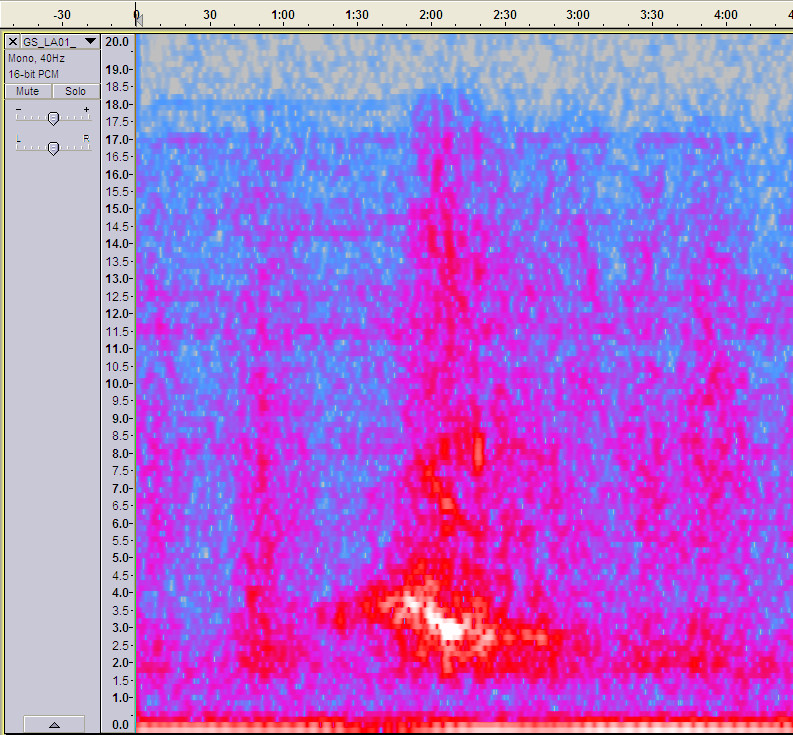
Here is a section f the file:
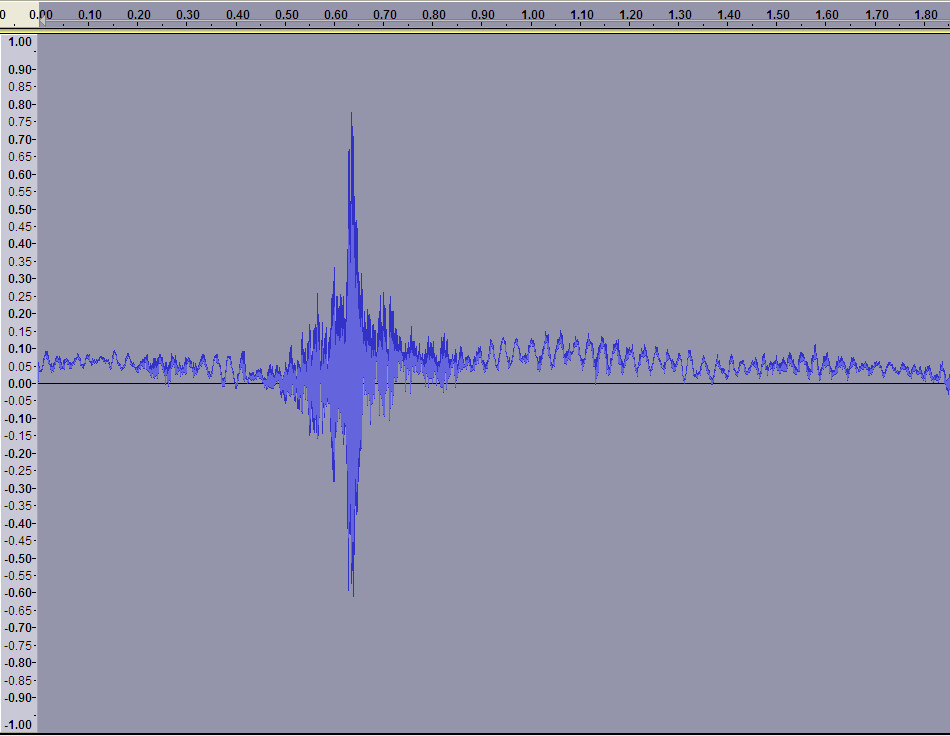
and this is the spectrogram of that.
There is another way you can tell it is traffic. Compare these three large scale plots of the BHE, BHNand BHZ channels (East, North and Vertical)
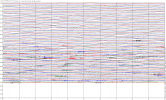
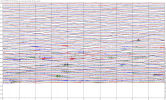
Notice that the East and North are not nearly as heavy traces as the vertical? This also shows this is not an earthquake. The traffic makes the road bounce up and down but little sideways movement.
Here is a sound file of a bit of that. Sound file .FLAC 330 Kb (WinAmp plays flac files)
Trucks, cars, whatever it is vehicles for certain. That is 20 x speed but it is absolutely NOT any seismic activity. Not no way no how.
Here is a section f the file:
and this is the spectrogram of that.
There is another way you can tell it is traffic. Compare these three large scale plots of the BHE, BHNand BHZ channels (East, North and Vertical)
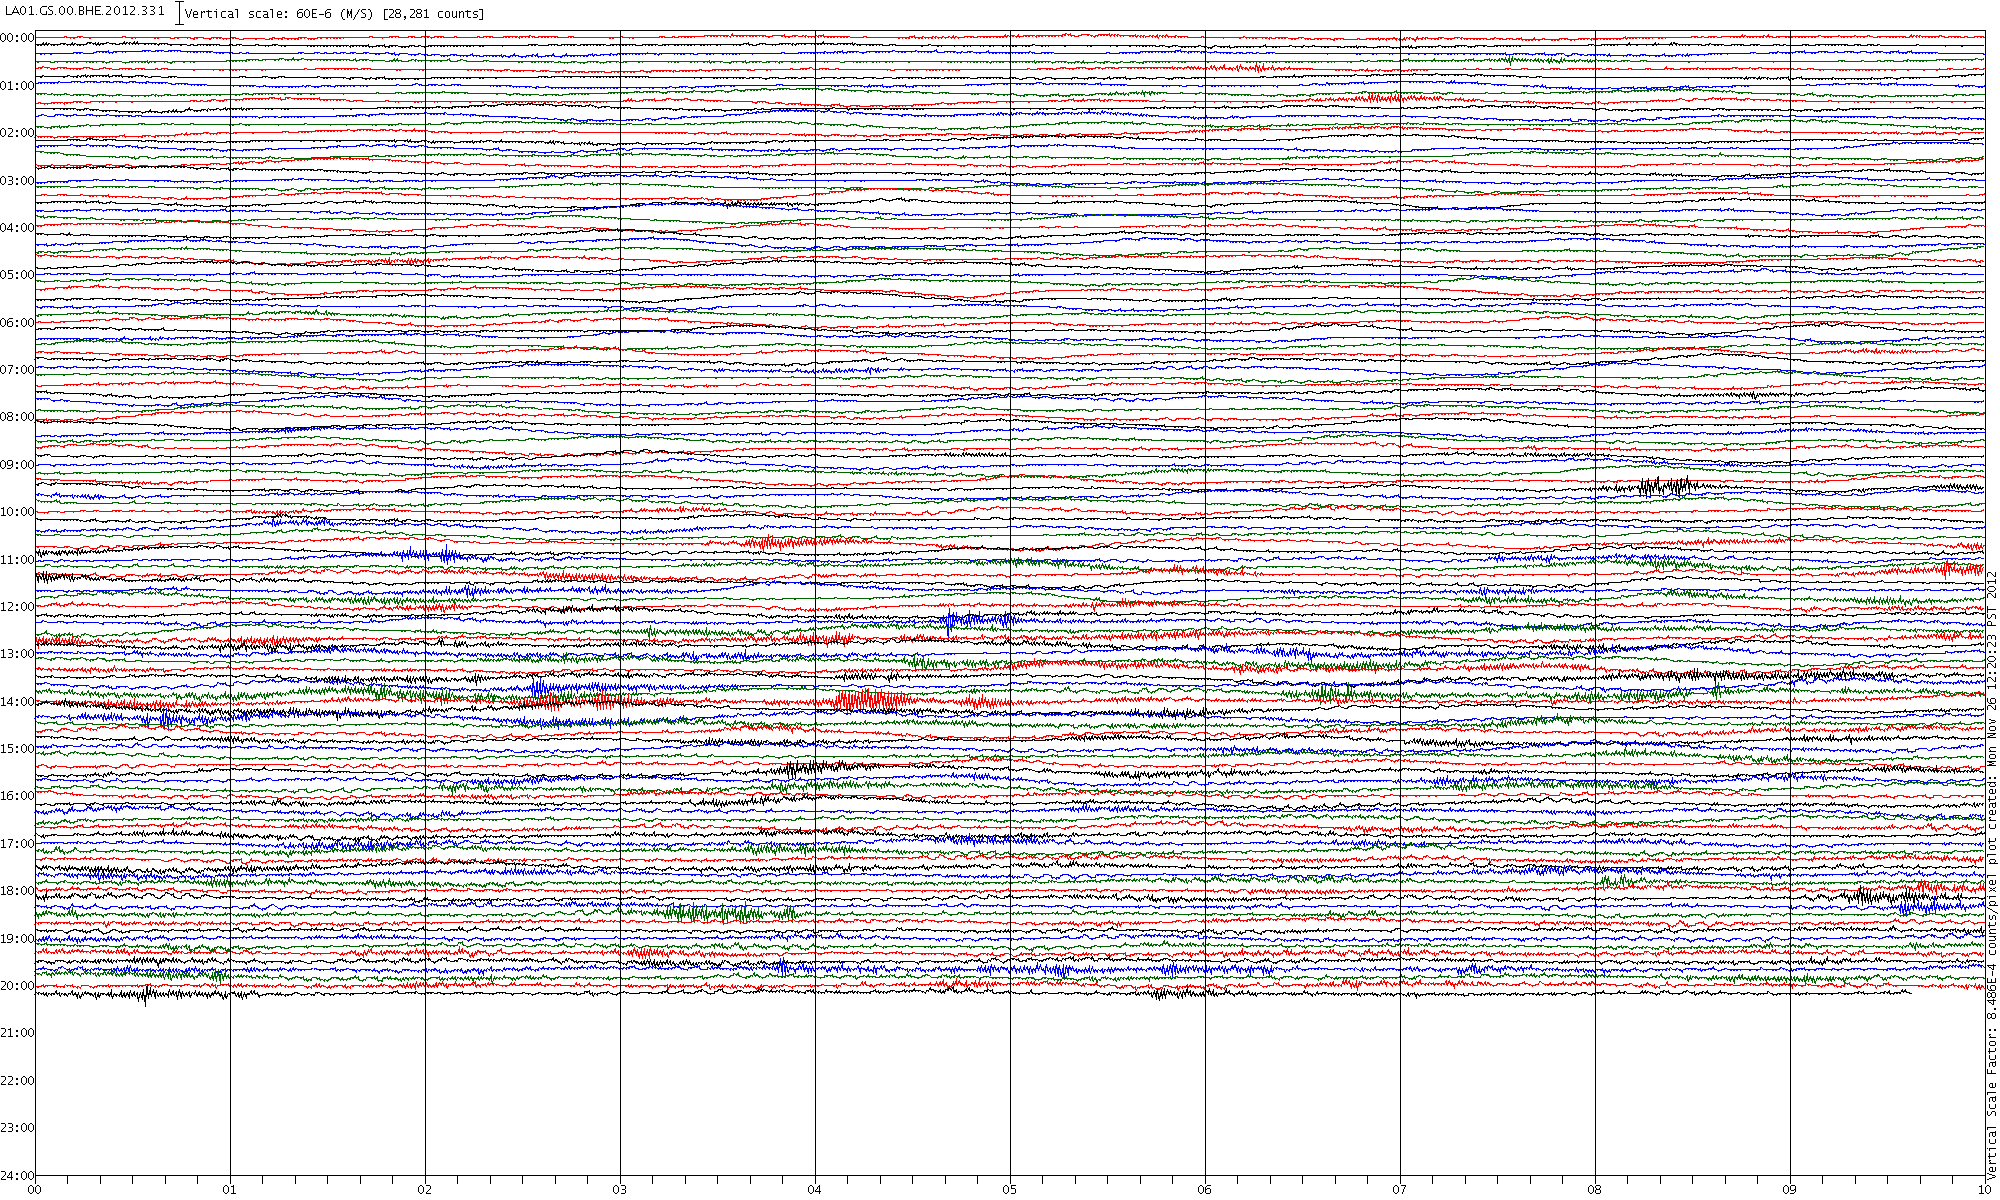
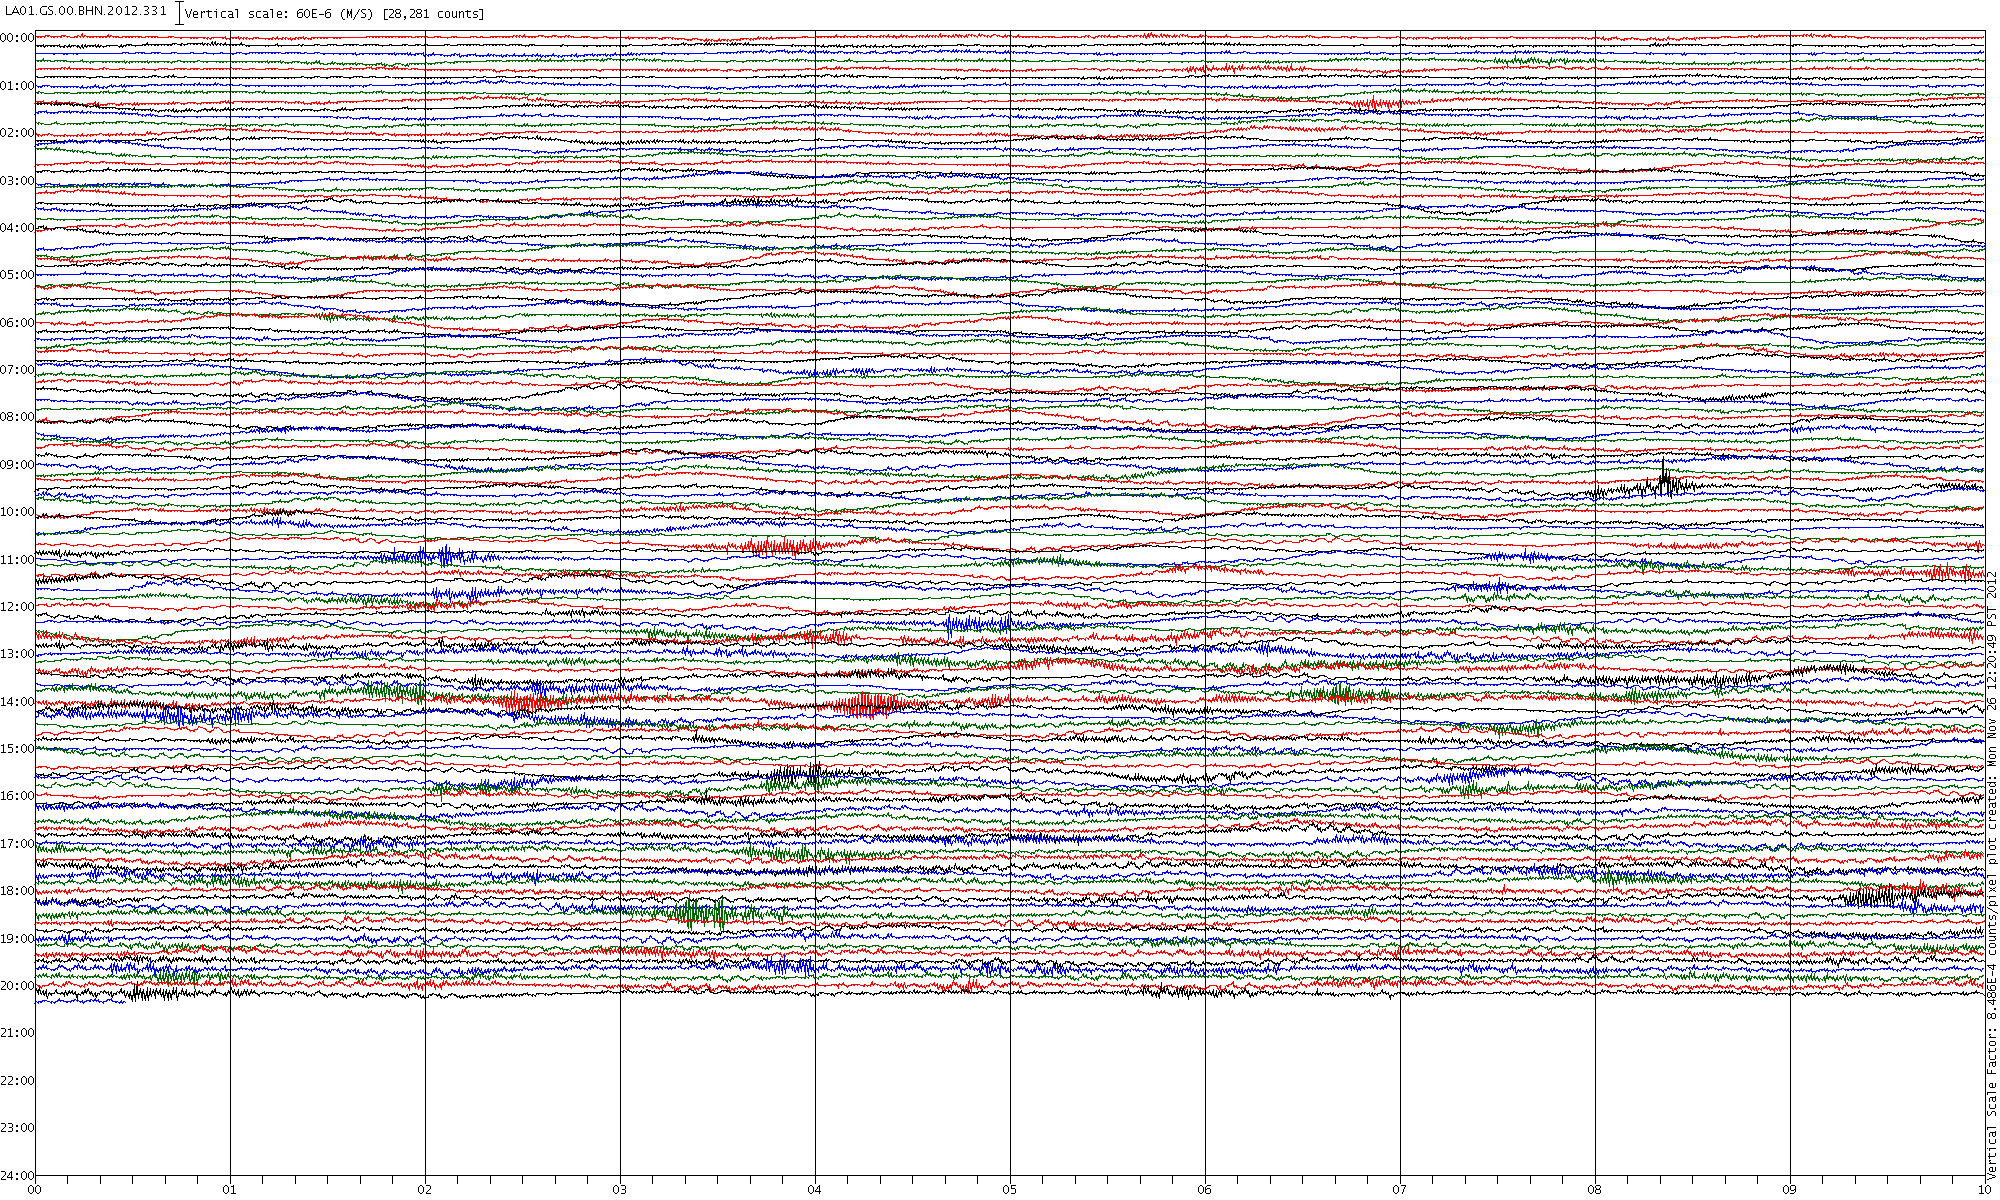
Notice that the East and North are not nearly as heavy traces as the vertical? This also shows this is not an earthquake. The traffic makes the road bounce up and down but little sideways movement.
reply to post by PuterMan
I initially thought traffic noise myself but didn't want to say anything as my knowledge level of looking at these is very rudimentary. I am learning though, with help from folks like yourself and the other quaketards over in QW.
I see that you've scaled your plots to 60E-6 (M/S), and if I remember my scientific notation that would be .000006 meters per second of acceleration (or did I miss a zero?) which would be a very tiny amount of motion (even tinier if I missed a zero) to consider.
10:00 UTC would translate to 5:00 am local time, which is about right for early risers.
edit on 26-11-2012 by jadedANDcynical because:
Grammatical and autocorrect corrections; I'm on my iPhone...
I wonder how the type of soil conditions there effect vibrations from passing traffic.
new topics
-
Hamas and Other Islamist Terrorist Groups Announce Support of US Campus Anti-Israel Protests
Education and Media: 51 minutes ago -
Psychotronic Operation Rwanda Who Wants To Be A Refugee?
ATS Skunk Works: 1 hours ago -
AI phrenology
Science & Technology: 8 hours ago
top topics
-
4/27/24 New Jersey Earthquake
Fragile Earth: 13 hours ago, 8 flags -
CIA is alleged to be operat social media troll frms in Kyiv
ATS Skunk Works: 16 hours ago, 6 flags -
AI phrenology
Science & Technology: 8 hours ago, 4 flags -
Fun with extreme paints
Interesting Websites: 15 hours ago, 2 flags -
Psychotronic Operation Rwanda Who Wants To Be A Refugee?
ATS Skunk Works: 1 hours ago, 2 flags -
Hamas and Other Islamist Terrorist Groups Announce Support of US Campus Anti-Israel Protests
Education and Media: 51 minutes ago, 2 flags -
Rainbow : Stargazer
Music: 17 hours ago, 1 flags
active topics
-
Senator Ron Johnson Interview - PART 1: Mishandling Pandemic To What Ends?
Diseases and Pandemics • 5 • : PrivateAngel -
Hamas and Other Islamist Terrorist Groups Announce Support of US Campus Anti-Israel Protests
Education and Media • 3 • : Hakaiju -
Why Files Our Alien Overlords | How We Secretly Serve The Tall Whites
Aliens and UFOs • 18 • : TheValeyard -
Supreme Court Oral Arguments 4.25.2024 - Are PRESIDENTS IMMUNE From Later Being Prosecuted.
Above Politics • 123 • : xuenchen -
Biden Banning Menthol Cigarettes - Good Health Move or Government Overreach?
US Political Madness • 92 • : FlyersFan -
Psychotronic Operation Rwanda Who Wants To Be A Refugee?
ATS Skunk Works • 1 • : TimBurr -
So this is what Hamas considers 'freedom fighting' ...
War On Terrorism • 278 • : FlyersFan -
Killings of Palestinian children are soaring in the West Bank.
World War Three • 162 • : FlyersFan -
Ireland VS Globalists
Social Issues and Civil Unrest • 16 • : TimBurr -
University of Texas Instantly Shuts Down Anti Israel Protests
Education and Media • 383 • : FlyersFan