It looks like you're using an Ad Blocker.
Please white-list or disable AboveTopSecret.com in your ad-blocking tool.
Thank you.
Some features of ATS will be disabled while you continue to use an ad-blocker.

Raw data predictes high probabiity of Glaciation
page: 3share:
These examples illustrate that different climate changes in the past had different causes. The fact that natural factors caused climate changes in the past does not mean that the current climate change is natural. By analogy, the fact that forest fires have long been caused naturally by lightning strikes does not mean that fires cannot also be caused by a careless camper.
oceanservice.noaa.gov...
Just getting started actually
a reply to: D8Tee
I think the governments know what's going to happen and cant do anything about it. So ignore it, so we might have a few good years. The problem will be the Earthquakes stuffing up nuclear power plants, now everyone relies on electric heating, we might be seeing mass deaths..
I think the governments know what's going to happen and cant do anything about it. So ignore it, so we might have a few good years. The problem will be the Earthquakes stuffing up nuclear power plants, now everyone relies on electric heating, we might be seeing mass deaths..
a reply to: anonentity
Actually if GM occurs we might be seeing something equivalent to the French revolution upon a world wide scale.
Actually if GM occurs we might be seeing something equivalent to the French revolution upon a world wide scale.
edit on 29-5-2017 by Kashai because: Content edit
a reply to: Kashai
Well we have two Governments putting out warnings, Russia and Pakistan,
China is already taking precautions, with regards to growing crops in Africa.
What is happening to the atmosphere on the outer planets, also coincides with the change in the Suns output. Recently the Coronal holes, are putting out more cosmic rays which when they hit the atmosphere, it forms more nuclei for cloud formation ,which will cause clouds to form and reflect more solar heat.
edit on 29-5-2017 by anonentity because: (no reason given)
originally posted by: D8Tee
NO, you are confused, read again what the IPCC has stated, your reference to Non-Linear technology is baffling, where did you pull that from? There is no need for interpretation, it's quite straightforward.
originally posted by: Kashai
a reply to: D8Tee
By that you mean Chaos theory and access to Non-Linear technology
The climate system is a coupled non-linear chaotic system, and therefore the long-term prediction of future climate states is not possible.
By "non-linear chaotic system" they are referring to Chaos theory...
The Earth's climate: a non-linear dynamical system
What is a dynamical system?
Dynamics is the branch of mechanics that is concerned with the effects of forces on the motion of objects (from Wikipedia). More generally, it could be defined as the study of changes, therefore applying to anything that does not stay constant. This is virtually everything. Climate is one such example.
What does non-linear mean?
Even if you ignore everything about quantum physics and relativity, you probably know that the world is more complicated than even quirky physicists would like it to be. In fact, "complex" behavior (what quirky physicists call "interesting") can occur in systems than follow the deceitfully simple laws of classical mechanics, which have been set out in 1687 by Isaac Newton.
In mechanical systems, such as the ocean and the atmosphere, the richness of behavior stems from a mathematical property called nonlinearity, which can lead to chaos. Essentially, a linear system is one where doubling the perturbation doubles the response. For example, if I have spring and I pull on it slightly (a small distance x on the figure below), it will undergo oscillations that are nice and regular.
This model is extremely famous and it explained is great detail in many places ( here for pretty pictures, here for an illuminating tutorial, or here again). It was set out by Edward Lorenz, and MIT meteorologist, in a pioneering paper called "Deterministic non-periodic flow" (1963), more commonly known by its nickname, the Butterfly effect.
Lorenz's model is a very simplified model of atmospheric convection, which is a system where temperature and fluid motion interact very non-linearly: one feedbacks on the other. If the system is described by 3 variables W, T1 and T2 (see here for what they mean), then for a sufficiently high parameter (named the Rayleigh number), the system exhibits oscillations that are not periodic, hence hard to predict.
ocp.ldeo.columbia.edu...
And you do not know anything about that huh
edit on 30-5-2017 by Kashai because: Content edit

(post by Kashai removed for a manners violation)
a reply to: D8Tee
The point I am making is that you cannot possibly know what you talking about if you do not understand how Chaos Theory relates to predicting Weather and Climate.
www.cmp.caltech.edu...
Seriously, if you knew what you talking about you would know about this.
The point I am making is that you cannot possibly know what you talking about if you do not understand how Chaos Theory relates to predicting Weather and Climate.
1.1 Introduction
Lorenz was interested in the predictability of the solutions to hydrodynamics equations. He was a meteorologist studying weather forecasting—and the question of the fundamental limitations to this endeavor. The model he introduced [1] can be thought of as a gross simplification of one feature of the atmosphere, namely the fluid motion driven by thermal buoyancy known as convection, although his originalpaperseemstousethemodelsimplyasasetofequations“whosesolutions afford the simplest example of a deterministic nonperiodic flow of which the writer is aware”.
www.cmp.caltech.edu...
Seriously, if you knew what you talking about you would know about this.
ATTENTION!!!!
Some reminders:
Quit bickering......Go After the Ball, Not the Player!
You are responsible for your own posts.
IMPORTANT: Using Content From Other Websites on ATS
MOD NOTE: Posting work written by others
and, as always:
Do NOT reply to this post!!
On Wednesday night, Palmer will explain in a lecture titled, “Climate Change, Chaos and Inexact Computing,” why he believes physics can unlock the weather pattens that climate change will bring — and why chaos theory debunks the skepticism surrounding global warming. (The lecture will be broadcast live here at 7 p.m. EST).
news.nationalpost.com...
The vid of the lecture is available as the lecture already occurred.
edit on 30-5-2017 by Kashai because: Added content
a reply to: gort51
The usual suspects (Mann etal) pulbished the paper in an attempt to do away with the concept of a global medieval warming period because if that is shown to be a true story, well, whats that say for this recent climate warming we had been going thru up until 18 years ago?
Here's a couple images I pulled from their paper, notice the lack of proxy data sites, and notice on their models how there is warming near the actual proxy sites themselves. Hundreds or even thousands of miles away from these proxy sites show vast areas of cooler temps (blue), amazing how that works!
He who programs the models controls the pasts climate history it seems.
We are led to believe that with around a dozen proxy data sites, they can tell us the global temperature in 950 AD? With a 0.1 degree of accuracy?
What many people will be unwilling to accept is there is much evidence to suggest that it was indeed a global event, but the IPCC gets all the attention.
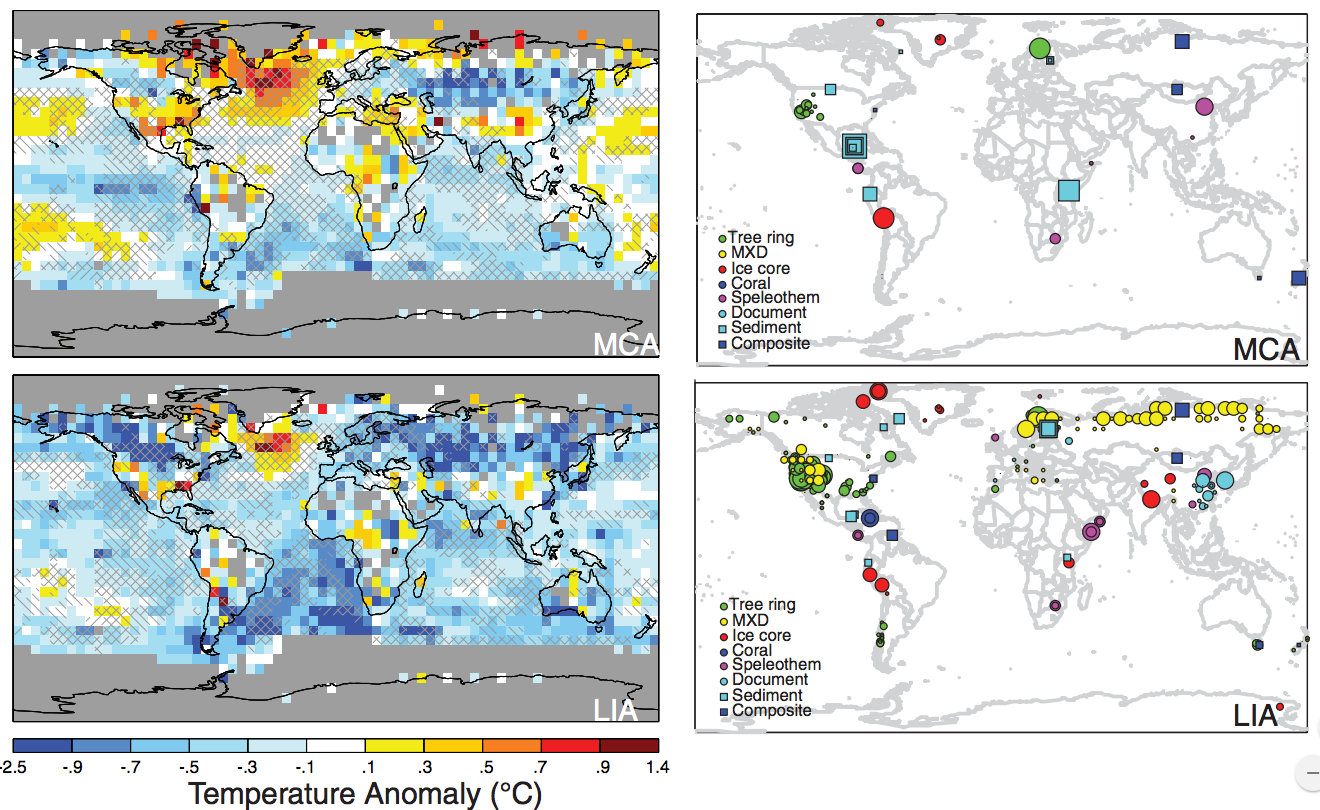
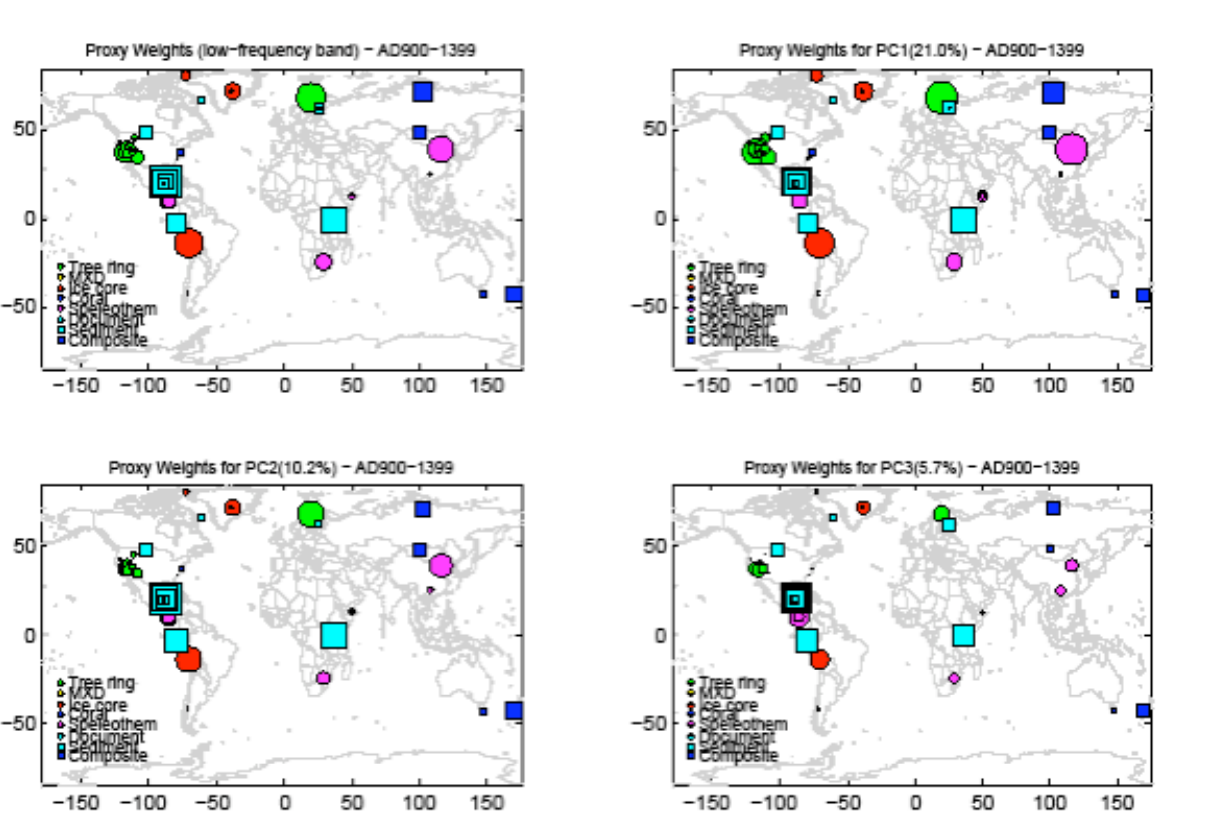
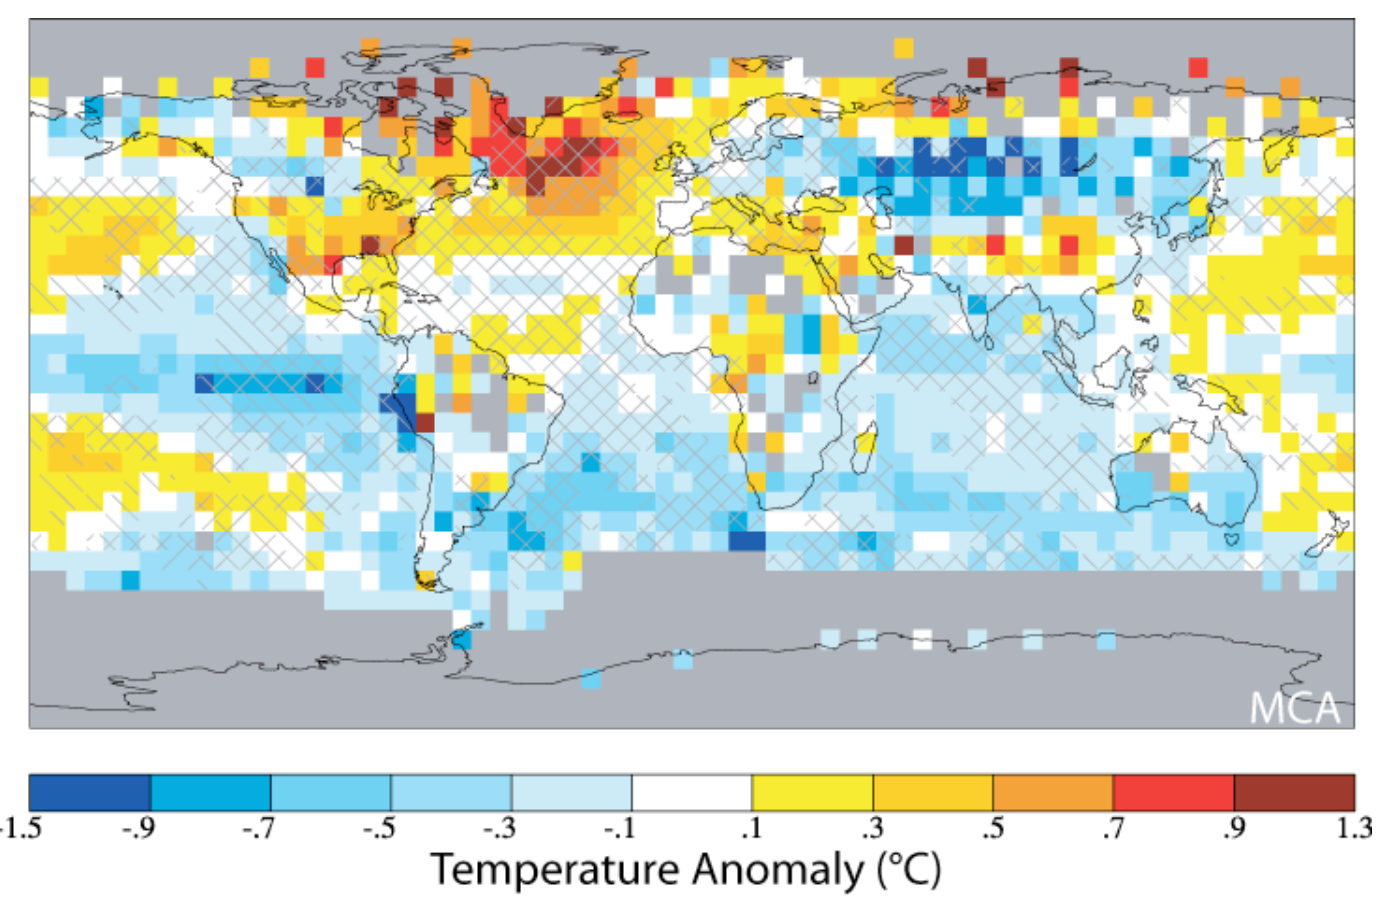
The IPCC and Michael Mann have attempted to discredit a Global Medieval Warming period, they have renamed it a Medieval Climate Anomaly and published a paper that said it was regional not global. Their paper relies on a small number of proxy data sites as evidence and has been called into question by other researchers paper and evidence of Paleo Climatology like you have mentioned, tree stumps under glaciers and so on.
I recently looked up the ethnic makeup of Finland....just out of curiosity.
Apparently, 7000 years ago, Finland was covered with forests and was much warmer than today, with little amount of ice and snow.
We know 6000 years ago much of the Sahara was a lush forest area.
We know 2000 years ago, during the Roman and civilisation expansion, there was a warming period in Europe (not sure of the rest of the World).
The usual suspects (Mann etal) pulbished the paper in an attempt to do away with the concept of a global medieval warming period because if that is shown to be a true story, well, whats that say for this recent climate warming we had been going thru up until 18 years ago?
Here's a couple images I pulled from their paper, notice the lack of proxy data sites, and notice on their models how there is warming near the actual proxy sites themselves. Hundreds or even thousands of miles away from these proxy sites show vast areas of cooler temps (blue), amazing how that works!
He who programs the models controls the pasts climate history it seems.
We are led to believe that with around a dozen proxy data sites, they can tell us the global temperature in 950 AD? With a 0.1 degree of accuracy?
What many people will be unwilling to accept is there is much evidence to suggest that it was indeed a global event, but the IPCC gets all the attention.
edit on 30-5-2017 by D8Tee because: (no reason given)
edit on 30-5-2017 by D8Tee because: (no reason
given)
a reply to: Kashai
The problem with large climate models using ever more powerful computers is that this approach is a black box approach. First: They assume that the value for climate sensitivity is very high, despite that there is no empirical evidence from the real world that this is the case. If anything the opposite is true. The other thing that is wrong with this approach is that they ignore important weather and climate drivers linked to solar electromagnetic activity and effects from lunar cycles. Therefore, what is needed is not more powerful computer, but instead smarter computing that is based on real empirical data.
Climate change is actually “a thing”, but catastrophic climate change is like Nessie the Loch Ness Monster. Lots of reports that she exists, but never any compelling evidence.
edit on 30-5-2017 by D8Tee because: (no reason given)
originally posted by: D8Tee
a reply to: AndyMayhew
Source? Cause I've seen that April is cold....
Sorry, but this is utter rubbish. 2017 is so far the 2nd warmest year on record.
Source
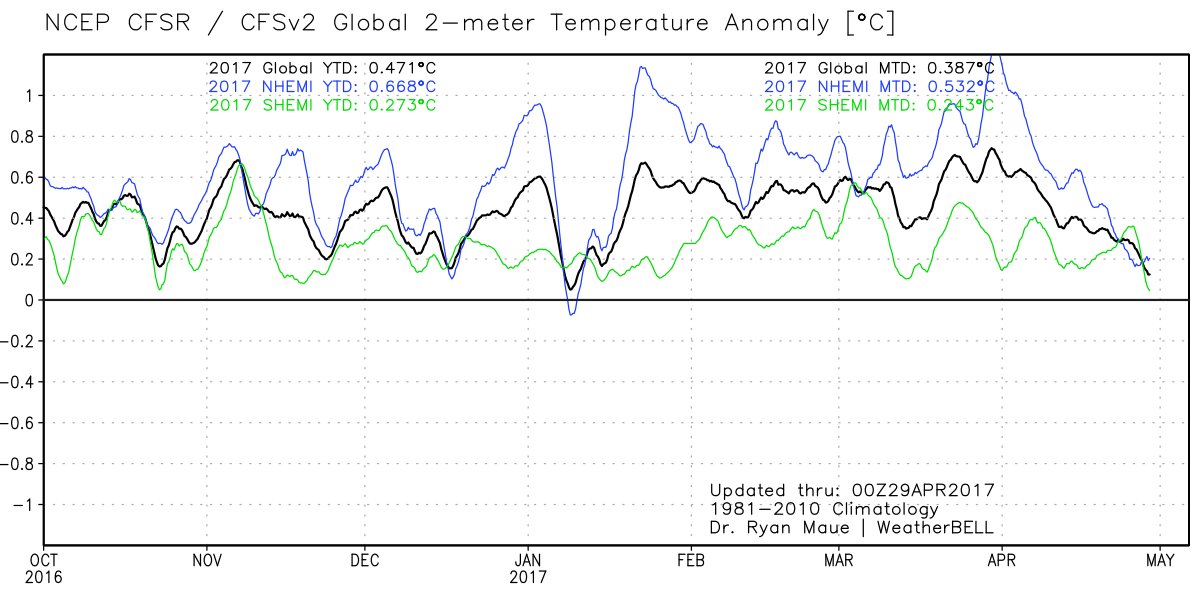
Global temperatures have dropped 0.5° Celsius in April according to Dr. Ryan Maue. In the Northern Hemisphere they plunged a massive 1°C . As the record 2015/16 El Nino levels off, the global warming hiatus aka “the pause” is back with a vengeance.
NOAA
Globe had 2nd warmest April and year to date on record
edit on 31-5-2017 by AndyMayhew because: (no reason given)
a reply to: AndyMayhew
And yet ... your source ... in the fine print of this report ... it says ...
Usual for NOOA ... rude headlines but you have to read the fine print.
P
And yet ... your source ... in the fine print of this report ... it says ...
Africa had its 4th warmest April on record; Asia, its 8th; North America tied for its 10th; South America, its 12th; Europe, its 36th; and Oceania tied for its 40th.
Usual for NOOA ... rude headlines but you have to read the fine print.
P
a reply to: AndyMayhew
What dataset did NOAA chose to use for that weblink you provided?
I hate those NOAA frontpages, they don't even label their charts and graphs correctly or tell you what datasets they are using.
They are as good as useless.
This chart is the NOAA NCEP CFSR CFSv2 dataset.
Global temperatures have dropped 0.5° Celsius in April.In the Northern Hemisphere they plunged a full degree °C . As the record 2015/16 El Nino levels off, the global warming hiatus aka “the pause” is back. May numbers should be out soon.
edit on 31-5-2017 by D8Tee because: (no reason given)
Was just arguing with a "global warming" zombie about this the other day. The data shows we are in for a cold one.
Great thread !
Don't know if it's helpful but here is a thread a I did
from a ways back about this very subject .
www.abovetopsecret.com...
Don't know if it's helpful but here is a thread a I did
from a ways back about this very subject .
www.abovetopsecret.com...
new topics
-
More Bad News for Labour and Rachel Reeves Stole Christmas from Working Families
Regional Politics: 1 hours ago -
Light from Space Might Be Travelling Instantaneously
Space Exploration: 3 hours ago -
The MSM has the United Healthcare assassin all wrong.
General Conspiracies: 4 hours ago -
2025 Bingo Card
The Gray Area: 4 hours ago -
The Mystery Drones and Government Lies
Political Conspiracies: 6 hours ago
top topics
-
Pelosi injured in Luxembourg
Other Current Events: 13 hours ago, 18 flags -
The Mystery Drones and Government Lies
Political Conspiracies: 6 hours ago, 9 flags -
Nov 2024 - Former President Barack Hussein Obama Has Lost His Aura.
US Political Madness: 14 hours ago, 7 flags -
2025 Bingo Card
The Gray Area: 4 hours ago, 5 flags -
The MSM has the United Healthcare assassin all wrong.
General Conspiracies: 4 hours ago, 5 flags -
More Bad News for Labour and Rachel Reeves Stole Christmas from Working Families
Regional Politics: 1 hours ago, 5 flags -
Light from Space Might Be Travelling Instantaneously
Space Exploration: 3 hours ago, 3 flags
active topics
-
The Mystery Drones and Government Lies
Political Conspiracies • 31 • : Zaphod58 -
Something better
Dissecting Disinformation • 21 • : AgarthaSeed -
More Bad News for Labour and Rachel Reeves Stole Christmas from Working Families
Regional Politics • 2 • : Bluntone22 -
The MSM has the United Healthcare assassin all wrong.
General Conspiracies • 7 • : MauiWaui -
I See a Different Attitude This Time Around with Congress
US Political Madness • 30 • : Xtrozero -
Pelosi injured in Luxembourg
Other Current Events • 25 • : WeMustCare -
Light from Space Might Be Travelling Instantaneously
Space Exploration • 14 • : CosmicFocus -
2025 Bingo Card
The Gray Area • 9 • : MauiWaui -
Statements of Intent from Incoming Trump Administration Members - 2025 to 2029.
2024 Elections • 43 • : WeMustCare -
-@TH3WH17ERABB17- -Q- ---TIME TO SHOW THE WORLD--- -Part- --44--
Dissecting Disinformation • 3676 • : duncanagain