It looks like you're using an Ad Blocker.
Please white-list or disable AboveTopSecret.com in your ad-blocking tool.
Thank you.
Some features of ATS will be disabled while you continue to use an ad-blocker.

Senator Barbara Boxer's Own Experts Contradict Obama On Global Warming
page: 5share:
reply to post by Kali74
Cant say that group hasn't owned a Monopoly either. But........
Both groups are dishonest. Its disheartening to see Scientists fudge their own data, to make themselves feel good, or to prove a point. Its all about Greed Kali. All we can do is try to play our part. That is recycle, use less, dont by products from certain company's.
reply to post by sonnny1
They haven't lied about their data.
I'm going to bed.
Gang up on Kali will have to resume tomorrow night, sorry.
They haven't lied about their data.
I'm going to bed.
Gang up on Kali will have to resume tomorrow night, sorry.
reply to post by Kali74
Sorry Kali.
I hope you dont feel I was ganging up on you.
There is an Agenda at Work. One that has MONEY to be made. That is the truth of it all.
G'Night.
Sorry Kali.
I hope you dont feel I was ganging up on you.
There is an Agenda at Work. One that has MONEY to be made. That is the truth of it all.
G'Night.
Originally posted by Kali74
I don't need you to tell me because I already know, I've done a lot of research on the subject. The last time Co2 levels were this high was during the Pliocene 2-6 million years ago. Before Humans existed.
Really, I really doubt you have done extensive research on the subject. Did you know that for the majority of Earth's existence atmospheric levels of CO2 were much higher than now?...
Who decides what "perfect level of atmospheric CO2 should exist on Earth"?... You?... the liars Mann, Jones, Hansen et al?...
Originally posted by Kali74
Nope they didn't, they involved the Milankovitch cycle and where the planet was in it, currently our orbital position and tilt should have us in a cooler cycle. Climate change in the past has also been due to changes in solar output, during higher output times it's sparked release of GHG's stored in the surface, also not the case this time. The sun has been in a cooler cycle for the past 35 years.
Yet there are literally at least a half dozen other factors which control the Earth's climate and which have been occurring throughout the ongoing Climate Change...
We have been over this dozens of times, and you were involved in many of those discussions, yet you continue wanting to deny the evidence provided which shows YOU ARE WRONG...
First, the Earth's magnetic field fluctuations are now weaker than it has been for over 400,000-700,000 years... This has a profound effect on the Earth's climate, but naa, it can't be because Kali74 and the liars like Mann, Jones et al say so...
[atsimg]http://files.abovetopsecret.com/images/member/750fc3934f0e.jpg[/atsimg]
Magnetic Field Weakening in Stages, Old Ships' Logs Suggest
John Roach
for National Geographic News
May 11, 2006
Earth's magnetic field is weakening in staggered steps, a new analysis of centuries-old ships logs suggests.
The finding could help scientists better understand the way Earth's magnetic poles reverse.
The planet's magnetic field flips—north becomes south and vice versa—on average every 300,000 years. However, the actual time between reversals varies widely.
The field last flipped about 800,000 years ago, according to the geologic record.
Since 1840, when accurate measures of the intensity were first made, the field strength has declined by about 5 percent per century.
news.nationalgeographic.com...
Not only has Earth's magnetic field been weakening, but large breaches of Earth's magnetic field have also been observed.
A Giant Breach in Earth's Magnetic Field
12.16.2008
Dec. 16, 2008: NASAs five THEMIS spacecraft have discovered a breach in Earths magnetic field ten times larger than anything previously thought to exist. Solar wind can flow in through the opening to "load up" the magnetosphere for powerful geomagnetic storms. But the breach itself is not the biggest surprise. Researchers are even more amazed at the strange and unexpected way it forms, overturning long-held ideas of space physics.
"At first I didn't believe it," says THEMIS project scientist David Sibeck of the Goddard Space Flight Center. "This finding fundamentally alters our understanding of the solar wind-magnetosphere interaction."
........
science.nasa.gov...
We know that the Solar System has been encountering parts of a different region of the Local Fluff, which also do have an effect on Earth's climate, and the climate of the other planets and even moons with an atmosphere...
It has gotten to the point that radiation levels have had reached recently a record high which hasn't been seen at least since mankind began exploring space.
Like a wounded Starship Enterprise, our solar system's natural shields are faltering, letting in a flood of cosmic rays. The sun's recent listlessness is resulting in record-high radiation levels that pose a hazard to both human and robotic space missions.
Galactic cosmic rays are speeding charged particles that include protons and heavier atomic nuclei. They come from outside the solar system, though their exact sources are still being debated.
www.newscientist.com...
Not only has space radiation reached an all time high for at least as long as we have been studying space weather, but the amount of interstellar dust entering the Solar System, and Earth, has also been increasing exponentially.
Then there are the other anomalies occurring in the Solar System and which were discovered recently.
Anomalies in the Solar System
Dittus, Hansjoerg
37th COSPAR Scientific Assembly. Held 13-20 July 2008, in Montréal, Canada., p.717
Several observations show unexplained phenomena in our solar system. These observations are e.g. the Pioneer Anomaly, an unexplained constant acceleration of the Pioneer 10 and 11 spacecraft, the Flyby Anomaly, an unexplained increase of the velocity of a series of spacecraft after Earth gravity assists, the recently reported increase of the Astronomical Unit defined by the distance of the planets from the Sun by approximately 10 m per century, the quadrupole and octupole anomaly which describes the correlation of the low l contributions of the Cosmic Microwave Background to the orientation of the Solar system. Lacking any explanation until now, these phenomena are still investigated intensively. In my talk I will discuss the present status of those investigations and the attempts to find reasonable explantions.
adsabs.harvard.edu...
Secular increase of the astronomical unit and perihelion precessions as tests of the Dvali–Gabadadze–Porrati multi-dimensional braneworld scenario
Lorenzo Iorio JCAP09(2005)006 doi: 10.1088/1475-7516/2005/09/006
PDF (313 KB) | HTML | References | Articles citing this article
Lorenzo Iorio
Viale Unità di Italia 68, 70125, Bari, Italy
E-mail: [email protected]
Abstract. An unexpected secular increase of the astronomical unit, the length scale of the Solar System, has recently been reported by three different research groups (Krasinsky and Brumberg, Pitjeva, Standish). The latest JPL measurements amount to 7 ± 2 m cy−1. At present, there are no explanations able to accommodate such an observed phenomenon, either in the realm of classical physics or in the usual four-dimensional framework of the Einsteinian general relativity. The Dvali–Gabadadze–Porrati braneworld scenario, which is a multi-dimensional model of gravity aimed at providing an explanation of the observed cosmic acceleration without dark energy, predicts, among other things, a perihelion secular shift, due to Lue and Starkman, of 5 × 10⁻⁴ arcsec cy−1 for all the planets of the Solar System. It yields a variation of about 6 m cy−1 for the Earth–Sun distance which is compatible with the observed rate of change for the astronomical unit. The recently measured corrections to the secular motions of the perihelia of the inner planets of the Solar System are in agreement with the predicted value of the Lue–Starkman effect for Mercury, Mars and, at a slightly worse level, the Earth.
www.iop.org...
Then, let's not forget, the fact that despite the lies from the AGW, which you seem to buy, NASA's ACRIM principal investigator Wilson discovered that during the 24 year period he studied the variations of the TSI (Total Solar Irradiance) for the period of 1978-2002 the TSI at times of quiet sunspot activity has been continuously increasing.
March 20, 2003 - (date of web publication)
NASA STUDY FINDS INCREASING SOLAR TREND THAT CAN CHANGE CLIMATE
Since the late 1970s, the amount of solar radiation the sun emits, during times of quiet sunspot activity, has increased by nearly .05 percent per decade, according to a NASA funded study.
"This trend is important because, if sustained over many decades, it could cause significant climate change," said Richard Willson, a researcher affiliated with NASA's Goddard Institute for Space Studies and Columbia University's Earth Institute, New York. He is the lead author of the study recently published in Geophysical Research Letters.
"Historical records of solar activity indicate that solar radiation has been increasing since the late 19th century. If a trend, comparable to the one found in this study, persisted throughout the 20th century, it would have provided a significant component of the global warming the Intergovernmental Panel on Climate Change reports to have occurred over the past 100 years," he said.
...
Willson found errors in previous satellite data that had obscured the trend. The new analysis, Willson says, should put an end to a debate in the field over whether solar irradiance variability can play a significant role in climate change.
...
In this study, Willson, who is also Principal Investigator of the ACRIM experiments, compiled a TSI record of over 24 years by carefully piecing together the overlapping records. In order to construct a long-term dataset, Willson needed to bridge a two-year gap (1989-1991) between ACRIM1 and ACRIM2. Both the Nimbus7/ERB and ERBS measurements overlapped the ACRIM ‘gap.’ Using Nimbus7/ERB results produced a 0.05 percent per decade upward trend between solar minima, while ERBS results produced no trend. Until this study, the cause of this difference, and hence the validity of the TSI trend, was uncertain. Now, Willson has identified specific errors in the ERBS data responsible for the difference. The accurate long-term dataset therefore shows a significant positive trend (.05 percent per decade) in TSI between the solar minima of solar cycles 21 to 23 (1978 to present).
...
www.nasa.gov...
But despite all these facts, people like "kali74" want to dismiss or ignore these facts, and instead want to blame it all on CO2, a gas which the Earth's geological record shows to have no real noticeable effect on Earth's temperatures.
Originally posted by Kali74
By studying ice cores, tree rings and sediment cores we are able to tell what GHG levels and temperatures were during different periods or earths climate. Comparing Co2 rise in previous GHG epochs, atmospheric Co2 is increasing at a 75 times faster.
Oh, you mean like these?...
]
On-line Publication Documentation System for Stockholm University
Full DescriptionUpdate record
Publication type: Article in journal (Reviewed scientific)
Author: Grudd, H (Department of Physical Geography and Quaternary Geology)
Title: Torneträsk tree-ring width and density ad 500–2004: a test of climatic sensitivity and a new 1500-year reconstruction of north Fennoscandian summers
In: Climate Dynamics
Publisher: Springer, Berlin / Heidelberg
Volume: 31
Pages: 843-857
Year: 2008
Available: 2009-01-30
ISSN: 1432-0894
Department: Department of Physical Geography and Quaternary Geology
Language: English [en]
Subject: Physical geography, Climatology
Abstract: This paper presents updated tree-ring width (TRW) and maximum density (MXD) from Torneträsk in northern Sweden, now covering the period ad 500–2004. By including data from relatively young trees for the most recent period, a previously noted decline in recent MXD is eliminated. Non-climatological growth trends in the data are removed using Regional Curve Standardization (RCS), thus producing TRW and MXD chronologies with preserved low-frequency variability. The chronologies are calibrated using local and regional instrumental climate records. A bootstrapped response function analysis using regional climate data shows that tree growth is forced by April–August temperatures and that the regression weights for MXD are much stronger than for TRW. The robustness of the reconstruction equation is verified by independent temperature data and shows that 63–64% of the instrumental inter-annual variation is captured by the tree-ring data. This is a significant improvement compared to previously published reconstructions based on tree-ring data from Torneträsk. A divergence phenomenon around ad 1800, expressed as an increase in TRW that is not paralleled by temperature and MXD, is most likely an effect of major changes in the density of the pine population at this northern tree-line site. The bias introduced by this TRW phenomenon is assessed by producing a summer temperature reconstruction based on MXD exclusively. The new data show generally higher temperature estimates than previous reconstructions based on Torneträsk tree-ring data. The late-twentieth century, however, is not exceptionally warm in the new record: On decadal-to-centennial timescales, periods around ad 750, 1000, 1400, and 1750 were equally warm, or warmer. The 200-year long warm period centered on ad 1000 was significantly warmer than the late-twentieth century (p < 0.05) and is supported by other local and regional paleoclimate data. The new tree-ring evidence from Torneträsk suggests that this “Medieval Warm Period” in northern Fennoscandia was much warmer than previously recognized.
www.diva-portal.org...
P. D. Tyson, W. Karlén, K. Holmgren and G. A. Heiss (in press) The Little Ice Age and Medieval Warming in South Africa. South African Journal of Science.
--------------------------------------------------------------------------------
The Little Ice Age and Medieval Warming in South Africa
P. D. Tyson1, W. Karlén2, K. Holmgren2 and G. A. Heiss3.
1Climatology Research Group, University of the Witwatersrand
2Department of Physical Geography, Stockholm University
3Geomar, Wischhofstr. 1-3, 24148 Kiel, Germany; present address: German Advisory Council on Global Change (WBGU), P.O. Box 120161, 27515 Bremerhaven, Germany, E-mail: [email protected]
Abstract
The Little Ice Age, from around 1300 to 1800, and medieval warming, from before 1000 to around 1300 in South Africa, are shown to be distinctive features of the regional climate of the last millennium. The proxy climate record has been constituted from oxygen and carbon isotope and colour density data obtained from a well-dated stalagmite derived from Cold Air Cave in the Makapansgat Valley.
The climate of the interior of South Africa was around 1oC cooler in the Little Ice Age and may have been over 3°C higher than at present during the extremes of the medieval warm period. It was variable throughout the millennium, but considerably more so during the warming of the eleventh to thirteenth centuries. Extreme events in the record show distinct teleconnections with similar events in other parts of the world, in both the northern and southern hemispheres. The lowest temperature events recorded during the Little Ice Age in South Africa are shown to be coeval with the Maunder and Sporer Minima in solar irradiance. The medieval warming is shown to have been coincided with the cosmogenic 10Be and 14C isotopic maxima recorded in tree rings elsewhere in the world during the Medieval Maximum in solar radiation.
www-user.uni-bremen.de...
Evidence for the existence of the medieval warm period in China
Journal Climatic Change
Publisher Springer Netherlands
ISSN 0165-0009 (Print) 1573-1480 (Online)
Issue Volume 26, Numbers 2-3 / March, 1994
DOI 10.1007/BF01092419
Pages 289-297
Subject Collection Earth and Environmental Science
SpringerLink Date Monday, February 07, 2005
Add to marked items
Add to shopping cart
Add to saved items
Permissions & Reprints
Recommend this article
PDF (509.6 KB)Free Preview
Evidence for the existence of the medieval warm period in China
De'Er Zhang1
(1) Chinese Academy of Meteorological Sciences, Baishiqiaolu No. 46, 100081 Beijing, China
Abstract The collected documentary records of the cultivation of citrus trees andBoehmeria nivea (a perennial herb) have been used to produce distribution maps of these plants for the eighth, twelfth and thirteenth centuries A.D. The northern boundary of citrus andBoehmeria nivea cultivation in the thirteenth century lay to the north of the modern distribution. During the last 1000 years, the thirteenth-century boundary was the northernmost. This indicates that this was the warmest time in that period. On the basis of knowledge of the climatic conditions required for planting these species, it can be estimated that the annual mean temperature in south Henan Province in the thirteenth century was 0.9–1.0°C higher than at present. A new set of data for the latest snowfall date in Hangzhou from A.D. 1131 to 1264 indicates that this cannot be considered a cold period, as previously believed.
www.springerlink.com...
Research from all over the world shows that there have been many times, like the Medieval, and Roman Warm periods when atmospheric CO2 content was LOWER than it is now yet temperatures were HIGHER than now...
Or...
Title:
Is the solar system entering a nearby interstellar cloud
Authors:
Vidal-Madjar, A.; Laurent, C.; Bruston, P.; Audouze, J.
Affiliation:
AA(CNRS, Laboratoire de Physique Stellaire et Planetaire, Verrieres-le-Buisson, Essonne, France), AB(CNRS, Laboratoire de Physique Stellaire et Planetaire, Verrieres-le-Buisson, Essonne, France), AC(CNRS, Laboratoire de Physique Stellaire et Planetaire, Verrieres-le-Buisson, Essonne, France), AD(Meudon Observatoire, Hauts-de-Seine; Paris XI, Universite, Orsay, Essonne, France)
Publication:
Astrophysical Journal, Part 1, vol. 223, July 15, 1978, p. 589-600. (ApJ Homepage)
Publication Date:
07/1978
Category:
Astrophysics
Origin:
STI
NASA/STI Keywords:
....................
Abstract
....................
Observational arguments in favor of such a cloud are presented, and implications of the presence of a nearby cloud are discussed, including possible changes in terrestrial climate. It is suggested that the postulated interstellar cloud should encounter the solar system at some unspecified time in the near future and might have a drastic influence on terrestrial climate in the next 10,000 years.
adsabs.harvard.edu...
We have even found out that this new region of space which the Solar System is entering is very strongly magnetized, and it is so unusual that physics would dictate such a cloud could not exist.
December 23, 2009: The solar system is passing through an interstellar cloud that physics says should not exist. In the Dec. 24th issue of Nature, a team of scientists reveal how NASAs Voyager spacecraft have solved the mystery.
science.nasa.gov...
Or what about the fact that water vapor is 10 times more of a potent ghg than CO2 molecule, by molecule, and it exists in far larger volumes than atmospheric CO2?...
...
As a greenhouse gas, water vapor is 10 times more potent than carbon dioxide and its increase is a key factor in the rising global temperatures appearing in the models.
...
www.sciencedaily.com...
As it is water vapor exists on Earth an average 1% as a trace gas, but as it gets to the Ecuator the volume of water vapor increases up to 4% as a trace gas, meanwhile atmospheric CO2 exists around 0.0036% by volume on Earth's atmosphere...
You see, the warmer the atmosphere gets, the more water vapor it can hold, so what happens NATURALLY, since 99.999% of water vapor emissions are natural, is that as a natural factor causes the Earth to warm, such as the Sun, then as the Earth's atmosphere, and oceans get warner the atmosphere can hold higher volunes of water vapor, and this causes a feedback effect.
In fact, the atmospheric layer on Earth where all surface weather/climate occurs is called the Troposphere. There is some weather that does occur in higher layers of the atmosphere, but the layer that influences surface temperatures, which includes temperatures in the oceans and land, is the Troposphere.
The Troposphere goes from the surface up to about 11 miles above Earth's surface.
In the Troposphere WATER VAPOR accounts for about 95% -98% of the greenhouse effect, meanwhile CO2 account for about 2%-5%, depending of whom you ask. Although the AGW camp have changed these figures in recent years to try to give more weight to their religion, the fact is that these figures above are the actual guesstimates.
Given the present composition of the atmosphere, the contribution to the total heating rate in the troposphere is around 5 percent from carbon dioxide and around 95 percent from water vapor.
www.eia.doe.gov...
But of course water vapor can't be blamed either, since about 99.999% of it comes from NATURAL sources...
Oceanic Influences on Recent Continental Warming
GILBERT P. COMPO
PRASHANT D. SARDESHMUKH
Climate Diagnostics Center,
Cooperative Institute for Research in Environmental Sciences,
University of Colorado, and
Physical Sciences Division, Earth System Research Laboratory,
National Oceanic and Atmospheric Administration
325 Broadway R/PSD1
Boulder CO 80305-3328
[email protected]
(303) 497-6115
(303) 497-6449
Citation:
Compo, G.P., and P.D. Sardeshmukh, 2008: Oceanic influences on recent continental warming. Climate
Dynamics, doi: 10.1007/s00382-008-0448-9.
This article is published by Springer-Verlag. This author-created version is distributed courtesy of Springer-Verlag.
The original publication is available from www.springerlink.com at
www.springerlink.com...
Abstract
Evidence is presented that the recent worldwide land warming has occurred largely in response to a worldwide warming of the oceans rather than as a direct response to increasing greenhouse gases (GHGs) over land.
Atmospheric model simulations of the last half-century with prescribed observed ocean temperature changes, but without prescribed GHG changes, account for most of the land warming. The oceanic influence has occurred through hydrodynamic-radiative teleconnections, primarily by moistening and warming the air over land and increasing the downward longwave radiation at the surface. The oceans may themselves have warmed from a combination of natural and anthropogenic influences.
www.cdc.noaa.gov...
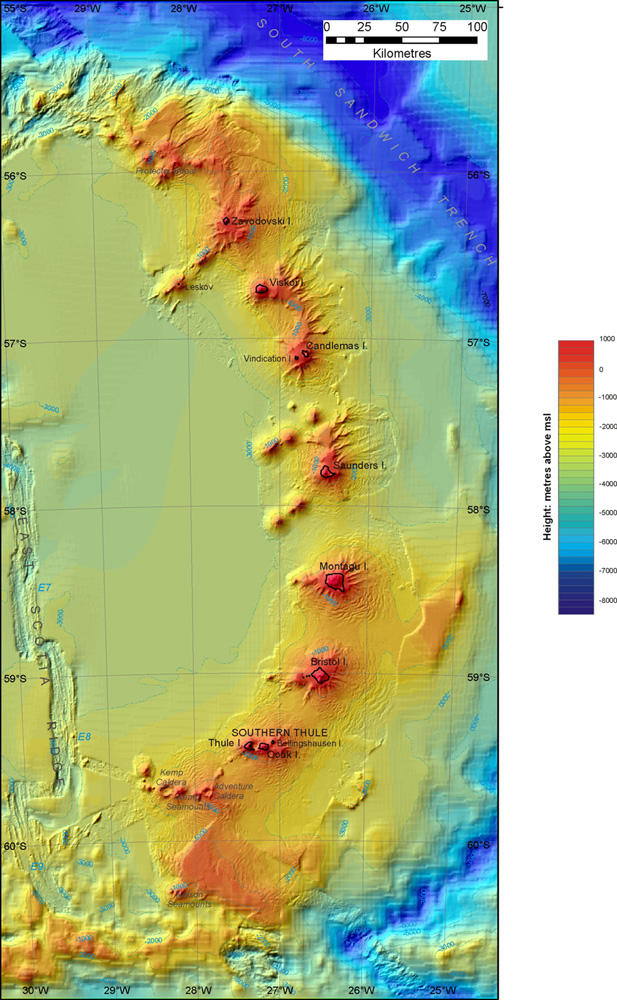
Underwater volcanoes heating Antarctic waters
Newly discovered volcanoes almost two miles tall
11 Jul 2011 - Scientists from the British Antarctic Survey (BAS) have discovered previously unknown volcanoes in the ocean waters around the remote South Sandwich Islands.
Sea-floor mapping technology reveals volcanoes beneath the sea surface
Using ship-borne sea-floor mapping technology during research cruises onboard the RRS James Clark Ross, the scientists found 12 volcanoes beneath the sea surface — some up to 3km (1.86 miles) high. They found 5km (3 mile) diameter craters left by collapsing volcanoes and 7 active volcanoes visible above the sea as a chain of islands.
According to a press release from the Proceedings of the National Academy of Sciences of the United States (PNAS), "this sub-sea landscape, with its waters warmed by volcanic activity creates a rich habitat for many species of wildlife and adds valuable new insight about life on earth." (Italics added)
The research is also important for understanding what happens when volcanoes erupt or collapse underwater and their potential for creating serious hazards such as tsunamis
Speaking at the International Symposium on Antarctic Earth Sciences in Edinburgh Dr Phil Leat from British Antarctic Survey said,
“There is so much that we don’t understand about volcanic activity beneath the sea — it’s likely that volcanoes are erupting or collapsing all the time. The technologies that scientists can now use from ships not only give us an opportunity to piece together the story of the evolution of our earth, but they also help shed new light on the development of natural events that pose hazards for people living in more populated regions on the planet.”
...
www.antarctica.ac.uk...
And guess how many underwater volcanoes, which are much bigger than those on land, are thought to exist?...
Thousand of new volcanoes revealed beneath the waves
10:04 09 July 2007 by Catherine Brahic
For similar stories, visit the Mysteries of the Deep Sea Topic Guide
The true extent to which the ocean bed is dotted with volcanoes has been revealed by researchers who have counted 201,055 underwater cones. This is over 10 times more than have been found before.
The team estimates that in total there could be about 3 million submarine volcanoes, 39,000 of which rise more than 1000 metres over the sea bed.
"The distribution of underwater volcanoes tells us something about what is happening in the centre of the Earth," says John Hillier of the University of Cambridge in the UK. That is because they give information about the flows of hot rock in the mantle beneath. "But the problem is that we cannot see through the water to count them," he says.
Satellites can detect volcanoes that are more than 1500 m high because the mass of the submerged mountains causes gravity to pull the water in around them. This creates domes on the ocean's surface that can be several metres high and can be detected from space.
...
www.newscientist.com...
But, these can't be heating parts of the Arctic and Antarctic, or can't be part of the cause of the acidification of the oceans alongside other factors which have nothing to do with CO2... According to kali74 and Mann, Jones et al of course...
Here is a photo where you can see some of the underwater volcanoes at the edges of Antarctica and around the world.
But it is not like not only are these factors affecting Earth's climate, but also other activity on Earth such as.
Solar activity as a triggering mechanism for earthquakes
John F. Simpsona, b
a Goodyear Aerospace Corporation, USA
b University of Akron, Akron, Ohio, USA
Received 7 November 1967; revised 16 December 1967. Available online 28 October 2002.
Abstract
Solar activity, as indicated by sunspots, radio noise and geomagnetic indices, plays a significant but by no means exclusive role in the triggering of earthquakes. Maximum quake frequency occurs at times of moderately high and fluctuating solar activity. Terrestrial solar flare effects which are the actual coupling mechanisms which trigger quakes appear to be either abrupt accelerations in the earth's angular velocity or surges of telluric currents in the earth's crust. The graphs presented in this paper permit probabilistic forecasting of earthquakes, and when used in conjunction with local indicators may provide a significant tool for specific earthquake prediction.
linkinghub.elsevier.com...
Annales Geophysicae (2003) 21: 597–602
c European Geosciences Union 2003
High-energy charged particle bursts in the near-Earth space as
earthquake precursors
S. Yu. Aleksandrin1, A. M. Galper1, L. A. Grishantzeva1, S. V. Koldashov1, L. V. Maslennikov1, A.M. Murashov1,
P. Picozza2, V. Sgrigna3, and S. A. Voronov1
1Space Physics Institute, Moscow State Engineering Physics Institute, Kashirskoe shosse 31, 115409 Moscow, Russia
2Dept. of Physics, Univ. of Rome ”Tor Vergata” and INFN Sez. Rome2, via della Ricerca Scientifica 1, I–00133 Rome, Italy
3Dept. of Physics, Univ. of Rome ”Roma Tre”, via della Vasca Navale, 84, I–00146 Rome, Italy
Received: 21 July 2001 – Revised: 21 May 2002 – Accepted: 11 July 2002
Abstract. The experimental data on high-energy charged
particle fluxes, obtained in various near-Earth space experiments
(MIR orbital station, METEOR-3, GAMMA and
SAMPEX satellites) were processed and analyzed with the
goal to search for particle bursts. Particle bursts have been selected
in every experiment considered. It was shown that the
significant part of high-energy charged particle bursts correlates with seismic activity. Moreover, the particle bursts are observed several hours before strong earthquakes; L-shells of particle bursts and corresponding earthquakes are practically the same. Some features of a seismo-magnetosphere connection model, based on the interaction of electromagnetic emission of seismic origin and radiation belt particles, were considered.
Key words. Ionospheric physics (energetic particles,
trapped; energetic particles, precipitating; magnetosphereionosphere
interactions)
hal.archives-ouvertes.fr...
Originally posted by Kali74
Care to show us how that fudge factoring is being done?
Read above excerpts and links...
Originally posted by Kali74
That's exactly how we can determine the effect we have had on the climate. By looking to earth's past we can determine what caused climate changes in previous epochs. We know that climate is changing now and has been since the industrial revolution, so by looking to see what factors are the same and seeing that there aren't any so something must be different. We are adding more GHG's to the atmosphere that is what is different.
No... Earth's temperatures have been increasing in recent times since at least the early 1600s, WAY BEFORE the industrial revolution...
Then there are those other pesky facts I pointed above...
Originally posted by Kali74
Natural Co2 levels would be what exists within the global carbon cycle and maintains steady carbon levels, neither rising nor falling significantly. When Co2 levels rise or fall it can be from natural causes, the sun etc... but as I've said that's not the case here.
Who the heck are you to determine what levels of atmospheric CO2 should exist, and how much is "natural" for it to rise or fall?... tsk, tsk, do I note a God complex?...
Originally posted by Kali74
We are more than capable of wrecking the planet, killing it? Not short of nuclear warfare or nuclear disaster. No we are not killing the planet. What we are doing is changing the habitability for current life on earth. Most species cannot adapt or evolve fast enough to keep up with the changes. Humans are a tough call, we're very intelligent it's possible to survive the extreme temperature rise coming in the next 100-150 years. It's science, not an ideology. and just to clarify, I'm not a progressive.
Oh mankind does have an effect on local environments, and that is something we should work on remedying, but going after a BENIGN gas is not going to solve the plastic island problem in the Pacific ocean... Or will it stop the REAL toxic chemical and gases being released into rivers, lakes, oceans and the atmosphere, which have nothing to do with CO2...
Originally posted by Kali74
Sure, just not as we know it.
The Earth has gone through many changes NATURALLY, there have been extinction events, wild changes in climate and weather and people have had to ADAPT to those NATURAL changes... Tonight/this morning something NATURAL could happen that could destroy all life on the planet, yet people like you think you have the power to stop these changes...
edit on 23-7-2013 by ElectricUniverse because: add comments and links.
What bothers me about global warming/climate change regardless of cause is this:
Has global warming stopped? No - it’s just on pause, insist scientists
Now I've also seen NASA stories and other sources with credibility saying about the same thing. The problem? Oh, there is a BIG problem.
We didn't CAUSE the problem....so we sure haven't SOLVED the problem...yet the problem faded by itself. They insist it WILL be back of course, and what else can they say? Ooops? Not when entire life careers are, by now, based on this being right.
So that big problem is...if WE didn't cause an accelerated climb and then a pause in temps? Pardon my french, but what the hell DID? We need to be answering things like this before playing stupid political games with new exchanges to fleece business of money to redistribute it to needy people like Gore and others with very direct and personal interests in that side of things.
* Also, I know, some will say that we've gotten better about pollution or something and that's the key! Well, yes, the US HAS dramatically reduced it's own pollution and perhaps it really has been to a fault by how much pain it's caused to go that extra mile and force off shoring with it. However, China and India have been going like gangbusters on Coal power and other real dirty stuff. It simply means every 1 step cleaner we've gotten, they've matched it going the other way for GLOBAL effect. The trends shouldn't have changed. They HAVE changed and out of the predictions by quite a margin.
Now why? That could become a real real important question. I'd hope we have an answer before then.
Originally posted by Kali74
I don't need you to tell me because I already know, I've done a lot of research on the subject. The last time Co2 levels were this high was during the Pliocene 2-6 million years ago. Before Humans existed.
If you're only going back to the Pliocene, you're not even knocking the dust off of the top of the history of Earth. Dig deeper, and find what "natural" CO2 levels are. Another way of stating what you are saying here is that the last time CO2 dipped below the modern paucity of it, we were plunged into a series of ice ages. I don't know about you, but I personally view ice ages as a not good thing. I guess it's ok, though, just as long as Al Gore keeps getting rich off of it while the rest of us freeze solid.
I DO, however, appreciate the humor in the way you selected the time span for the data you wanted to attain the conclusion you desired, and then spun it up just right with the construction of the sentence. Masterful."The last time CO2 levels were this high..." ignoring the fact that for most of the history of the Earth, they have been much higher. In science there is a name for that sort of data selection to reach a pre-constructed conclusion, but I'm sure I don't have to tell you what it is.
Nope they didn't, they involved the Milankovitch cycle and where the planet was in it, currently our orbital position and tilt should have us in a cooler cycle. Climate change in the past has also been due to changes in solar output, during higher output times it's sparked release of GHG's stored in the surface, also not the case this time. The sun has been in a cooler cycle for the past 35 years.
Milankovitch cycles may have been a factor, or they may not have had as much influence as you'd like to think. I'm sure you are aware of the problems inherent in the theory, just as I'm sure you are aware that the cycles didn't simply go away when man entered the scene. There is no reason to assume that they WERE a factor then, but AREN'T the same factor now.
Solar output also has the curious effect of promoting plant growth, which in turn removes CO2 from the atmosphere, and releases oxygen. Probably a good thing that it releases some to let the plants live, no? That's the beauty of cycles in a self-regulating system.
By studying ice cores, tree rings and sediment cores we are able to tell what GHG levels and temperatures were during different periods or earths climate. Comparing Co2 rise in previous GHG epochs, atmospheric Co2 is increasing at a 75 times faster.
You neglected to mention leaf stomata, but yes, that is how we know what GHG levels and temperatures were - it's how we know that both are normally HIGHER than they are now, and have been throughout the history of the Earth with but two relatively short (in geological terms) exceptions.
I must confess ignorance - I have no idea what a "GHG epoch" is. Sounds like propaganda to me. I know of no geological epochs called "the GHG Epoch". Be that as it may, I don't care about the "increase rate", since it means essentially nothing.It cannot continue to increase indefinitely - there can be no CO2 released beyond what is already here stored up, so "increase rate" means nothing on the bottom line. The "emissions" are simply returning the CO2 to the atmosphere where it started out. All of the fossil fuels were created by sucking it out of the atmosphere to begin with, with sometimes disastrous results, such as the Carboniferous rain forest collapse, when it dropped to nearly modern levels, creating desertification and causing the rain forests to collapse..
Care to show us how that fudge factoring is being done?
It;s done by ignoring climate change factors much larger than man, and simply replacing them all with the word "anthropogenic", thus laying it all at man's feet - ignoring the fact that man could not have caused most of the climate changes at all, since he did not exist. It;s a shell game to make Al Gore a rich man.
That's exactly how we can determine the effect we have had on the climate. By looking to earth's past we can determine what caused climate changes in previous epochs. We know that climate is changing now and has been since the industrial revolution, so by looking to see what factors are the same and seeing that there aren't any so something must be different. We are adding more GHG's to the atmosphere that is what is different.
Interesting take. By that logic, man caused the ice ages, since they came along about the same time man arrived on the scene. Prior to that Earth was much warmer most of the time. Again, we are not ADDING ANY GHG's to the atmosphere - we are simply putting back what was there already before we started existing.
Natural Co2 levels would be what exists within the global carbon cycle and maintains steady carbon levels, neither rising nor falling significantly. When Co2 levels rise or fall it can be from natural causes, the sun etc... but as I've said that's not the case here.
I see. So then the "natural" CO2 levels created by nature before man are somehow... "unnatural". The rises and falls before man existed, regulated by nature, are likewise "unnatural". Any change in CO2 levels differing from your preferred model are "unnatural", regardless of the source of the change. So long as the levels are not steady, they are "unnatural", whether from stromatolites sucking CO2 out of the air and tying it up in carbonate rocks, vast rainforests removing it and binding it into plant matter which becomes coal, or Harvey belching it back out from the tail pipe of his SUV, all are "unnatural", because the levels are not steady.
That sort of logic makes nature itself unnatural.
We are more than capable of wrecking the planet, killing it? Not short of nuclear warfare or nuclear disaster. No we are not killing the planet. What we are doing is changing the habitability for current life on earth. Most species cannot adapt or evolve fast enough to keep up with the changes. Humans are a tough call, we're very intelligent it's possible to survive the extreme temperature rise coming in the next 100-150 years. It's science, not an ideology. and just to clarify, I'm not a progressive.
Mind if I stand back and watch, maybe drink a beer, while you wear yourself out trying to wreck an entire planet which is much larger than you, and indeed much larger than all of humanity combined? I'm sure it will be a great show. Even a full out nuclear exchange at the height of the Cold War could not have done it, much less the nukes we have left now, but nuclear effects are for a different thread.
"Habitability for current life" is ALWAYS in flux. Always has been, always will be, both before man and after. I'm sure the "extreme temperature" levels you anticipate can NOT exceed the temperature of the Carboniferous, for example, and life thrived and diversified under those conditions, with CO2 levels ranging from the modern level to nearly 4 times the modern concentration, with a mean concentration of 2.1 times the modern level. In all of geologic time, only the middle Carboniferous and the modern age have had levels of CO2 as low as they are now. Every other era of Earth had MORE CO2 than those two times, yet somehow life managed
Earth will STILL be!
Sure, just not as we know it.
You expect it to continue on unchanged from now onward? Earth has ALWAYS changed, and has never been "as we know it" other than right now. I don't expect that to continue forever, SUVs or no, GHG or no, Carbon Credits or no. It's simply that unnatural way nature has of looking after itself. lack of change is stagnation, not a good thing.
edit on 2013/7/23 by nenothtu because: (no reason given)
Oh and btw, before you go on claiming that having atmospheric CO2 levels at 1,000ppm or 1,500ppm will cause "massive die-offs" you should know that
the AVERAGE level of atmospheric CO2 levels in your house while having your AC or heater on is about 1,000ppm.
You become dizzy, have concentration problems, and start experiencing other problems because you are breathing stale air, and don't have a steady fresh supply of oxygen. And of course, people also need a steady supply of sun in their skin to process/produce and assimilate vitamins, including Vitamin D.
You become dizzy, have concentration problems, and start experiencing other problems because you are breathing stale air, and don't have a steady fresh supply of oxygen. And of course, people also need a steady supply of sun in their skin to process/produce and assimilate vitamins, including Vitamin D.
edit on 23-7-2013 by ElectricUniverse because: (no reason given)
reply to post by ElectricUniverse
Co2 levels have been both much higher and much lower. When co2 levels are higher it tends to be warmer when they are lower it tends to be colder.
Regarding your graph, Berner strongly advised against using his model to estimate Ordovician CO2 levels due its inability to account for short-term CO2 fluctuations. The Late Ordovician was also a period of mountain building. Short term variations in Co2 would have been all over the place. Nuclear models also show that the sun was dimmer during that period raising the glaciation sensitivity of Co2 to about 3,000 ppm.
The Mountains That Froze The World
If you're going to use Berners graph why not read his paper?
Link
I don't recall ever saying there aren't other factors in earths climate. I've mentioned a few already in this thread, why you pretend otherwise is beyond me. You've not shown I'm wrong and in fact much of what you claim as proof that man is not affecting climate is already disproven or there's not enough evidence for.
To be con't... I have to go to work.
Really, I really doubt you have done extensive research on the subject. Did you know that for the majority of Earth's existence atmospheric levels of CO2 were much higher than now?...
Co2 levels have been both much higher and much lower. When co2 levels are higher it tends to be warmer when they are lower it tends to be colder.
Regarding your graph, Berner strongly advised against using his model to estimate Ordovician CO2 levels due its inability to account for short-term CO2 fluctuations. The Late Ordovician was also a period of mountain building. Short term variations in Co2 would have been all over the place. Nuclear models also show that the sun was dimmer during that period raising the glaciation sensitivity of Co2 to about 3,000 ppm.
The Mountains That Froze The World
If you're going to use Berners graph why not read his paper?
Correlation of CO2 levels with estimates of palaeoclimate suggests that the atmospheric greenhouse effect has been a major factor in controlling global climate over the past 600 million years.
Link
Yet there are literally at least a half dozen other factors which control the Earth's climate and which have been occurring throughout the ongoing Climate Change... We have been over this dozens of times, and you were involved in many of those discussions, yet you continue wanting to deny the evidence provided which shows YOU ARE WRONG...
I don't recall ever saying there aren't other factors in earths climate. I've mentioned a few already in this thread, why you pretend otherwise is beyond me. You've not shown I'm wrong and in fact much of what you claim as proof that man is not affecting climate is already disproven or there's not enough evidence for.
To be con't... I have to go to work.
Originally posted by Kali74
Co2 levels have been both much higher and much lower. When co2 levels are higher it tends to be warmer when they are lower it tends to be colder.
Wrong, throughout the geological record of Earth there have been many times when atmospheric CO2 levels were much higher than now and it was COLDER, as well as there have been times when atmospheric CO2 was low and similar to how it is now and it was HOTTER.
Atmospheric CO2 level changes LAG temperature changes, not to mention that people like you keep forgetting, and even ignoring the fact that water vapor is 10 times more potent than CO2 molecule by molecule and it exists at much higher levels than CO2.
Originally posted by Kali74
Regarding your graph, Berner strongly advised against using his model to estimate Ordovician CO2 levels due its inability to account for short-term CO2 fluctuations. The Late Ordovician was also a period of mountain building. Short term variations in Co2 would have been all over the place. Nuclear models also show that the sun was dimmer during that period raising the glaciation sensitivity of Co2 to about 3,000 ppm.
And here I thought that "CO2 is more important than the Sun"... At least that's what AGW proponents have been claiming...
Anyway, as for the graph yes there are fluctuations that are missing but on overall you can see that there is no evidence of the causality claimed by the AGW camp that CO2 causes massive warming.
Originally posted by Kali74
If you're going to use Berners graph why not read his paper?
If you are going to use Berner's quotes you need to understand what he is talking about... WATER VAPOR is the most important GHG and is the major GHG that regulates temperatures in the Troposphere. In fact I posted already that water vapor accounts for 95% to 98%, and these are only guesstimates of the greenhouse effect in the Troposphere, which is the atmospheric layer where most weather events occur as well as affecting surface temperatures.
When they talk about GHGs, they are not talking just about CO2, and yes I am aware that the AGW scientists LOVE to emphasize CO2 when there is no evidence, except flawed GCMs, that claim CO2 "causes massive warming"...
Then there is the fact, again, that at least half of the record temperatures that the AGW camp LOVE to talk about occurred in the 1930s, when there was less atmospheric CO2 and less sources of anthropogenic CO2 than exist now...
Not to mention the Medieval and Roman Warm period which were global in nature and were much warmer than it has been in the 20th century or so far in the 21st century even when atmospheric CO2 levels were around 280-290ppm if not lower.
Originally posted by Kali74
I don't recall ever saying there aren't other factors in earths climate. I've mentioned a few already in this thread, why you pretend otherwise is beyond me. You've not shown I'm wrong and in fact much of what you claim as proof that man is not affecting climate is already disproven or there's not enough evidence for.
To be con't... I have to go to work.
Disproved? really? or claimed to be disproved by those who idolize liars like Mann, Jones, Hansen et al?... And yes your argument has been proven wrong even by the actions of the very same people you keep trying to protect even when they have been caught lying time, and again, and again.
You keep trying to ignore the fact that your AGW scientists have been caught red handed in their dirty/devious tactics... AGAIN, if there was "undeniable proof" that anthropogenic CO2 is the cause of the ongoing Climate Change then why do they have to resort to such devious tactics trying to hide the truth?...
edit on 23-7-2013 by ElectricUniverse because: (no reason given)
reply to post by ElectricUniverse
I'll get back to the rest after you quantify this.
You keep trying to ignore the fact that your AGW scientists have been caught red handed in their dirty/devious tactics... AGAIN, if there was "undeniable proof" that anthropogenic CO2 is the cause of the ongoing Climate Change then why do they have to resort to such devious tactics trying to hide the truth?...
I'll get back to the rest after you quantify this.
reply to post by ElectricUniverse
Just using Boxer's hearing as an example, we have insurer's crying about losses, and blindly attributing it to "climate change," when it clearly a product of land-use, development and housing policies run amok (in the U. S., at least) People ignore the fact that lowlands flood, but build there with federal flood insurance to backstop their bets. We interrupt the natural burn cycles in Western wilderness so that people can build there, and when the inevitable fire works according to nature (we can't alter natural patterns), the owners, developers, politicians and environmentalists scream that "the climate is changing!"
B. S.
You live in a forest? You're going to get burned.
You live on a beach or wetland? You're going to get wet.
AGW advocates, the multi-billion$$ -endowed institutions that support them, and the politicians who depend upon their votes and $$ will point to an imaginary "evil" that can only be addressed with more $$, support and policies that wholly fail to address the problems at hand, but chase straw men that are given voice by niche "scientists" who tweak raw data, front-load "models" and ignore evidence to the contrary to bolster their hypotheses. Why is it that the CRU can only provide their "massaged" data (after struggling to keep it to themselves), but not the underlying raw measurements? Why is it that models must be programmed to show warming regardless of raw data that shows otherwise, or shows nothing at all? How can Mann, et al take "tree ring data," manipulate it, and plug cherry-picked results into "models," and be taken seriously without replication or falsifiable theories? A graph proves nothing unless third parties can reproduce similar results with the same inputs. Garbage in, garbage out.
In any other field, theoreticians welcome examination of their hypotheses; not so with AGW.
In any other field, "falsification" is the ultimate arbiter of the validity of a theory or observation; not so with AGW.
In any other field, raw data is shared for comparison and "adjustments" are supported openly; not so with AGW.
As for "mitigation," why aren't we looking at the most vulnerable and expensive targets?
Who gets to build on the coast at my expense?
Who gets to alter scrub and forest husbandry at my expense?
Who gets to "improve" former prairie and ranch-land into tornado alley subdivisions at my expense?
Who benefits from raising the "social cost of carbon" in the U. S., while the rest of the world ramps-up their coal-burning plants and industries?
None of these are "caused" by AGW, but every one of them contribute to the property losses and death tolls from the inevitable natural occurrence that thumbs its nose at Man's foolish hubris.
.
The entire AGW doctrine is founded upon hubris, and little more.
The best that the IPCC, Hadley/CRU and other AGW advocates can say is, "we don't know what causes warming, so it must be US." The most that "adjusted" paleo-climatology can say is that we've seen a 1.5 degree C change over 300 years (within the margin of error).
And this justifies the transfer of $100,000,000,000 from "industrialized" nations to NGOs and polluters?
For what, exactly?
We think way too much of ourselves and forget that grand policies affect times and people never considered in the narrow-minded exploitation of limited knowledge and limited interest. AGW depends upon and thrives on general Apathy, and self-serving "solutions" to imaginary crises.
What the AGW (Anthropogenic Global Warming) camp fail to understand is that the climate has ALWAYS been changing, and yes it can have disastrous effects. It has happened before, and it will happen again.
Instead of spending billions of dollars sequestering a gas, CO2, that is needed by plants, trees, and the green biomass of Earth alongside some life forms that directly feed off CO2, what we should be doing is preparing to adapt to the changes.
Just using Boxer's hearing as an example, we have insurer's crying about losses, and blindly attributing it to "climate change," when it clearly a product of land-use, development and housing policies run amok (in the U. S., at least) People ignore the fact that lowlands flood, but build there with federal flood insurance to backstop their bets. We interrupt the natural burn cycles in Western wilderness so that people can build there, and when the inevitable fire works according to nature (we can't alter natural patterns), the owners, developers, politicians and environmentalists scream that "the climate is changing!"
B. S.
You live in a forest? You're going to get burned.
You live on a beach or wetland? You're going to get wet.
AGW advocates, the multi-billion$$ -endowed institutions that support them, and the politicians who depend upon their votes and $$ will point to an imaginary "evil" that can only be addressed with more $$, support and policies that wholly fail to address the problems at hand, but chase straw men that are given voice by niche "scientists" who tweak raw data, front-load "models" and ignore evidence to the contrary to bolster their hypotheses. Why is it that the CRU can only provide their "massaged" data (after struggling to keep it to themselves), but not the underlying raw measurements? Why is it that models must be programmed to show warming regardless of raw data that shows otherwise, or shows nothing at all? How can Mann, et al take "tree ring data," manipulate it, and plug cherry-picked results into "models," and be taken seriously without replication or falsifiable theories? A graph proves nothing unless third parties can reproduce similar results with the same inputs. Garbage in, garbage out.
In any other field, theoreticians welcome examination of their hypotheses; not so with AGW.
In any other field, "falsification" is the ultimate arbiter of the validity of a theory or observation; not so with AGW.
In any other field, raw data is shared for comparison and "adjustments" are supported openly; not so with AGW.
As for "mitigation," why aren't we looking at the most vulnerable and expensive targets?
Who gets to build on the coast at my expense?
Who gets to alter scrub and forest husbandry at my expense?
Who gets to "improve" former prairie and ranch-land into tornado alley subdivisions at my expense?
Who benefits from raising the "social cost of carbon" in the U. S., while the rest of the world ramps-up their coal-burning plants and industries?
None of these are "caused" by AGW, but every one of them contribute to the property losses and death tolls from the inevitable natural occurrence that thumbs its nose at Man's foolish hubris.
.
The entire AGW doctrine is founded upon hubris, and little more.
The best that the IPCC, Hadley/CRU and other AGW advocates can say is, "we don't know what causes warming, so it must be US." The most that "adjusted" paleo-climatology can say is that we've seen a 1.5 degree C change over 300 years (within the margin of error).
And this justifies the transfer of $100,000,000,000 from "industrialized" nations to NGOs and polluters?
For what, exactly?
We think way too much of ourselves and forget that grand policies affect times and people never considered in the narrow-minded exploitation of limited knowledge and limited interest. AGW depends upon and thrives on general Apathy, and self-serving "solutions" to imaginary crises.
edit on 23-7-2013 by jdub297 because: (no reason given)
reply to post by Kali74
What a load of crap!
Who's to say what's "natural," and how it compares with Man's relative contributions?
Until just recently we didn't even know of the geo-thermal vents on the seafloor that pour tons of CO2, CH4, H2S, and other "GHGs" into the environment. (Or, of the organisms that thrive there.)
Until just a few years ago we didn't realize that aerosols and "black soot" were the root causes of huge environmental effects otherwise attributed to "man-made climate change" and CO2.
"Closer to natural" assumes we even know what "natural" is and we don't!
Until we do, it is stupid to try to attribute anything to Man's contribution; the best we can do is guess, and that doesn't justify draconian limits on industry or the enormous transfer of wealth AGW advocates see as "the cure."
Pathetic self-delusion that the low-information public readily accept, along with angels and aliens.
How much are we willing to "transfer" to the religious faithful whose "consensus" is that we are doomed otherwise?
Why are the AGW faithful entitled to subservience, based largely upon un-questioning faith; and whose skeptics are castigated as "deniers," "flat-earthers," and worse? At this point in the infancy of "climate science," much of the AGW postulates are based upon faith and not much more.
Show me a single pro-AGW graph or a single model "projection" that doesn't depend upon subjective "adjustment" or "compensation." You can't, because they do not exist.
Return to your priests and devotionals. You have nothing else to live for.
The goal has never been to eliminate Co2... we can't survive without it, the goal always has been to curb our metric tons of added Co2 per year to something closer to natural.
What a load of crap!
Who's to say what's "natural," and how it compares with Man's relative contributions?
Until just recently we didn't even know of the geo-thermal vents on the seafloor that pour tons of CO2, CH4, H2S, and other "GHGs" into the environment. (Or, of the organisms that thrive there.)
Until just a few years ago we didn't realize that aerosols and "black soot" were the root causes of huge environmental effects otherwise attributed to "man-made climate change" and CO2.
"Closer to natural" assumes we even know what "natural" is and we don't!
Until we do, it is stupid to try to attribute anything to Man's contribution; the best we can do is guess, and that doesn't justify draconian limits on industry or the enormous transfer of wealth AGW advocates see as "the cure."
Pathetic self-delusion that the low-information public readily accept, along with angels and aliens.
How much are we willing to "transfer" to the religious faithful whose "consensus" is that we are doomed otherwise?
Why are the AGW faithful entitled to subservience, based largely upon un-questioning faith; and whose skeptics are castigated as "deniers," "flat-earthers," and worse? At this point in the infancy of "climate science," much of the AGW postulates are based upon faith and not much more.
Show me a single pro-AGW graph or a single model "projection" that doesn't depend upon subjective "adjustment" or "compensation." You can't, because they do not exist.
Return to your priests and devotionals. You have nothing else to live for.
reply to post by Kali74
No, we can't.
We can make assumptions, but these are narrow and limited; we use tree rings from a forest in Greenland to "measure" CO2 in the Northern hemisphere, after "adjustments," We assume some rings are indicators, and reject "outliers." We add-in factors for rainfall and local seasonal differences that no one has measured, and ignore other factors that do not support the sought-after results.
We use cores that we assume are perfectly stable over eons, with no exchange or alteration, excepts when we measure the air bubbles and "adjust" the result to fit the "model."
Every single core and every single tree-ring population can produce different "proxies" depending upon the assumptions going in and the adjustments coming out. There are a wide range of [I]opinions[/I] about the substance and accuracy of such "proxies," even among AGW advocates. In reality, we "know" very little about paleo-climates. We even argue today about [I]actual measurements [/I], due to such factors as instrument age, location and reliability.
To put ANY of your eggs in the "paleo" basket is really taking a lot for granted, when it is not justified to do so.
By studying ice cores, tree rings and sediment cores we are able to tell what GHG levels and temperatures were during different periods or earths climate.
No, we can't.
We can make assumptions, but these are narrow and limited; we use tree rings from a forest in Greenland to "measure" CO2 in the Northern hemisphere, after "adjustments," We assume some rings are indicators, and reject "outliers." We add-in factors for rainfall and local seasonal differences that no one has measured, and ignore other factors that do not support the sought-after results.
We use cores that we assume are perfectly stable over eons, with no exchange or alteration, excepts when we measure the air bubbles and "adjust" the result to fit the "model."
Every single core and every single tree-ring population can produce different "proxies" depending upon the assumptions going in and the adjustments coming out. There are a wide range of [I]opinions[/I] about the substance and accuracy of such "proxies," even among AGW advocates. In reality, we "know" very little about paleo-climates. We even argue today about [I]actual measurements [/I], due to such factors as instrument age, location and reliability.
To put ANY of your eggs in the "paleo" basket is really taking a lot for granted, when it is not justified to do so.
reply to post by Kali74
I of course meant qualify. I also wanted to add this... Contrarians always want to say scientists lie. Disagreeing with someone doesn't make that someone a liar. Taking it to level of you and I... I disagree with you and many of the theories you promote have been disproven but I don't think you're a liar or have an agenda, I just think you're wrong. The works that James Hansen and Michael Mann have done is honest work, ironically it is dishonestly taken apart and reported to say things it doesn't.
I of course meant qualify. I also wanted to add this... Contrarians always want to say scientists lie. Disagreeing with someone doesn't make that someone a liar. Taking it to level of you and I... I disagree with you and many of the theories you promote have been disproven but I don't think you're a liar or have an agenda, I just think you're wrong. The works that James Hansen and Michael Mann have done is honest work, ironically it is dishonestly taken apart and reported to say things it doesn't.
reply to post by nenothtu
So you are asserting that I'm being dishonest? I chose the period I did, because it was the last time Co2 levels were as high as they are now, there was nothing dishonest or even deliberate about it. I also said Co2 levels and temperatures have been much higher and much lower.
That cycle is always a factor with our climate, I in no way said that it wasn't now, what I said was very clear, "currently our orbital position and tilt should have us in a cooler cycle." Feel free to verify this.
There's nothing curious about solar output effect on plant growth. Self regulating cycles are a beautiful thing, maybe you should learn about the global carbon cycle before talking down to me like I'm a child. We are interfering with that cycle, overwhelming it. If there were another source adding Co2 or any other GHG to the atmosphere in large quantities for decades on end, that source would be the cause of global warming.
Climate change in earths past (barring catastrophes such as asteroid collisions etc) has always taken place over thousands or millions of years, allowing life to adapt and evolve... not all made it of course. So yes absolutely the rate of atmospheric greenhouse gas increase matters... a lot.
There have been other climate epochs in which the planet warmed due to greenhouse gas levels in the atmosphere.
What would those be, that we haven't mentioned already?
Al Gore was already very rich, he'd have continued to get richer without "An Inconvenient Truth", he'd have gotten richer without speaking fees. There's a whole science that exists outside of Al Gore.
If we were somehow rapidly sequestering carbon and methane and could somehow control our orbit around the sun, sure.
The earth having been much warmer in the past is irrelevant to current life which evolved to live in the climate that exists now. Would the climate change without us? Of course but not for another few thousand years if not tens or hundreds of of thousands of years (barring catastrophic events), plenty of time to adapt.
We are putting it back at a much faster rate than would occur naturally. It took millions and millions of years to sequester the amount of carbon we have pulled up out of the ground in a short 200 years. If we pulled up sequestered phosphorous from a lake bed and reintroduced it to the same lake at a 75% rate increase than what would have been released on it's own, it may be great for the plants that live in the lake they may boom but what about the fish, frogs, birds and humans that lived in or consumed that water? No matter the amount of new plants or how big, they cannot sequester the phosphorous at the same rate of re-introduction.
So you are asserting that I'm being dishonest? I chose the period I did, because it was the last time Co2 levels were as high as they are now, there was nothing dishonest or even deliberate about it. I also said Co2 levels and temperatures have been much higher and much lower.
Milankovitch cycles may have been a factor, or they may not have had as much influence as you'd like to think. I'm sure you are aware of the problems inherent in the theory, just as I'm sure you are aware that the cycles didn't simply go away when man entered the scene. There is no reason to assume that they WERE a factor then, but AREN'T the same factor now.
That cycle is always a factor with our climate, I in no way said that it wasn't now, what I said was very clear, "currently our orbital position and tilt should have us in a cooler cycle." Feel free to verify this.
Solar output also has the curious effect of promoting plant growth, which in turn removes CO2 from the atmosphere, and releases oxygen. Probably a good thing that it releases some to let the plants live, no? That's the beauty of cycles in a self-regulating system.
There's nothing curious about solar output effect on plant growth. Self regulating cycles are a beautiful thing, maybe you should learn about the global carbon cycle before talking down to me like I'm a child. We are interfering with that cycle, overwhelming it. If there were another source adding Co2 or any other GHG to the atmosphere in large quantities for decades on end, that source would be the cause of global warming.
it's how we know that both are normally HIGHER than they are now, and have been throughout the history of the Earth with but two relatively short (in geological terms) exceptions.
Climate change in earths past (barring catastrophes such as asteroid collisions etc) has always taken place over thousands or millions of years, allowing life to adapt and evolve... not all made it of course. So yes absolutely the rate of atmospheric greenhouse gas increase matters... a lot.
I must confess ignorance - I have no idea what a "GHG epoch" is. Sounds like propaganda to me.
There have been other climate epochs in which the planet warmed due to greenhouse gas levels in the atmosphere.
It;s done by ignoring climate change factors much larger than man
What would those be, that we haven't mentioned already?
It;s a shell game to make Al Gore a rich man.
Al Gore was already very rich, he'd have continued to get richer without "An Inconvenient Truth", he'd have gotten richer without speaking fees. There's a whole science that exists outside of Al Gore.
Interesting take. By that logic, man caused the ice ages, since they came along about the same time man arrived on the scene.
If we were somehow rapidly sequestering carbon and methane and could somehow control our orbit around the sun, sure.
Prior to that Earth was much warmer most of the time.
The earth having been much warmer in the past is irrelevant to current life which evolved to live in the climate that exists now. Would the climate change without us? Of course but not for another few thousand years if not tens or hundreds of of thousands of years (barring catastrophic events), plenty of time to adapt.
Again, we are not ADDING ANY GHG's to the atmosphere - we are simply putting back what was there already before we started existing.
We are putting it back at a much faster rate than would occur naturally. It took millions and millions of years to sequester the amount of carbon we have pulled up out of the ground in a short 200 years. If we pulled up sequestered phosphorous from a lake bed and reintroduced it to the same lake at a 75% rate increase than what would have been released on it's own, it may be great for the plants that live in the lake they may boom but what about the fish, frogs, birds and humans that lived in or consumed that water? No matter the amount of new plants or how big, they cannot sequester the phosphorous at the same rate of re-introduction.
Originally posted by Kali74
I of course meant qualify. I also wanted to add this... Contrarians always want to say scientists lie. Disagreeing with someone doesn't make that someone a liar. Taking it to level of you and I... I disagree with you and many of the theories you promote have been disproven but I don't think you're a liar or have an agenda, I just think you're wrong. The works that James Hansen and Michael Mann have done is honest work, ironically it is dishonestly taken apart and reported to say things it doesn't.
I am not talking about "disagreements", but about LIES, publishing FALSE information KNOWINGLY trying to push the AGW hoax... I am talking about the main proponents of AGW trying to stop any scientist from publishing or coming forward with evidence that contradicts the AGW claim... I am talking about the AGW scientists being caught time after time, after time LYING ...
On page one in this same thread you find some of the examples of the lies, and devious/dirty tactics that the AGW scientists have been using.
I hate having to repost again those excerpts, but for some reason people like you seem to suddenly become blind when this evidence is presented to you.
Tampering with data like.
IEA: Hadley Center “probably tampered with Russian climate data”
...
An email from Jones to Mann in March 2004 stated:
Recently rejected two papers (one for JGR and for GRL) from people saying CRU has it wrong over Siberia. Went to town in both reviews, hopefully successfully. If either appears I will be very surprised, but you never know with GRL.
Yesterday’s report (RIA Novosti) from Russia said:
Climategate has already affected Russia. On Tuesday, the Moscow-based Institute of Economic Analysis (IEA) issued a report claiming that the Hadley Center for Climate Change based at the headquarters of the British Meteorological Office in Exeter (Devon, England) had probably tampered with Russian-climate data.
The IEA believes that Russian meteorological-station data did not substantiate the anthropogenic global-warming theory.
Analysts say Russian meteorological stations cover most of the country’s territory, and that the Hadley Center had used data submitted by only 25% of such stations in its reports.
Over 40% of Russian territory was not included in global-temperature calculations for some other reasons, rather than the lack of meteorological stations and observations.
The data of stations located in areas not listed in the Hadley Climate Research Unit Temperature UK (HadCRUT) survey often does not show any substantial warming in the late 20th century and the early 21st century.
The HadCRUT database includes specific stations providing incomplete data and highlighting the global-warming process, rather than stations facilitating uninterrupted observations.
On the whole, climatologists use the incomplete findings of meteorological stations far more often than those providing complete observations.
IEA analysts say climatologists use the data of stations located in large populated centers that are influenced by the urban-warming effect more frequently than the correct data of remote stations.
The scale of global warming was exaggerated due to temperature distortions for Russia accounting for 12.5% of the world’s land mass. The IEA said it was necessary to recalculate all global-temperature data in order to assess the scale of such exaggeration.
Global-temperature data will have to be modified if similar climate-date procedures have been used from other national data because the calculations used by COP15 analysts, including financial calculations, are based on HadCRUT research.
RIA Novosti is not responsible for the content of outside sources.
...
climateaudit.org...
Hansen has been caught many times publishing similar false information, and not only from Russia, but also from China and other regions.
The scientist behind the bogus claim in a Nobel Prize-winning UN report that Himalayan glaciers will have melted by 2035 last night admitted it was included purely to put political pressure on world leaders.
Dr Murari Lal also said he was well aware the statement, in the 2007 report by the Intergovernmental Panel on Climate Change (IPCC), did not rest on peer-reviewed scientific research.
In an interview with The Mail on Sunday, Dr Lal, the co-ordinating lead author of the report’s chapter on Asia, said: ‘It related to several countries in this region and their water sources. We thought that if we can highlight it, it will impact policy-makers and politicians and encourage them to take some concrete action.
‘It had importance for the region, so we thought we should put it in.’
Dr Lal’s admission will only add to the mounting furore over the melting glaciers assertion, which the IPCC was last week forced to withdraw because it has no scientific foundation.
According to the IPCC’s statement of principles, its role is ‘to assess on a comprehensive, objective, open and transparent basis, scientific, technical and socio-economic information – IPCC reports should be neutral with respect to policy’.
.........
www.dailymail.co.uk...
www.abovetopsecret.com...
www.abovetopsecret.com...
A BRITISH climate scientist at the centre of a controversy over leaked emails is facing fresh claims that he sought to hide problems in temperature data on which his work was based.
An investigation of more than 2000 emails apparently hacked from the University of East Anglia's climatic research unit has found evidence that a series of measurements from Chinese weather stations was seriously flawed.
Climate scientist Phil Jones and a collaborator have been accused of scientific fraud for attempting to suppress data that could cast doubt on a key 1990 study on the effect of cities on warming.
Dr Jones withheld the information requested under British freedom of information laws. Subsequently a senior colleague told him he feared that Dr Jones' collaborator, Wei-chyung Wang of the University at Albany, had ''screwed up''.
The apparent attempts to cover up problems with temperature data from the Chinese weather stations provide the first link between the email scandal and the UN's embattled climate science body, the Intergovernmental Panel on Climate Change, as a paper based on the measurements was used to bolster IPCC statements about rapid global warming in recent decades.
The IPCC has already been criticised for its use of information that had not been rigorously checked - in particular a false claim that all Himalayan glaciers could melt by 2035.
Of 105 freedom of information requests to the University of East Anglia over the climatic research unit, which Dr Jones led until the end of December, only 10 had been released in full.
..............
www.theage.com.au...
In at least one of the emails they mention ways that they can use not to release information, and in one of the emails Jones himself jokes saying...:
....If they ever hear there is a Freedom of Information Act now in the UK, I think Ill delete the file rather than send to anyone."
www.cbsnews.com...
From Roger Pielke who found out that raw temperature data had been deleted by the Climatic Research Unit (CRU).
We Lost the Original Data
Steve McIntyre, of ClimateAudit, is a determined individual. While this may be no fun for those who fall under his focus and happen to have something to hide, more sunlight on climate science cannot be a bad thing.
...
Obviously, the ability to do good research depends upon good data with known provenance. At the time WMO Resolution 40 was widely hailed in the atmospheric sciences community as a major step forward in data sharing and availability in support of both operations and research.
Thus it is with some surprise to observe CRU going through bizarre contortions to avoid releasing its climate data to Steve McIntyre. They first told him that he couldn't have it because he was not an academic. I found this to be a petty reason for keeping data out of the hands of someone who clearly wants to examine it for scholarly purposes. So, wanting to test this theory I asked CRU for the data myself, being a "real" academic. I received a letter back from CRU stating that I couldn't have the data because "we do not hold the requested information."
I found that odd. How can they not hold the data when they are showing graphs of global temperatures on their webpage? However, it turns out that CRU has in response to requests for its data put up a new webpage with the following remarkable admission (emphasis added):
We are not in a position to supply data for a particular country not covered by the example agreements referred to earlier, as we have never had sufficient resources to keep track of the exact source of each individual monthly value. Since the 1980s, we have merged the data we have received into existing series or begun new ones, so it is impossible to say if all stations within a particular country or if all of an individual record should be freely available. Data storage availability in the 1980s meant that we were not able to keep the multiple sources for some sites, only the station series after adjustment for homogeneity issues.[b/ We, therefore, do not hold the original raw data but only the value-added (i.e. quality controlled and homogenized) data.
Say what?! CRU has lost track of the original data that it uses to create its global temperature record!? Can this be serious? So not only is it now impossible to replicate or reevaluate homogeneity adjustments made in the past -- which might be important to do as new information is learned about the spatial representativeness of siting, land use effects, and so on -- but it is now also impossible to create a new temperature index from scratch. CRU is basically saying, "trust us." So much for settling questions and resolving debates with empirical information (i.e., science).
...
rogerpielkejr.blogspot.com...
Among other dirty tactics...
[UPDATE 2 11/30: Here are several remarkable statements from climate scientists, one from the emails showing Kevin Trenberth calling for Chris Landsea to be fired for holding the wrong views and and a comment today from Gavin Schmidt justifying gatekeeping in climate science on political grounds. With comments like that, who needs emails?;-)]
rogerpielkejr.blogspot.com...
AGW hoaxers like Cullen who have called for scientists to be decertified, or be denied recertification if they would DARE to question or doubt AGW...
The Weather Channel’s climatologist, Dr. Heidi Cullen who hosts the program “The Climate Code”, is advocating that broadcast meteorologists be denied certification (or re-certification) if they express skepticism about predictions of manmade global warming. She posted this revelation in the blog she runs on the Weather Channel website and you can read it here: climate.weather.com...
wattsupwiththat.com...
Why I it that they have to use these tactics if "there is definite proof that mankind is the cause of Climate Change"?...
You have been in these discussions before, why is it that you continuously ignore the evidence and then just want to claim "it is just disagreements"?...
Disagreements...really?...
edit on 24-7-2013 by ElectricUniverse because: (no reason given)
reply to post by jdub297
That's what happens when you compound lies upon lies. Eventually, it won't add up. I know we as a species need to take better care of our planet. We're killing our friends in the oceans, cutting down acres upon acres of woodlands, destroying vital habitation areas. We're putting chemicals into our oceans... And I'm all for fixing it.
But that doesn't mean we're responsible for global warming. Killing our planet? Sure. Global warming? No. And we shouldn't face taxation and other idiotic suggestions because someone somewhere wants to earn more money.
reply to post by Auricom
I have always acknowledged and advocated for our obligation to minimize our impacts upon our local environs. Much of my lifestyle depends upon
weather and crop and livestock production.
You will find that even AGW skeptics agree that Man should not "piss where you sleep."
That is a far cry from blaming Man for things over which he has no control, including global climate patterns.
It is a proven fact that as people and societies advance, they become more careful of their environments and conservative of their resources.
We should be pushing hard for MORE international development and environmental responsibility, but not at the expense of or to the detriment of those who have already done so.
The U.S. can lead the way; not by crippling industries, but by expanding affluence and a sense of responsibility.
The false gods of phony "renewable energy" and "evil CO2" have sustained a generation of academics and activists who have NOTHING to show as a result of their climate-saving boondoggles and waste of billions of taxpayer and donor $$.
A concrete, steel, copper and rare-earth windmill is no more renewable than the coal it "replaces" at 100X the price.
Solar panels produced from silica and other exotic minerals are no more renewable than the natural gas they "replace" at 10X the cost.
Solar panels and windmills have tremendous adverse environmental impacts where they are located, and effective lives that limit their potential contributions to "sustainability."
If anything, they belong in Western and sub-Saharan Africa more than in the southwest U. S. and offshore of our coasts. Even there, the largest projects are foundering due to lack of ROI and base funding. The largest solar field ever envisioned has recently been abandoned as "unworkable" and grossly over-expensive.
If we, and the rest of the industrialized world, would focus more on local environments and present-day activities, we would see better, faster and more economically sensible results.
Future policies based upon unsupportable and un-testable "projections" and model "predictions" is wasteful and misguided, at best.
More likely, they are self-serving and self-enriching for their advocate.
There are few "climate skeptics" who've enriched themselves or their institutions from their efforts.
There are dozens of AGW advocates and their institutions who've thrived from their efforts and depend upon the diversion of donor and taxpayer money to their coffers. Start with the IPCC, and work backwards; the truth is obvious to anyone who will look.
jw
Originally posted by Kali74
That cycle is always a factor with our climate, I in no way said that it wasn't now, what I said was very clear, "currently our orbital position and tilt should have us in a cooler cycle." Feel free to verify this.
And feel free to verify that there are several factors occurring since about 1840, for example the weakening of the Earth's magnetic shield which hasn't seen such weak fluctuations in over 400,000 -700,000 Years. This has drastic influences on the climate...
Then there is the Local Fluff, a new region of space which is a million degrees hotter than the one we have been in. So far we have only encountered sections of this new region of space, and those sections increased the space radiation to levels not seen since we began to monitor space weather... There has been an exponential increase in interstellar dust entering the Solar System and planets like Earth as well as an exponential increase in meteors/meteorites. There are the other anomalies in the Solar System such as the secular increase in the AU (distance) between the planets and the Sun and which CAN'T BE EXPLAINED.
Secular increase of the astronomical unit and perihelion precessions as tests of the Dvali–Gabadadze–Porrati multi-dimensional braneworld scenario
Lorenzo Iorio JCAP09(2005)006 doi: 10.1088/1475-7516/2005/09/006
PDF (313 KB) | HTML | References | Articles citing this article
Lorenzo Iorio
Viale Unità di Italia 68, 70125, Bari, Italy
E-mail: [email protected]
Abstract. An unexpected secular increase of the astronomical unit, the length scale of the Solar System, has recently been reported by three different research groups (Krasinsky and Brumberg, Pitjeva, Standish). The latest JPL measurements amount to 7 ± 2 m cy−1. At present, there are no explanations able to accommodate such an observed phenomenon, either in the realm of classical physics or in the usual four-dimensional framework of the Einsteinian general relativity. The Dvali–Gabadadze–Porrati braneworld scenario, which is a multi-dimensional model of gravity aimed at providing an explanation of the observed cosmic acceleration without dark energy, predicts, among other things, a perihelion secular shift, due to Lue and Starkman, of 5 × 10⁻⁴ arcsec cy−1 for all the planets of the Solar System. It yields a variation of about 6 m cy−1 for the Earth–Sun distance which is compatible with the observed rate of change for the astronomical unit. The recently measured corrections to the secular motions of the perihelia of the inner planets of the Solar System are in agreement with the predicted value of the Lue–Starkman effect for Mercury, Mars and, at a slightly worse level, the Earth.
www.iop.org...
..........................
8.2 Other anomalies?
There is one further observation which status is rather unclear bit which perhaps may fit into the other observations. This is the observation of the return time of comets: Comets usually come back a few days before they are expected when applying ordinary equations of motion. The delay usually is assigned to the outgassing of these objects. In fact, the delay is used for an estimate of the strength of this outgassing. On the other hand, it has been calculated in (44) that the assumption that starting with 20 AU there is an additional acceleration of the order of the Pioneer anomaly also leads to the effect that comets come back a few days earlier. It is not clear whether this is a serious indications but a further study of the trajectories of comets certainly is worthwhile.
arxiv.org...
Now, note what it says in the last excerpt above.
On the other hand, it has been calculated in (44) that the assumption that starting with 20 AU there is an additional acceleration of the order of the Pioneer anomaly also leads to the effect that comets come back a few days earlier.
arxiv.org...
Comets are arriving earlier than they are supposed to, and calculations are assuming that starting at about 20 AU there is an additional acceleration in the order of the Pioneer anomaly.
Satellites are not the only ones being affect by whatever is causing this anomaly.
Originally posted by Kali74
There's nothing curious about solar output effect on plant growth. Self regulating cycles are a beautiful thing, maybe you should learn about the global carbon cycle before talking down to me like I'm a child. We are interfering with that cycle, overwhelming it. If there were another source adding Co2 or any other GHG to the atmosphere in large quantities for decades on end, that source would be the cause of global warming.
The Earth has had HIGHER levels of atmospheric CO2, and it was fine... In fact these were the times in which Earth found itself with the largest, and stronger trees and plants producing a lot more yield/food than we are getting now...
Also, your arguments has large holes in it. First, larger levels of atmospheric CO2 have been found by hundreds of experiments to be BENEFITIAL... Second, we are not adding anything new to the atmosphere. The levels of anthropogenic CO2 come from Earth, we didn't create them out of thin air, not to mention that there is no evidence WHATSOEVER that CO2 causes the warming claimed by you and the other AGW proponents...
For crying out loud, the areas that have been warming the most are FAR AWAY from anthropogenic source emissions... This is a clear sign that CO2 is not the gas that "causes the warming claimed by the AGW camp"...
Originally posted by Kali74
Climate change in earths past (barring catastrophes such as asteroid collisions etc) has always taken place over thousands or millions of years, allowing life to adapt and evolve... not all made it of course. So yes absolutely the rate of atmospheric greenhouse gas increase matters... a lot.
WRONG... There have been PLENTY of rapid Climate Changes in Earth's past which occurred within a few years...
The ongoing Climate Change began in the early 1600s, and is still ongoing, yet the AGW crowd keep claiming that "it is unprecedented and too fast"... BULLOCKS!!!
Hormes, A., Beer, J. and Schlüchter, C., 2006. A geochronological approach to understanding the role of solar activity on Holocene glacier length variability in the Swiss Alps. Geogr. Ann., 88 A (4): 281–294.
Abstract — We present a radiocarbon data set of 71 samples of wood and peat material that melted out or sheared out from underneath eight present day mid-latitude glaciers in the Central Swiss Alps. Results indicated that in the past several glaciers have been repeatedly less extensive than they were in the 1990s. The periods when glaciers had a smaller volume and shorter length persisted between 320 and 2500 years. This data set provides greater insight into glacier variability than previously possible, especially for the early and middle Holocene. The radiocarbon-dated periods defined with less extensive glaciers coincide with periods of reduced radioproduction, pointing to a connection between solar activity and glacier melting processes. Measured long-term series of glacier length variations show significant correlation with the total solar irradiance. Incoming solar irradiance and changing albedo can account for a direct forcing of the glacier mass balances. Long-term investigations of atmospheric processes that are in interaction with changing solar activity are needed in order to understand the feedback mechanisms with glacier mass balances.
The Role of Solar Activity on Holocene Glacier Length Variability in the swiss Alps
PLEISTOCENE AND HOLOCENE GLACIER ADVANCES IN CENTRAL ASIA AND
NEPAL AS ASSESSED BY IN SITU COSMOGENIC 10Be EXPOSURE AGES OF
MORAINE BOULDERS
U. Abramowski, B. Glaser, W. Zech (Univ. Bayreuth); S. Ivy-Ochs (ETHZ); P.W. Kubik (PSI)
In situ cosmogenic 10Be concentrations in samples from lateral and frontal moraine boulders from the Turkestan
Range and the Alay Range (Kyrgystan), and the Gorkha Himal (Nepal) yield exposure ages corresponding to glacier
advances ~3000, ~11,000, ~20,000, ~60,000 and >60,000 y BP. Our results corroborate the hypothesis, that, at
least in the Alay Range, the maximum glacier advance was during the late Pleistocene (OIS-4).
www.ipp.phys.ethz.ch...
Late Holocene, high-resolution glacial chronologies and climate, Kenai Mountains, Alaska
GREGORY C. WILES1 and PARKER E. CALKIN1
1 Department of Geology, University at Buffalo, 415 Fronczak Hall, Amherst, New York 14260
Recent retreat of outlet glaciers from the Harding and Grewingk-Yalik Icefields has revealed a vast array of deposits on the eastern and western flanks of the Kenai Mountains that records multiple glacier advances into coastal forests during late Holocene time. Treering dating, together with radiocarbon and lichenometric analyses, allows for the reconstruction of these glacial fluctuations to decadal precision over the past two thousand years.
The records of fluctuations are derived from 16 land-terminating and seven tidewater glaciers in three fjord systems, as well as two cirque glaciers. Three major intervals of Holocene glacier expansions are evident; they occurred about 3600 yr B.P., 600 A.D., and during the Little Ice Age, from 1300 to 1850 A.D. The earliest expansion beyond present ice margins is known only from the McCarty tidewater glacier. The 600 A.D. event involved the simultaneous advance of land-terminating and tidewater glaciers. During the Little Ice Age, however, tidewater glaciers were advancing several centuries prior to their land-terminating neighbors. Those land-terminating glaciers on the western mountain flank retreated from their Little Ice Age maxima as much as two centuries before those on the eastern mountain flank.
Land-terminating tongues on the eastern, more maritime, mountain flank have shown more sensitivity to variations in winter precipitation during the Little Ice Age and within recent decades than the more continental glaciers on the western flank that are affected more by summer temperatures. The glacial and climatic records suggest that advances of the ice tongues from about 1420 to 1460 A.D., between 1640 and 1670 A.D., at about 1750 A.D., and from 1880 to 1910 A.D. reflected times of increased winter precipitation. Advances between 1440 to 1460 A.D., from 1650 to 1710 A.D., and from 1830 to 1860 A.D. followed intervals of lower summer temperatures.
bulletin.geoscienceworld.org...
Palaeoecological constraints on late Glacial and Holocene ice retreat in the Southern Andes (53°S)
References and further reading may be available for this article. To view references and further reading you must purchase this article.
Rolf Kiliana, , , Christoph Schneiderb, Johannes Kochc, Martinus Fesq-Martina, Harald Biesterd, Gino Casassae, Marcelo Arévalof, Gert Wendtg, Oscar Baezaa and Jan Behrmannh
aLehrstuhl für Geologie, Fachbereich VI, Geowissenschaften, Universität Trier, D-54286 Trier, Germany
bDepartment of Geography, RWTH Aachen University, D-52056 Aachen, Germany
cDepartment of Earth Sciences, Simon Fraser University, Burnaby, B.C., Canada V5A 1S6
dInstitut für Umweltgeochemie, Universität Heidelberg, INF 236, D-69120 Heidelberg, Germany
eCentro de Estudios Cientificos, Valdivia, Chile
fDepartamento Antarctico, Universidad Magallanes, Punta Arenas, Chile
gInstitut für Nachrichtentechnik und Informationselektronik, Universität Rostock, Richard-Wagner-Str. 31, 18119 Rostock, Germany
hMarine Geodynamics, IFM-GEOMAR, Wischhofstr. 1-3, 24148 Kiel, Germany
Available online 10 January 2007.
Abstract
Late Glacial to Holocene ice retreat was investigated along a 120 km long fjord system, reaching from Gran Campo Nevado (GCN) to Seno Skyring in the southernmost Andes (53°S). The aim was to improve the knowledge on regional and global control on glacier recession with special emphasis on latitudinal shifting of the westerlies. The timing of ice retreat was derived from peat and sediment cores, using mineralogical and chemical characteristics, and pollen as proxies. Stratigraphy was based on 14C-AMS ages and tephrochronology. The ice retreat of the Seno Skyring Glacier lobe is marked by an ice rafted debris layer which was formed around 18,300 to 17,500 cal. yr B.P. Subsequently, fast glacier retreat occurred until around 15,000 to 14,000 cal. yr B.P. during which around 84% of Skyring Glacier were lost. This fast recession was probably also triggered by an increase of the Equilibrium Line Altitude (ELA) from 200 to 300 m. Subsequently, the ice surface was lowered below the ELA in an area that previously made up more than 50% of the accumulation area. Much slower retreat and glacier fluctuations of limited extent in the fjord channel system northeast of GCN occurred between around 14,000 to 11,000 cal. yr B.P. during both the Antarctic Cold Reversal and the Younger Dryas. This slow down of retreat indicates a decline in the general warming trend and/or increased precipitation, due to a southward migration of the westerlies. After around 11,000 cal. yr B.P. pollen distribution shows evolved Magellanic Rainforest and similar climate as at present, which lasted throughout most of the Holocene. Only Late Neoglacial moraine systems were formed in the period 1220–1460 AD, and subsequently in the 1620s AD, and between 1870 and 1910 AD. The results indicate that the Gran Campo Nevado ice cap has reacted more sensitive and partly distinct to climate change, compared to the Patagonian Ice Field.
www.sciencedirect.com
Originally posted by Kali74
There have been other climate epochs in which the planet warmed due to greenhouse gas levels in the atmosphere.
Sorry to rain in your parade but do you understand the FACT that CO2 level changes LAG behind temperature changes?... Not to mention that when the atmosphere warms it can hold more WATER VAPOR which is 10 times more potent molecule by molecule than CO2 and exists at much higher levels/volumes than CO2 ever will. WATER VAPOR is the main GHG that keeps Earth's temperatures kind of moderate, not CO2.
Originally posted by Kali74
What would those be, that we haven't mentioned already?
We mentioned some, and the fact is that these NATURAL factors are not factored in on GCMs, which is why several scientists have found that GCMs are flawed to a fault that their so called "predictions" are useless...
Originally posted by Kali74
Al Gore was already very rich, he'd have continued to get richer without "An Inconvenient Truth", he'd have gotten richer without speaking fees. There's a whole science that exists outside of Al Gore.
He had a few millions, but made a lot more with the farce that is AGW, and then again there are the AGW scientists like Hansen, Mann, Jones, Tremberth, Cullen, Schmidt, etc, etc who have resorted to using devious tactics because they simply have no real evidence to support the AGW religion.
Originally posted by Kali74
If we were somehow rapidly sequestering carbon and methane and could somehow control our orbit
edit on 25-7-2013 by ElectricUniverse because: (no reason given)
Originally posted by Kali74
reply to post by nenothtu
So you are asserting that I'm being dishonest? I chose the period I did, because it was the last time Co2 levels were as high as they are now, there was nothing dishonest or even deliberate about it. I also said Co2 levels and temperatures have been much higher and much lower.
ElectricUniverse did a good job of responding to this post, and I have but a few observations to add. Yes, you said they have been much higher and much lower, but neglected to point out as I have that the norm for most of Earth's history has been much higher, I'm not sure what you mean by "much lower" - the lowest I have been able to find was 350 ppm in the mid carboniferous, compared with the 380 or so ppm of today. Furthermore, I could only find two periods in which levels were lower than today - the previously mentioned mid carboniferous and the Pliocene which you are using as an example of the norm, starting a mere 2 million years ago.
It does seem to smack of spin to ignore the whole history of Earth in favor of promoting aberrations of CO2 impoverishment as the "norm".
Climate change in earths past (barring catastrophes such as asteroid collisions etc) has always taken place over thousands or millions of years, allowing life to adapt and evolve... not all made it of course. So yes absolutely the rate of atmospheric greenhouse gas increase matters... a lot.
No. Rate only matters if it can be sustained beyond what has previously been in circulation - i.e. if we can somehow pull more than the planet can bear out of thin air. Obviously this is not the case. All of the carbon we can emit has been in the atmosphere before, all at once. We could only imbalance it by somehow putting more than we can get out there. Life made it through the episodes where all of that carbon was in the air before, and there is no reason to believe that it would somehow vanish now simply because all of that carbon is back in the air again. As a matter of fact, the geologic record shows that life absolutely flourishes under higher carbon conditions, and takes a hit when they drop to modern levels.
I must confess ignorance - I have no idea what a "GHG epoch" is. Sounds like propaganda to me.
There have been other climate epochs in which the planet warmed due to greenhouse gas levels in the atmosphere.
Indeed, 'tis so! Those "warmer GHG epochs", as you explain your term here, cover most of the planet's history, without ill effect.
It;s done by ignoring climate change factors much larger than man
What would those be, that we haven't mentioned already?
We have mentioned most of them already. Attempting to trivialize them so as to lay a disproportionate amount of blame at the feet of human kind is precisely the sort of "weird science" I am referring to when I allude to the intellectual dishonesty that the AGW scientists are promoting.
Al Gore was already very rich, he'd have continued to get richer without "An Inconvenient Truth", he'd have gotten richer without speaking fees. There's a whole science that exists outside of Al Gore.
Not science. Pseudo-science. It runs in the same trackway as astrology instead of astronomy, and creationism as promoted by "fundamentalists" (who are nothing of the sort) as a "science".
Prior to that Earth was much warmer most of the time.
The earth having been much warmer in the past is irrelevant to current life which evolved to live in the climate that exists now. Would the climate change without us? Of course but not for another few thousand years if not tens or hundreds of of thousands of years (barring catastrophic events), plenty of time to adapt.
Likewise, "current life" is irrelevant to Earth. Life changes all the time, constantly. It will change with or without climate change, and regardless of the source of said change. Only a dreamer or an extreme humanist thinks that man can somehow prevent life from changing by controlling the climate of an entire planet via taxation schemes to enrich the already rich.
Very rapid climate change, on the order of not even decades, but just YEARS, have occurred repeatedly in Earth's history, with no human input whatsoever, and Earth and life survived.
We are putting it back at a much faster rate than would occur naturally. It took millions and millions of years to sequester the amount of carbon we have pulled up out of the ground in a short 200 years.
Most of the coal deposits were laid down in a 60 million year period, just over 1% of Earth's lifetime. I suppose that could be considered "millions and millions of years". We have barely scratched the surface of those deposits, however, in a mere 200 years. We still have a LONG way to go before we can replace all the carbon that was sequestered, leading to the current cold period on Earth.
If we pulled up sequestered phosphorous from a lake bed and reintroduced it to the same lake at a 75% rate increase than what would have been released on it's own, it may be great for the plants that live in the lake they may boom but what about the fish, frogs, birds and humans that lived in or consumed that water? No matter the amount of new plants or how big, they cannot sequester the phosphorous at the same rate of re-introduction.
But we aren't discussing phosphorus, are we? Running with that example, however, the micro ecology of a lake is much easier to wreck than the macro ecology of an entire planet. The example, however, is not congruent to the discussion at hand, as it's very unlikely that phosphorus ever existed in a free state in that lake all at once. The CO2 in question HAS existed in the atmosphere all at once - for most of the Earth's history.
edit on 2013/7/26 by nenothtu because: (no reason given)
new topics
-
A Warning to America: 25 Ways the US is Being Destroyed
New World Order: 2 hours ago -
President BIDEN's FBI Raided Donald Trump's Florida Home for OBAMA-NORTH KOREA Documents.
Political Conspiracies: 7 hours ago -
Maestro Benedetto
Literature: 9 hours ago -
Is AI Better Than the Hollywood Elite?
Movies: 9 hours ago
top topics
-
President BIDEN's FBI Raided Donald Trump's Florida Home for OBAMA-NORTH KOREA Documents.
Political Conspiracies: 7 hours ago, 27 flags -
Weinstein's conviction overturned
Mainstream News: 17 hours ago, 8 flags -
Gaza Terrorists Attack US Humanitarian Pier During Construction
Middle East Issues: 14 hours ago, 8 flags -
Massachusetts Drag Queen Leads Young Kids in Free Palestine Chant
Social Issues and Civil Unrest: 16 hours ago, 7 flags -
Las Vegas UFO Spotting Teen Traumatized by Demon Creature in Backyard
Aliens and UFOs: 12 hours ago, 6 flags -
A Warning to America: 25 Ways the US is Being Destroyed
New World Order: 2 hours ago, 5 flags -
Meadows, Giuliani Among 11 Indicted in Arizona in Latest 2020 Election Subversion Case
Mainstream News: 15 hours ago, 5 flags -
2024 Pigeon Forge Rod Run - On the Strip (Video made for you)
Automotive Discussion: 13 hours ago, 4 flags -
Is AI Better Than the Hollywood Elite?
Movies: 9 hours ago, 3 flags -
The functionality of boldening and italics is clunky and no post char limit warning?
ATS Freshman's Forum: 15 hours ago, 1 flags
active topics
-
University of Texas Instantly Shuts Down Anti Israel Protests
Education and Media • 266 • : SchrodingersRat -
New whistleblower Jason Sands speaks on Twitter Spaces last night.
Aliens and UFOs • 66 • : baablacksheep1 -
Gaza Terrorists Attack US Humanitarian Pier During Construction
Middle East Issues • 31 • : 5thHead -
HORRIBLE !! Russian Soldier Drinking Own Urine To Survive In Battle
World War Three • 50 • : F2d5thCavv2 -
Russia Ukraine Update Thread - part 3
World War Three • 5732 • : F2d5thCavv2 -
The Acronym Game .. Pt.3
General Chit Chat • 7751 • : F2d5thCavv2 -
Salvador Dali's Moustaches
People • 28 • : zosimov -
Is AI Better Than the Hollywood Elite?
Movies • 17 • : ThePsycheaux -
The best Rice dish i've ever tasted... Kimchi Rice
Food and Cooking • 26 • : lamhaocc -
A Warning to America: 25 Ways the US is Being Destroyed
New World Order • 1 • : 727Sky