It looks like you're using an Ad Blocker.
Please white-list or disable AboveTopSecret.com in your ad-blocking tool.
Thank you.
Some features of ATS will be disabled while you continue to use an ad-blocker.

Let’s Agree to Put an End to the Petty 9/11 Argument’s
page: 12share:
And when you listen to the Rick Siegel ones, on his 911EYEWITNESS video's, you can hear the same ULF rumbles for both WTC 1 and 2 towers, from 13
seconds on, before both collapses.
www.youtube.com... (30min)
www.youtube.com... (1hr20min)
TB's have such a huge brisance, i.o.w. shattering force, since they have explosive speeds of 22,000 meters per second and more.
That should tell those posters who keep saying that a TB is just another Fuel/Air bomb that they are dead wrong, F/A's have much lower (5 x)explosion speeds. The right TB, a directional one, disc or ring shaped, can shatter a steel column like if it was a falling crystal glass.
Are you perhaps now going to believe what I tell you all for so long already, that TB's have an ULF sound stamp. Also when experiencing them from close by. And you live to tell.
This entire presentation hinges on a single fact. WTC7 reached freefall briefly in its collapse. This single fact is taken to prove that demolition occurred.
Those first (huge amount of time in any collapse) 2.5 seconds free-fall depict at least 8 floors worth of no resistance at all encountered by the top portion falling down.
That's ONLY possible when you use EXPLOSIVES, or hydraulic jacks, which do not rumble at all...
And when those floors are out of the way, all the rest after those 2.5 secs is a gravitational event. If no further charges were used to ''lead'' the building's outer shell.
The NIST plot in that indymedia.org.uk image link is by the way nearly exactly identical to the Chandler one, the only difference is, that NIST added some extra mumbo-jumbo, and plotted from left to right, while Chandler plotted from right to left on their time lines.
He never demonstrates this, he never proves this through any method, he never even shows his error bars. How in the world has this remotely convinced you?
NIST has vehemently defended its first position that no free fall at all occurred, in fact that only 40 percent of it ever was reached.
After heaps of scientists and politicians phoned and wrote them, they relently at last admitted this 2.5 seconds period of free fall.
A collapsing building CAN NOT fall through itself, whithout slowing down, and thus resulting in an upward ''knick'' in the plotted graph line.
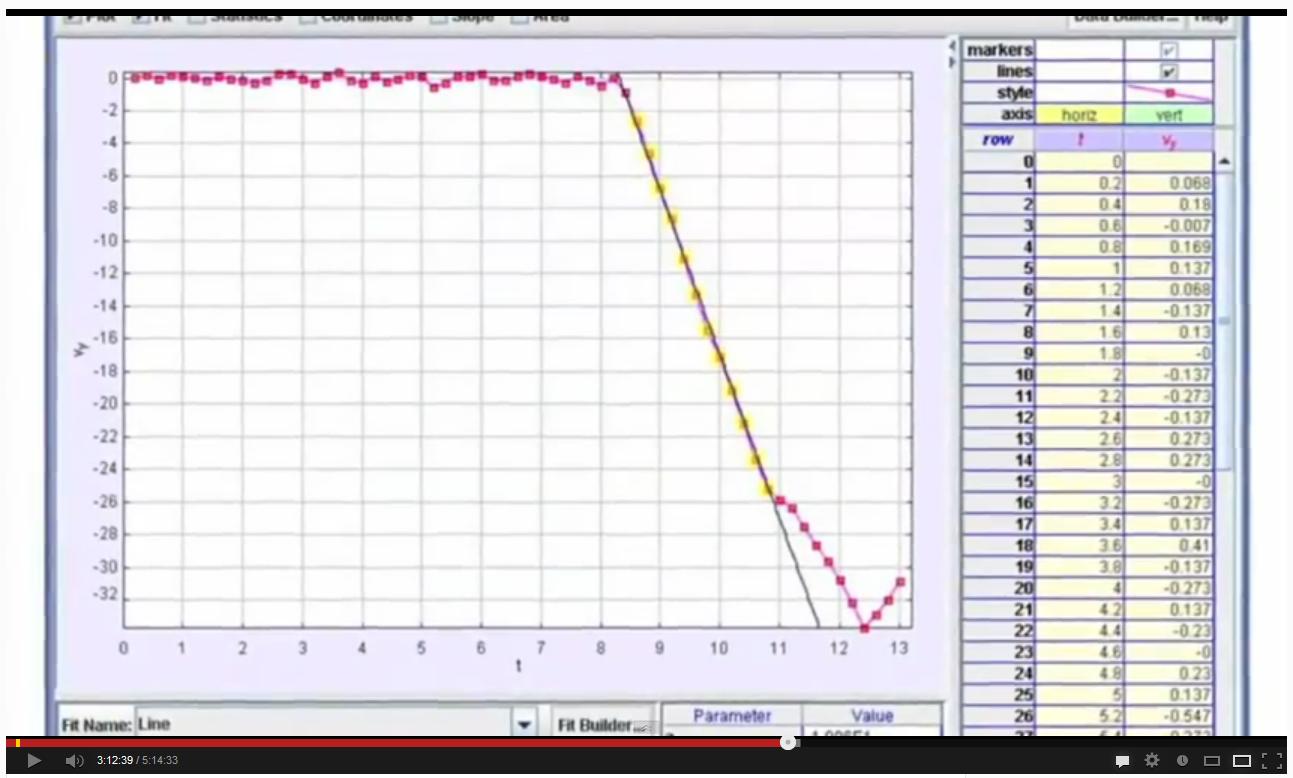
David has somewhere else explained that he took PIXELS in a HD version, to plot his graph. His method was very precise.
Originally posted by LaBTop
Exponent, I totally forgot I also posted in this thread, after a re-start of my box caused by a power failure last week. I'm glad you helped me to remind me of it. Next time use a PM when you like me to answer a post, then I see under every page window I click open, that ATS-reminder sentence flickering that I have a PM.
With respect labtop, it is not my job to inform you of replies. Your scattergun approach to posting here surely cannot help you keeping track of replies. Perhaps you could focus on a single topic at once because every time I provide evidence or claims that disagree with you you seem to post so much that nobody can keep track, then revert back to the same claims once again.
I will of course politely reply to you here, but I have already read the posts I am to reply to and I know you are still making the same arguments from faulty assumptions. I will attempt to address these as directly as I can.
So, you viewed that above Chandler lecture and offered two links, both are however single image links without the needed link to the article you took them out.
The links I offered are comparative graphs to show that Chandler's analysis is not well supported by the community. Both Femr and NIST characterise the collapse in quite similar manners. A gradual onset of deflection, followed by a rough descent of 8 floors at freefall acceleration, followed by a gradual deceleration.
Chandler's data on the other hand shows an immediate transition from unmoving to moving and as he uses a linear fit he gets only a single characteristic of the collapse. This is primarily down to bad technique as he uses an overly simple program not designed for this task, and plots the positions by hand.
The Indymedia.uk image link sends me not to the article, when I cut it down to its main page. Thus, offer a link please.
The Indymedia graph is extracted from the NIST final report which you can find here: wtc.nist.gov...
For the Femr ''WTC7-Displacement vs Acceleration'' link I could cut some slack away from its link and arrived at his main page where he writes that :
...
That's nice, but that's not a WTC 7 article, while you post a WTC 7 image. So, offer a link to the article where that image is used, please.
Femr doesn't particularly write articles that I know of, he discusses the results of his analysis on another forum I don't believe I'm permitted to link. I'm sure you can look him up easily though.
Now, on to the meat of your post.
Thus, femr shows us NOT the 2.5 secs freefall period in his graph, just before his 11 secs starting point in his graph timeline , which I and you would both expect. I find that highly curious and misleading, if he wanted to show that no free fall occurred.
Femr does indeed show the 2.5 second freefall period. It is that portion of the graph where the black line is underneath the horizontal line. This period actually shows that there is a period of faster than freefall, although it's not clear if this is calibration, measurement or real. This analysis is done with the same rough principles as Chandler, but with significantly greater rigor. Using computer matching with larger numbers of samples calibrated from many videos. It's a technique that I would expect to be used by experts and Femr does seem to wield it well. I have no idea why you don't think it includes a freefall period but it clearly does.
By the way, are you aware that NIST admitted that Chandler was right, about that 2.5 secs freefall period, in which at least an 8 storeys high space, worth normally a block of very heavy resistance, was in fact zero. Otherwise those 2.5 secs period would have looked very different in that graph.
NIST hardly 'admitted Chandler was right'. NIST included a graph in their final report that shows indeed there was very little (saying zero is inaccurate) structural resistance in that period.
Chandler mentioned also that his graph line fell within the one second uncertainty error margin of the software used, so I don't understand that you missed that.
There's no 'one second uncertainty margin'. We are talking about a total period of 2.5s, if there is a one second uncertainty then the rate of acceleration is uncertain to more than 2m/s/s. How then could he possibly claim it would be 'within a few percent of freefall'.
You make the same mistake as him Labtop. I only presume you are not well versed with scientific analysis and so don't know where errors are relevant.
Originally posted by LaBTop
About your explosion text : did you miss the video's of -BoneZ- and the one I posted, where you can hear in both, a distinct VERY LOW FREQUENCY rumble about 1 second before the east penthouse roof starts to sink away. (when you use a quality headset.)
If you listen to them on your tv-set speakers or flatscreen speakers, you will hear nothing of it at all, so, get that headset.
Do you perhaps want to say that that must have been the "snapping" of column 79 ? As NIST tries to let us believe.
If anything it would likely be the results of the several floor bays collapsing. A column snapping makes noise, but we have little evidence of the failure mode of column #79 so assuming a type of fracture would seem premature. Still, your subsequent paragraph indicates that it likely isn't structural:
Because my next question to you, and Vipertech too b.t.w., will be why we then do not hear a thirty fold louder rumble, when the roof line starts to sink 8.5 seconds later, at the moment we may assume that all internal columns must have "snapped" too.
The answer is likely that the sound results are spurious, and do not represent immediate building events.
So, your whole remark :
...
is nullified by the simple fact that we all can hear these ULF rumbles 1 sec before collapse initiation, and no distinct sound at all when the whole damn building collapses with all its columns and beams giving way.
Which must have been quite a loud event when standing near it.
But those two camera's only picked up that rumble, no more, at just a few blocks away.
That renders your whole remark void and wrong, the simple facts from reality as can be seen and heard in those video's.
No Labtop, it does not render anything null and void, and in fact you're using no logic whatsoever here. You're simply assuming that this sound is from explosives with no evidence, and then ignoring the fact that there are no other corresponding sounds to explain all the other explosives you invoke.
You're just trying to dismiss my point without any evidence whatsoever.
TB's have such a huge brisance, i.o.w. shattering force, since they have explosive speeds of 22,000 meters per second and more.
That should tell those posters who keep saying that a TB is just another Fuel/Air bomb that they are dead wrong, F/A's have much lower (5 x)explosion speeds. The right TB, a directional one, disc or ring shaped, can shatter a steel column like if it was a falling crystal glass.
This is just devolving into pure fantasy. None of this is remotely true. A thermobaric explosion does produce a large shockwave, but a shockwave does not result in steel shattering as if it was glass. This is down to force imparted and the properties of the steel. Nor does it cause a low frequency rumble. This is C4, an extremely brisant explosive:
Notice the use of earplugs at 100m away. This is in fact less explosive than would be needed to break a single column and there is no low frequency rumble whatsoever.
Are you perhaps now going to believe what I tell you all for so long already, that TB's have an ULF sound stamp. Also when experiencing them from close by. And you live to tell.
Nobody is going to believe you Labtop because this is an entirely invented 'fact'. It has no basis in reality and you've never found a single reference to support it. Any explosion that has a resultant expansion velocity greater than that of sound in air will produce a shockwave. A shockwave doesn't directly have a defined pitch, it has an amplitude and a rate of change. This is why larger explosives often sound lower, as there is greater movement of air and so this ramp up can be wider and smoother. It doesn't in any way reduce the amplitude of the shockwave.
Those first (huge amount of time in any collapse) 2.5 seconds free-fall depict at least 8 floors worth of no resistance at all encountered by the top portion falling down.
That's ONLY possible when you use EXPLOSIVES, or hydraulic jacks, which do not rumble at all...
And when those floors are out of the way, all the rest after those 2.5 secs is a gravitational event. If no further charges were used to ''lead'' the building's outer shell.
The freefall period is not first by any means. It occurs some seconds into the collapse already. This is what easily disproves the use of explosives. How would they use explosives after the building had already begun collapsing? Indeed in this case some 6-8 seconds after a large portion had already collapsed into it.
If your theory was accurate, then we would expect to see an instant transition from stationary to freefall acceleration, but this appears only in Chandler's data because of his poor collection. All other data refutes this.
Originally posted by LaBTop
The NIST plot in that indymedia.org.uk image link is by the way nearly exactly identical to the Chandler one, the only difference is, that NIST added some extra mumbo-jumbo, and plotted from left to right, while Chandler plotted from right to left on their time lines.
Chandler did not plot from right to left. This again shows you do not understand the figures you are looking at. NIST plotted velocity on a positive scale. Chandler plotted velocity on a negative scale. The difference is not left to right or right to left, it is positive vs negative.
NIST has vehemently defended its first position that no free fall at all occurred, in fact that only 40 percent of it ever was reached.
Meaningless speculation informed only by the person who is advocating this position. Hardly convincing.
A collapsing building CAN NOT fall through itself, whithout slowing down, and thus resulting in an upward ''knick'' in the plotted graph line.
David has somewhere else explained that he took PIXELS in a HD version, to plot his graph. His method was very precise.
You're right, so the damage must have been done before this freefall period. This is consistent with NISTs theory. Chandler's measurements are not accurate at all unless you want to believe the building literally jumped in the air beforehand. Please stop relying on him as if he was some sort of expert. He's a maths teacher, not a physics professor and his software is used to teach schoolchildren. Not for rigorous scientific analysis. There are no full HD videos of collapse that I am aware of and I have 8 or 9 of them total from NIST's Cumulus database.
I have carefully and accurately told you why Chandler's presentation is bogus. Instead of taking these points on board you have simply decided that no, Chandler is your god and you will believe whatever he tells you. Despite the fact that we can see how poor his measurement software is you refuse to believe it. You add margins of error that don't exist and would be so large they would entirely defeat the point, and you instantly doubt all other analysis in favour of the one you have selected.
This is not an honest way of investigating Labtop. I don't think I'll be extending you the same courtesy again until you present some quality evidence to support your case.
Please view my comments in this other thread where Exponent also posted this.
Start with this post with my comments to his comments on David Chandler"s video I posted :
www.abovetopsecret.com...
Start with this post with my comments to his comments on David Chandler"s video I posted :
www.abovetopsecret.com...
Exp.: Chandler did not plot from right to left. This again shows you do not understand the figures you are looking at. NIST plotted velocity on a positive scale. Chandler plotted velocity on a negative scale. The difference is not left to right or right to left, it is positive vs negative.
LT: I was not looking at the graphs, I was typing along while thinking, so yes, it was the downward velocity that was differently shown.
I still favor David Chandler's method, since I see immediately a building falling downwards in his graph, from top of the graph to its bottom, just as WTC 7 fell. The method NIST used is not logical in terms of visualization. They succeeded to confuse me, -smile-.
LT: NIST has vehemently defended its first position that no free fall at all occurred, in fact that only 40 percent of it ever was reached.
Exp.: Meaningless speculation informed only by the person who is advocating this position. Hardly convincing.
LT: So, you show that you selectively listened to his words around 3:18:30 and on to 3:21:10, since he explained quite thoroughly that NIST in all its Draft Reports used a stopwatch to measure the time between two points in time, instead of plotting one reference point over that time. And that they even falsified the start time, as he shows with a short video where you clearly can see that they started the stopwatch when the roof did not move at all for quite some time, before that roof sunk down and the real downward motion should have been started to be clocked.
That's simply stealing extra data points "my dear Watson". To corrupt the report they are writing for us all, and that we should be able to trust. My trust was gone after that.
LT: A collapsing building CAN NOT fall through itself, whithout slowing down, and thus resulting in an upward ''knick'' in the plotted graph line.
David has somewhere else explained that he took PIXELS in a HD version, to plot his graph. His method was very precise.
Exp.: You're right, so the damage must have been done before this freefall period[1]. This is consistent with NISTs theory[2]. Chandler's measurements are not accurate at all unless you want to believe the building literally jumped in the air beforehand[3]. Please stop relying on him as if he was some sort of expert. He's a maths teacher, not a physics professor and his software is used to teach schoolchildren. Not for rigorous scientific analysis[4]. There are no full HD videos of collapse that I am aware of and I have 8 or 9 of them total from NIST's Cumulus database.[5]
I have carefully and accurately told you why Chandler's presentation is bogus. Instead of taking these points on board you have simply decided that no, Chandler is your god and you will believe whatever he tells you. Despite the fact that we can see how poor his measurement software is you refuse to believe it. You add margins of error that don't exist and would be so large they would entirely defeat the point, and you instantly doubt all other analysis in favour of the one you have selected.
This is not an honest way of investigating Labtop. I don't think I'll be extending you the same courtesy again until you present some quality evidence to support your case[6].
[1] Well, now you have to ad-in my seismic graph image, and then I invite you to explain the far greater amplitudes BEFORE any movement on the building could be seen. That huge pack of peaks before Cianca took his photo in New York of that east penthouse roof sinking down, the very first evidence of any movement in or outside WTC 7.
[2] No, it's not, at all. One steel column 79 breaking can not imprint more energy on a seismic recording of that event, than the following breaking of about 50 steel columns and many more steel beams in a few seconds.
If you really believe that, well, a lost case to science.
[3] Yes, I see some up and down movements at the top of his graph, and yes, I expect them, since that penthouse did not start to sink by magic, but by aided explosives that broke the roof structure.
[4] You totally miss the fact that NIST believed him and his software, and I see him use more, and more reliable data points, than NIST did in their Final WTC 7 Report. 12 to 10.
[5] There are several new videos unearthed after July 2006. Do not make mistakes, NIST is not the sole video holder on this planet. And believe me, there are some pretty sharp videos held in safes in a few embassies in Washington.
(I bet you will concentrate on remarks like this. -smile-)
[6] And now I have carefully and accurately told you that nearly all of your comments on David Chandler's video presentation at Toronto were totally misplaced, misleading and wrong. His measurement software can easily stand the comparison with NIST's, and is more accurate. You tried to play down his importance, but you failed miserably.
I would normally not use such harsh words, but I think you know what you do
Originally posted by exponent
Exp.: If anything it would likely be the results of the several floor bays collapsing. A column snapping makes noise, but we have little evidence of the failure mode of column #79 so assuming a type of fracture would seem premature. Still, your subsequent paragraph indicates that it likely isn't structural:
LT: Because my next question to you, and Vipertech too b.t.w., will be why we then do not hear a thirty fold louder rumble, when the roof line starts to sink 8.5 seconds later, at the moment we may assume that all internal columns must have "snapped" too.
Exp.: The answer is likely that the sound results are spurious, and do not represent immediate building events.
You know of course that that is a very weak argument, when considering the immense sounds from that running cameraman who's camera recorded the collapse of the South Tower. This tower was half as high, and you think no noise was generated during collapse to reach that camera at minimum 4 blocks away? But probably much further.
All in all, that was definitely not a single column snapping sound, that deep rumble, just 1 second before the penthouse roof started to sink down, the first visible movement at all at the WTC, just before 17:20:30 PM.
Do not forget the speed of sound in air, every 333 meters cost 1 sec. Thus, you hear that rumble, that traveled at least one second to the camera, then you see 1 sec later, the movement on the roof, that means that the rumble event took place in WTC 7 at least 2 secs before the roof moved from that east penthouse.
-snip-
LT: Have you forgotten about my WTC 7 seismic graph again? That's my evidence.
And all the Rick Siegel 911Eyewitness videos I lately posted in the three threads I'm now active in.
With all those same deep rumbles in them, from 13 secs before the collapses of the two other towers.
And the disappointing crackling sound from cutter charges can't be heard 4 blocks or more away, and within a maze of high rises.
You see a building sink down, but you hear nothing of it, except a low deep rumble nearly not to be heard in the onset of that video. Don't you find that not even remotely strange?
LT: Of course not, since it is not a TB....RDX and C4 have explosion speeds of max 9,000 meters/sec.
TB's more than 22,000 m/sec.
Another nickname for it is a Vacuum bomb. The vacuum sucks the surrounding air back in while using its 20% oxygen, the air where the sound just started to travel in, a kind of sound suckback effect. A Muffler.
Go listen to the Russian videos on YouTube, of these huge ones. And see the very fine dust after the detonation.
Blow up a big strong plastic bag with Acetylene gas and Oxygen gas used in cutting &welding. Put first a long lunt in it and knot the sack tightly close, then stick the burner head in it and fill it. Knot it tight again around the lunt. Then ignite the very long lunt (long, or you ignite the leaking gas prematurely, which is no fun at all when too near.) A thin line of gasoline also works as ignitor. After you lit it at the end.
Now, that"s a very deep rumble you and all your neighbors just heard, no, felt in fact mainly in their stomachs. And this is just the simplest form of a gas bomb. All windows still intact? Keep a very long safe distance. Do this only in a park or big meadow.
Well, there is no online available literature about still highly classified TB's, they are protected as if they were atomic bomb knowledge, and the YouTube videos are not TB's, they are just F/A's. Only the very few huge Russian ones, but they are recorded from so far away that they have no significance for this discussion. Tens of kilometers.
But you are free to think whatever you think is right.
Exp.: No Labtop, it does not render anything null and void, and in fact you're using no logic whatsoever here. You're simply assuming that this sound is from explosives with no evidence, and then ignoring the fact that there are no other corresponding sounds to explain all the other explosives you invoke.
You're just trying to dismiss my point without any evidence whatsoever.
LT: Have you forgotten about my WTC 7 seismic graph again? That's my evidence.
And all the Rick Siegel 911Eyewitness videos I lately posted in the three threads I'm now active in.
With all those same deep rumbles in them, from 13 secs before the collapses of the two other towers.
And the disappointing crackling sound from cutter charges can't be heard 4 blocks or more away, and within a maze of high rises.
You see a building sink down, but you hear nothing of it, except a low deep rumble nearly not to be heard in the onset of that video. Don't you find that not even remotely strange?
LT: TB's have such a huge brisance, i.o.w. shattering force, since they have explosive speeds of 22,000 meters per second and more.
That should tell those posters who keep saying that a TB is just another Fuel/Air bomb that they are dead wrong, F/A's have much lower (5 x)explosion speeds. The right TB, a directional one, disc or ring shaped, can shatter a steel column like if it was a falling crystal glass.
Exp.: This is just devolving into pure fantasy. None of this is remotely true. A thermobaric explosion does produce a large shockwave, but a shockwave does not result in steel shattering as if it was glass. This is down to force imparted and the properties of the steel. Nor does it cause a low frequency rumble. This is C4, an extremely brisant explosive:
Notice the use of earplugs at 100m away. This is in fact less explosive than would be needed to break a single column and there is no low frequency rumble whatsoever.
LT: Of course not, since it is not a TB....RDX and C4 have explosion speeds of max 9,000 meters/sec.
TB's more than 22,000 m/sec.
Another nickname for it is a Vacuum bomb. The vacuum sucks the surrounding air back in while using its 20% oxygen, the air where the sound just started to travel in, a kind of sound suckback effect. A Muffler.
Go listen to the Russian videos on YouTube, of these huge ones. And see the very fine dust after the detonation.
Blow up a big strong plastic bag with Acetylene gas and Oxygen gas used in cutting &welding. Put first a long lunt in it and knot the sack tightly close, then stick the burner head in it and fill it. Knot it tight again around the lunt. Then ignite the very long lunt (long, or you ignite the leaking gas prematurely, which is no fun at all when too near.) A thin line of gasoline also works as ignitor. After you lit it at the end.
Now, that"s a very deep rumble you and all your neighbors just heard, no, felt in fact mainly in their stomachs. And this is just the simplest form of a gas bomb. All windows still intact? Keep a very long safe distance. Do this only in a park or big meadow.
LT: Are you perhaps now going to believe what I tell you all for so long already, that TB's have an ULF sound stamp. Also when experiencing them from close by. And you live to tell.
Exp.: Nobody is going to believe you Labtop because this is an entirely invented 'fact'. It has no basis in reality and you've never found a single reference to support it. Any explosion that has a resultant expansion velocity greater than that of sound in air will produce a shockwave. A shockwave doesn't directly have a defined pitch, it has an amplitude and a rate of change. This is why larger explosives often sound lower, as there is greater movement of air and so this ramp up can be wider and smoother. It doesn't in any way reduce the amplitude of the shockwave.
Well, there is no online available literature about still highly classified TB's, they are protected as if they were atomic bomb knowledge, and the YouTube videos are not TB's, they are just F/A's. Only the very few huge Russian ones, but they are recorded from so far away that they have no significance for this discussion. Tens of kilometers.
But you are free to think whatever you think is right.
reply to post by exponent
All other data? I see you only write about Femr's data, but you admit up to now, to not know yet how he got it or used it. So it's out of use, at least for now.
The only other one is NIST, which is in my opinion less precise than David's data. He used far more data points, so to be honest, his method used more visual data points. And I am sure he used the same technique as I did, load the video in a damn good HD screen, expand the picture as far as you can while keeping your eye on one specific pixel, and then plot this pixel on its way down.
LT: At last a basis to discuss some strange events :
1. We see a huge pack of peaks on the seismogram. Then a period of about 6 secs before the second pack of peaks arrive.
2. We hear 1 sec before the first movement on top of WTC 7 into that video, this deep rumbling sound.
In fact it was 2 secs before, inside WTC 7, since there was a delay of at least 333 meters to the camera, which is equal to about 1 extra second.
3. NIST has determined that after the first small roof movement it took another 8.5 secs before the whole roof-rim started to sink down into global collapse, which also is the start of David Chandler"s 2.5 secs free fall period.
After that, we see a clear resistance from the bottom part of WTC 7 in his and also in NIST its graphs.
Can someone check these 8.5 secs in that ULF video? To see if it really took 8.5 secs from that first small roof sinking moment, to the big roof sinking moment.
This sequence of events is about the only really interesting problem left for me, the rest is fully clear to me :
First booomm inside, presumably causing the first seismic huge pack of peaks,
then 2 secs later the small roof sinks,
then 6 - 2 = 4 secs later something happened inside that registered on that seismogram as the arrival of the next smaller pack of peaks,
then (8.5 - 4) = 4.5 secs later the big roof started to sink,
then 2.5 secs free fall, which means that 8 floors were as good as gone inside, somewhere out of all video-sight,
then a gravitational resisted further fall-down all the way to the 4th floor CONED station's capping dome of very heavy beams and columns, and then the ground.
When this whole upper portion touches the ground (or the rock in the lowest basement), its mass causes it to crush in on itself caused by the sudden halting of the first arriving floor debris.
Since about 8 floors were not giving any resistance, we must start to think of all the columns and beams in the 4th floor up to the 12th as suddenly being absent, which caused that curious 2.5 secs free fall period in the onset of the global collapse.
Let's try to find out what and why.
LT: Those first (huge amount of time in any collapse) 2.5 seconds free-fall depict at least 8 floors worth of no resistance at all encountered by the top portion falling down.
That's ONLY possible when you use EXPLOSIVES, or hydraulic jacks, which do not rumble at all...
And when those floors are out of the way, all the rest after those 2.5 secs is a gravitational event. If no further charges were used to ''lead'' the building's outer shell.
Exp.: The freefall period is not first by any means. It occurs some seconds into the collapse already. This is what easily disproves the use of explosives. How would they use explosives after the building had already begun collapsing? Indeed in this case some 6-8 seconds after a large portion had already collapsed into it.
If your theory was accurate, then we would expect to see an instant transition from stationary to freefall acceleration, but this appears only in Chandler's data because of his poor collection. All other data refutes this.
All other data? I see you only write about Femr's data, but you admit up to now, to not know yet how he got it or used it. So it's out of use, at least for now.
The only other one is NIST, which is in my opinion less precise than David's data. He used far more data points, so to be honest, his method used more visual data points. And I am sure he used the same technique as I did, load the video in a damn good HD screen, expand the picture as far as you can while keeping your eye on one specific pixel, and then plot this pixel on its way down.
LT: At last a basis to discuss some strange events :
1. We see a huge pack of peaks on the seismogram. Then a period of about 6 secs before the second pack of peaks arrive.
2. We hear 1 sec before the first movement on top of WTC 7 into that video, this deep rumbling sound.
In fact it was 2 secs before, inside WTC 7, since there was a delay of at least 333 meters to the camera, which is equal to about 1 extra second.
3. NIST has determined that after the first small roof movement it took another 8.5 secs before the whole roof-rim started to sink down into global collapse, which also is the start of David Chandler"s 2.5 secs free fall period.
After that, we see a clear resistance from the bottom part of WTC 7 in his and also in NIST its graphs.
Can someone check these 8.5 secs in that ULF video? To see if it really took 8.5 secs from that first small roof sinking moment, to the big roof sinking moment.
This sequence of events is about the only really interesting problem left for me, the rest is fully clear to me :
First booomm inside, presumably causing the first seismic huge pack of peaks,
then 2 secs later the small roof sinks,
then 6 - 2 = 4 secs later something happened inside that registered on that seismogram as the arrival of the next smaller pack of peaks,
then (8.5 - 4) = 4.5 secs later the big roof started to sink,
then 2.5 secs free fall, which means that 8 floors were as good as gone inside, somewhere out of all video-sight,
then a gravitational resisted further fall-down all the way to the 4th floor CONED station's capping dome of very heavy beams and columns, and then the ground.
When this whole upper portion touches the ground (or the rock in the lowest basement), its mass causes it to crush in on itself caused by the sudden halting of the first arriving floor debris.
Since about 8 floors were not giving any resistance, we must start to think of all the columns and beams in the 4th floor up to the 12th as suddenly being absent, which caused that curious 2.5 secs free fall period in the onset of the global collapse.
Let's try to find out what and why.
These are the interim reports that NIST has removed from their 9/11 online NCSTAR repository pages.
Especially that 2006 seismic one, NIST NCSTAR 1-6G was interesting.
The Gilzans one too. And the Con Ed in WTC 7.
They were all highly informational, but out of reach now. WHY?
Even when they were declared provisional, that is no reason to let them disappear.
All that honest work for nothing? That's criminal corrupt behavior by NIST end editors.
Any one who saved these, keep them in a safe place, for later use.
And post them here or anywhere else.
reply to post by LaBTop
Its not gone.
Its in the Homeland Security Digital Library.
NIST NCSTAR 1-6G
www.hsdl.org/?view&did=462456
on google it is a pdf format
Its not gone.
Its in the Homeland Security Digital Library.
NIST NCSTAR 1-6G
www.hsdl.org/?view&did=462456
on google it is a pdf format
reply to post by exponent
Damnit. Forgot his first comments post.
LT: I understand that you think NIST and Femr used a 3d simulation or such that they fed into a program, kindly provide me with links to Femr's methods.
NIST used the same principal method as David, I presume, after viewing both their graphs. (further on below)
David used one reference point at the top corner and magnified its pixels, then followed one of those pixels frame by frame. Please tell me what is so bad in that technique, especially since he and NIST arrive at nearly identical results.
David said already in his lecture, that NIST falsified their results, by first starting their stopwatch to clock their "whole" fall period far before real movement of their reference point(s?) began, and they introduced a smooth slope at the onset of collapse, which is not there at all.
Check it yourself, magnify the video screen to as big as you still can see its pixels, and WATCH.! And look at Davids plotting, he plotted far more data points than NIST, and finds the same sudden change at onset you will find.
Besides, it doesn't matter at all for the free fall period, and that's what really matters. No resistance during that free fall, WHAT? That should start some big bells ringing in your brain. Hear anything yet?
If not, defend your stance on the free fall matter, but try to come with better arguments this time.
How utterly strange ain't it so, that the NIST graph and Davids graph (both further below) are so damn nearly identical. And if his method was so sloppy, why was NIST forced to re-do their free fall method calcs, and concluded thereafter, that David Chandler was RIGHT. After a lot of peer pressure, by the way. They sure as hell searched for every kind of wriggling out of the debate, just as you now demonstrated by trying to ridicule David and his method. You did not succeed, that's for sure. A multi million US agency was forced to accept what you try to ridicule, enough said. This kind of nitpicking is alike to "Beating a dead horse".
The fact that David and NIST alike arrived at the same 2.5 secs free fall period, does only mean one thing for sure : there was no resistance of any importance over a length of 8 floors (+/- 100 feet) at the start of global collapse. And how on earth you are going to explain that to us WITHOUT EXPLOSIVES, beat me to it....
LT: You found his graph, you're the one to provide his method regarding a WTC 7 graph by him.
To my knowledge, ATS does not forbid to link to any forum. Dodging my question does not help your arguments to become true. And tell me, why don't you simply offer that forum's name....?
-more-
Damnit. Forgot his first comments post.
Exp.: The links I offered are comparative graphs to show that Chandler's analysis is not well supported by the community. Both Femr and NIST characterize the collapse in quite similar manners. A gradual onset of deflection, followed by a rough descent of 8 floors at free-fall acceleration, followed by a gradual deceleration.
Chandler's data on the other hand shows an immediate transition from unmoving to moving and as he uses a linear fit he gets only a single characteristic of the collapse. This is primarily down to bad technique as he uses an overly simple program not designed for this task, and plots the positions by hand.
LT: I understand that you think NIST and Femr used a 3d simulation or such that they fed into a program, kindly provide me with links to Femr's methods.
NIST used the same principal method as David, I presume, after viewing both their graphs. (further on below)
David used one reference point at the top corner and magnified its pixels, then followed one of those pixels frame by frame. Please tell me what is so bad in that technique, especially since he and NIST arrive at nearly identical results.
David said already in his lecture, that NIST falsified their results, by first starting their stopwatch to clock their "whole" fall period far before real movement of their reference point(s?) began, and they introduced a smooth slope at the onset of collapse, which is not there at all.
Check it yourself, magnify the video screen to as big as you still can see its pixels, and WATCH.! And look at Davids plotting, he plotted far more data points than NIST, and finds the same sudden change at onset you will find.
Besides, it doesn't matter at all for the free fall period, and that's what really matters. No resistance during that free fall, WHAT? That should start some big bells ringing in your brain. Hear anything yet?
If not, defend your stance on the free fall matter, but try to come with better arguments this time.
How utterly strange ain't it so, that the NIST graph and Davids graph (both further below) are so damn nearly identical. And if his method was so sloppy, why was NIST forced to re-do their free fall method calcs, and concluded thereafter, that David Chandler was RIGHT. After a lot of peer pressure, by the way. They sure as hell searched for every kind of wriggling out of the debate, just as you now demonstrated by trying to ridicule David and his method. You did not succeed, that's for sure. A multi million US agency was forced to accept what you try to ridicule, enough said. This kind of nitpicking is alike to "Beating a dead horse".
The fact that David and NIST alike arrived at the same 2.5 secs free fall period, does only mean one thing for sure : there was no resistance of any importance over a length of 8 floors (+/- 100 feet) at the start of global collapse. And how on earth you are going to explain that to us WITHOUT EXPLOSIVES, beat me to it....
Exp.: Femr doesn't particularly write articles that I know of, he discusses the results of his analysis on another forum I don't believe I'm permitted to link. I'm sure you can look him up easily though.
LT: You found his graph, you're the one to provide his method regarding a WTC 7 graph by him.
To my knowledge, ATS does not forbid to link to any forum. Dodging my question does not help your arguments to become true. And tell me, why don't you simply offer that forum's name....?
-more-
Exp.: Femr does indeed show the 2.5 second freefall period. It is that portion of the graph where the black line is underneath the horizontal line. This period actually shows that there is a period of faster than freefall, although it's not clear if this is calibration, measurement or real. This analysis is done with the same rough principles as Chandler, but with significantly greater rigor. Using computer matching with larger numbers of samples calibrated from many videos. It's a technique that I would expect to be used by experts and Femr does seem to wield it well. I have no idea why you don't think it includes a freefall period but it clearly does.
LT: Femr's graph :
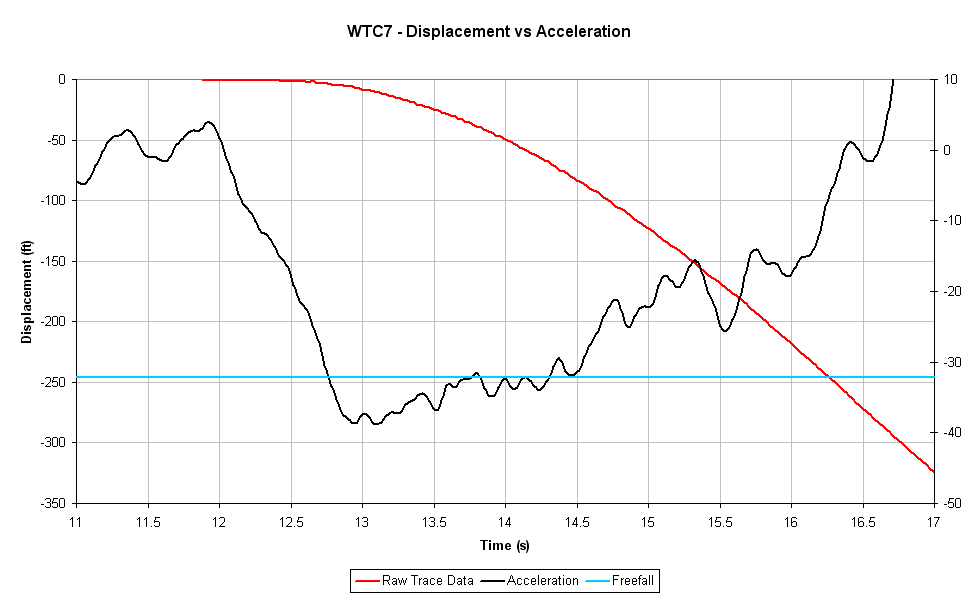
I saw indeed his dipping under the blue free-fall line, and you are right that he shows a free-fall period. Which is not the 2.5 secs David and NIST showed, it's 1.75 seconds.
I thus asked you why he starts at 11 secs on his time-line. And explained that I expect anyone discussing the NIST WTC 7 report to start at the Cianca moment and define that as the zero point at a free fall graph. So, I assumed he found another free fall period, but can't check it, since you seem not to be able to lead me to his texts accompanying his graph. Again, what forum does he post in?
I find his graph highly interesting for its seemingly more accurate "acceleration" plotting, and want to know how he defined his right Y-axis values and why he starts at an eleven secs position on his X-axis.
By the way, did you observe that his plotted "acceleration" line starts crossing the blue horizontal "free fall" line nearly at the same place where his red "raw trace data" line starts bulging down? That means he calculated about the same moment as David Chandler for the onset of the free fall period.
His "raw trace data" red line is showing however the same smoothing down as NIST (according to David "mistakenly" ) showed in their 2008 graph.
That's why I need his texts, so I can find out what exact method he used for WTC 7, not for WTC 1 or 2. However, I am of course also curious how his North and South tower graphs look.
Exp.: NIST hardly 'admitted Chandler was right'. NIST included a graph in their final report that shows indeed there was very little (saying zero is inaccurate) structural resistance in that period.
LT: That's a form of pure nitpicking I classify as a disgrace to your own intellect. Be a man and admit David found something you didn't, I didn't, and nobody had the guts, if they did, to confront the whole NIST colossus on their own turf, and forced them to admit their method was wrong, and his was RIGHT.
You, David Chandler, have my highest possible RESPECT.!
LT: Chandler mentioned also that his graph line fell within the one second uncertainty error margin of the software he used, so I don't understand that you missed that. ------
Exp.: There's no 'one second uncertainty margin'. We are talking about a total period of 2.5s, if there is a one second uncertainty then the rate of acceleration is uncertain to more than 2m/s/s. How then could he possibly claim it would be 'within a few percent of freefall'.
You make the same mistake as him Labtop. I only presume you are not well versed with scientific analysis and so don't know where errors are relevant.
LT: Observe my words : "his graph line fell within the one second uncertainty error margin of the software "
Now go contemplate who of us makes mistakes.
You are the one who has no real grip on error importance. PERIOD.
NIST and David both talked about the comparison factor between pure free fall and observed free fall speed in their calculations.
NIST found an R[square]=0.9906, while pure free fall has an R[square]=1.0000.
That's a difference of 0.0094.......One percent would be 0.0100, they found thus a 0.94 % deviation of pure gravity free fall.
Capice?
edit on 24/12/12 by LaBTop because: Forgot the first [
Originally posted by GenRadek
reply to post by LaBTop
Its not gone.
Its in the Homeland Security Digital Library.
NIST NCSTAR 1-6G
www.hsdl.org/?view&did=462456
on Google it is a PDF format
It's still gone. Your link leads to NIST NCSTAR 1-1 (Draft).
A search in that PDF on the word 'seismic' delivered 0 hits, and a manual search found no 1-6G draft report. No Dr. Kim, nothing seismic related even.
For a moment you had me excited there.
Next try. Show your skill, find the damn thing, and the two others too.
EDIT: This is the link to the now existing page where another NIST NCSTAR 1-6G report can be found, which offers a totally different subject for many years already. There are no traces left of these seismic reports.
It makes me proud, since it means they are still damn afraid of my thesis and graph.
Those of you who don't find this very peculiar behavior of a US agency like NIST, are asleep at the helm.
edit on 24/12/12 by LaBTop because:
See EDIT
Re-read my post at page 11. Re-view the linked video's.
Especially the " WTC 7: Sound Evidence for Explosions " video.
In the post's first video, "The FREE-FALL ACCELERATION of WTC Building 7", David shows a graph with that free fall period in. It is however not the same as the one he showed at the Toronto hearing, that one used even more data points. And is more precise.
This one : files.abovetopsecret.com...

The funny thing is, that the graph produced by NIST in their 2008 Final WTC 7 Report, shows even a nearly perfect free fall period line with a RxR value of nearly 1 (0.9906), the straight red line drawn by a disgruntled NIST researcher. I suppose he had enough from the dishonest nature of that NIST WTC 7 report.
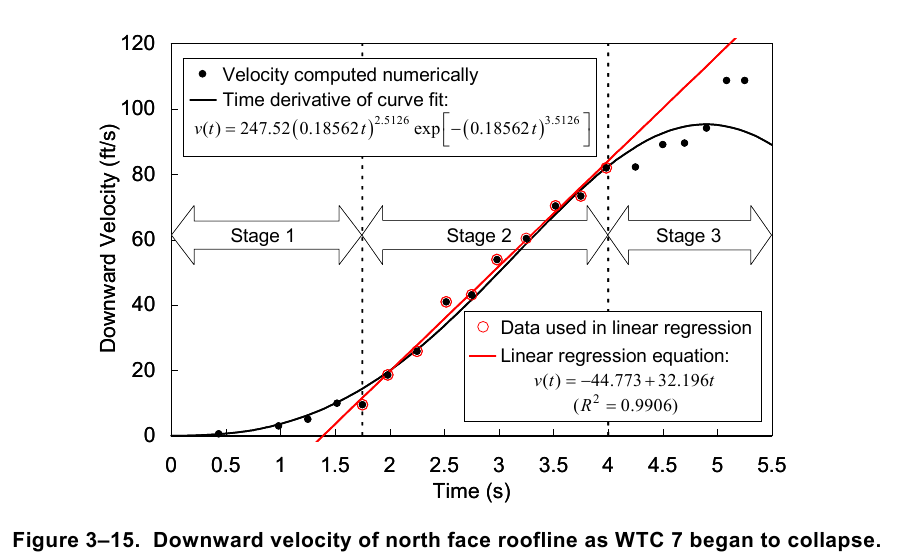
That red line is showing a better approximation to free fall, than the line in Davids video graph, while David used 12 data points in his Toronto lecture, and NIST only 10, and still NIST came closer to free fall.
That's REAL peer review : NIST checked David's thesis and came to the same conclusion, with even more precise results.
SO tell me, why will NIST not show us the same courtesy, and give us full access to their databases, for PEER REVIEW ?
Anyone slightly academically formed knows instantly that such behavior means they have to hide things. Were ordered to hide them......
Such as the WTC 7 collapse free fall period they tried for many years to hide by using their first grader, stopwatch method. What a disgrace to science that is.
I have the feeling you did not listen to Davids lecture explanations with an open mind and an attitude to learn and comprehend.
Davids words from 3hrs:13min:00sec into the video :
CLICK to start at his explanations.
To where his lecture stops at 3hrs:27min:42sec into the video :
CLICK again to get to the end, where you can slide the YT-slider back to hear his most convincing arguments.
Now would be a good time to admit that believers listen, view and read material very selectively.
Especially the " WTC 7: Sound Evidence for Explosions " video.
In the post's first video, "The FREE-FALL ACCELERATION of WTC Building 7", David shows a graph with that free fall period in. It is however not the same as the one he showed at the Toronto hearing, that one used even more data points. And is more precise.
This one : files.abovetopsecret.com...
The funny thing is, that the graph produced by NIST in their 2008 Final WTC 7 Report, shows even a nearly perfect free fall period line with a RxR value of nearly 1 (0.9906), the straight red line drawn by a disgruntled NIST researcher. I suppose he had enough from the dishonest nature of that NIST WTC 7 report.
That red line is showing a better approximation to free fall, than the line in Davids video graph, while David used 12 data points in his Toronto lecture, and NIST only 10, and still NIST came closer to free fall.
That's REAL peer review : NIST checked David's thesis and came to the same conclusion, with even more precise results.
SO tell me, why will NIST not show us the same courtesy, and give us full access to their databases, for PEER REVIEW ?
Anyone slightly academically formed knows instantly that such behavior means they have to hide things. Were ordered to hide them......
Such as the WTC 7 collapse free fall period they tried for many years to hide by using their first grader, stopwatch method. What a disgrace to science that is.
I have the feeling you did not listen to Davids lecture explanations with an open mind and an attitude to learn and comprehend.
Davids words from 3hrs:13min:00sec into the video :
CLICK to start at his explanations.
To where his lecture stops at 3hrs:27min:42sec into the video :
CLICK again to get to the end, where you can slide the YT-slider back to hear his most convincing arguments.
Now would be a good time to admit that believers listen, view and read material very selectively.
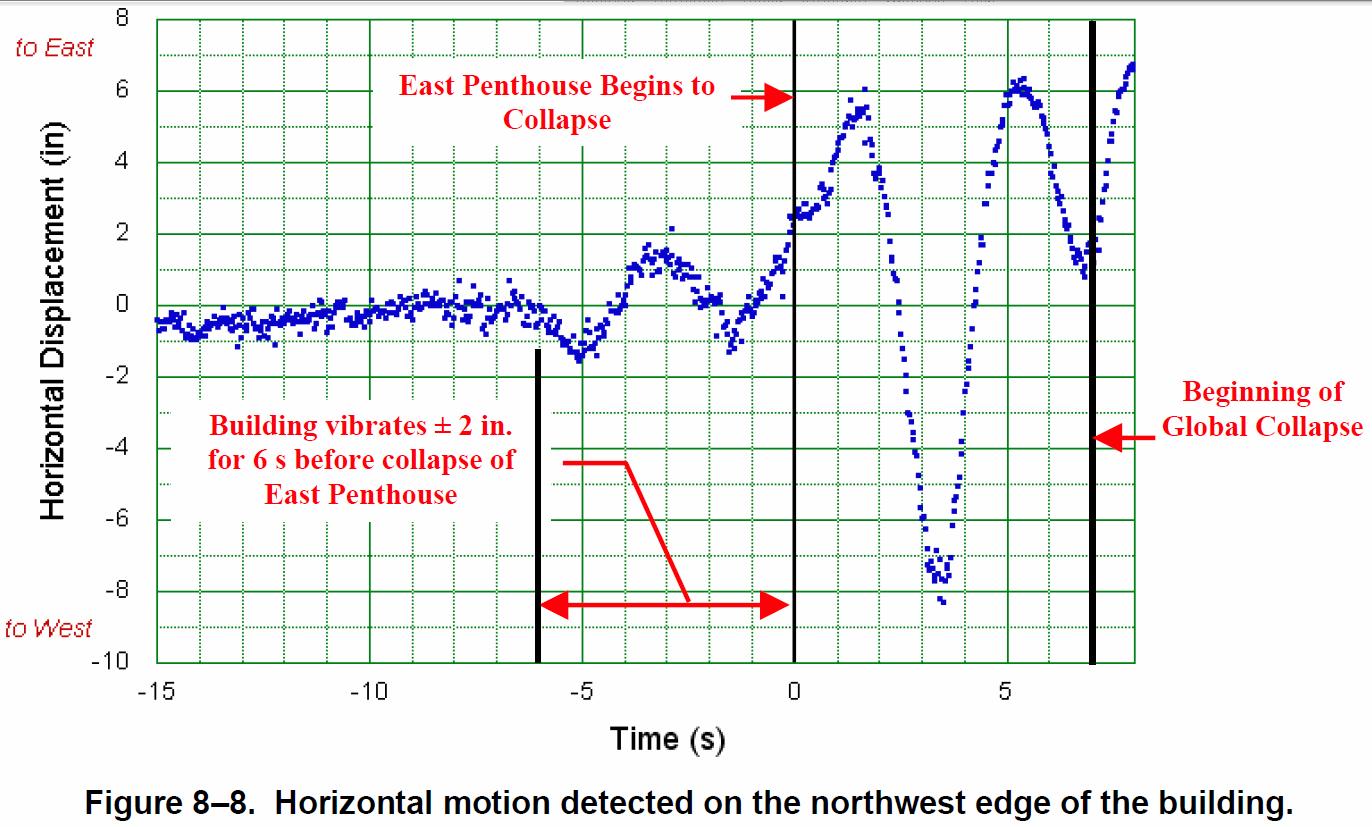
This is another displacement chart made by NIST, using the same data gathering method as for the final free fall calculation, so to see. Horizontal
motion detection :

This is the
page to login at HSDL, to access the full collections with the search words 'NIST NCSTAR 1-6G '.
Isn't that strange, that a simple seismic revision report has to be buried behind such fascist fences?
However, I have a feeling you will not find it there either.
I begin to ask myself how Dr. Kim and his LDEO colleagues are fairing.
Access to the Homeland Security Digital Library
Access to the HSDL Collection and the News Digest Collection
Most Homeland Security Digital Library (HSDL) resources are not openly available to the public at large. Full access to the HSDL Collection and the News Digest Collection is available to homeland security officials and academics for research, analysis, and policy and strategy development. Access is offered to U.S. citizens who are:
federal, state, tribal, and local U.S. government officials;
members of the U.S. military;
homeland security researchers and academics; or
security staff protecting organizations vital to U.S. infrastructure.
There are two options for getting full access to the HSDL Collection and the News Digest Collection. You may want to utilize both.
An individual account is a password-protected account, specific to you, that you can use anywhere, any time. With an individual account, you can take advantage of special and personalized features such as Email Alerts and My Lists; both are ways to access and organize information according to your requirements. An individual account is required for those who request access the Restricted Collection. Request an individual account now (link will take you to the NPS Center for Homeland Defense and Security website).
Organization-wide access allows eligible U.S. military installations, U.S. government agencies, and U.S. research institutions direct access to the HSDL without a login. Access is limited to the specified IPs or domain of that organization (e.g., a building or a campus). Please contact [email protected] for further information regarding this type of access.
Access to the Restricted Collection
Access to the Restricted Collection is limited to U.S. government officials (at the local, state, tribal or federal level) and active members of the U.S. military. Users requesting access must have an individual HSDL account and be granted an additional level of authorization. To obtain this access, either login above with an existing account or begin by requesting an individual account. Once that account is confirmed, return and request access to the Restricted Collection.
Isn't that strange, that a simple seismic revision report has to be buried behind such fascist fences?
However, I have a feeling you will not find it there either.
I begin to ask myself how Dr. Kim and his LDEO colleagues are fairing.
reply to post by LaBTop
Damnit! I need to appologize to Exponent, I just see....
I seem to have a blind spot for the words "one percent" and "one second"...
Thus, my fault, my typo.
I hope you understand now, and perhaps you understood then, that I meant the one percent fault margin of that software, as David said in his lecture.
Damnit! I need to appologize to Exponent, I just see....
I seem to have a blind spot for the words "one percent" and "one second"...
LT: Observe my words : "his graph line fell within the one second uncertainty error margin of the software "
Now go contemplate who of us makes mistakes.
You are the one who has no real grip on error importance. PERIOD.
NIST and David both talked about the comparison factor between pure free fall and observed free fall speed in their calculations.
NIST found an R[square]=0.9906, while pure free fall has an R[square]=1.0000.
That's a difference of 0.0094.......One percent would be 0.0100, they found thus a 0.94 % deviation of pure gravity free fall.
Capice?
Thus, my fault, my typo.
I hope you understand now, and perhaps you understood then, that I meant the one percent fault margin of that software, as David said in his lecture.
new topics
-
Putin, Russia and the Great Architects of the Universe
ATS Skunk Works: 2 hours ago -
A Warning to America: 25 Ways the US is Being Destroyed
New World Order: 6 hours ago
top topics
-
President BIDEN's FBI Raided Donald Trump's Florida Home for OBAMA-NORTH KOREA Documents.
Political Conspiracies: 12 hours ago, 29 flags -
A Warning to America: 25 Ways the US is Being Destroyed
New World Order: 6 hours ago, 12 flags -
Las Vegas UFO Spotting Teen Traumatized by Demon Creature in Backyard
Aliens and UFOs: 17 hours ago, 7 flags -
Is AI Better Than the Hollywood Elite?
Movies: 14 hours ago, 4 flags -
Maestro Benedetto
Literature: 14 hours ago, 1 flags -
Putin, Russia and the Great Architects of the Universe
ATS Skunk Works: 2 hours ago, 1 flags
active topics
-
Krystalnacht on today's most elite Universities?
Social Issues and Civil Unrest • 6 • : FlyersFan -
Gaza Terrorists Attack US Humanitarian Pier During Construction
Middle East Issues • 41 • : 19Bones79 -
Hate makes for strange bedfellows
US Political Madness • 50 • : 19Bones79 -
Weinstein's conviction overturned
Mainstream News • 28 • : burritocat -
Sunak spinning the sickness figures
Other Current Events • 25 • : Ohanka -
University of Texas Instantly Shuts Down Anti Israel Protests
Education and Media • 272 • : burritocat -
Cats Used as Live Bait to Train Ferocious Pitbulls in Illegal NYC Dogfighting
Social Issues and Civil Unrest • 24 • : NoviceStoic4 -
A Warning to America: 25 Ways the US is Being Destroyed
New World Order • 13 • : 2025yuga -
Is AI Better Than the Hollywood Elite?
Movies • 19 • : GENERAL EYES -
ChatGPT Beatles songs about covid and masks
Science & Technology • 24 • : iaylyan