It looks like you're using an Ad Blocker.
Please white-list or disable AboveTopSecret.com in your ad-blocking tool.
Thank you.
Some features of ATS will be disabled while you continue to use an ad-blocker.

Quake Watch 2012
page: 131share:
reply to post by JohnVidale
Yes, Thank you. I am not anywhere near as knowledgeable than others who post in this thread.
But I was wondering about the mantle and if there is a difference in the type of material it is made of and whether there is a difference in how hot it gets or stays hot. Im not very good at explaining whats in my head, but I think I'm kinda on the right track.
Thank you again for your reply.
edit on 9-5-2012 by crappiekat because: (no reason given)
reply to post by muzzy
Thank you for your reply Muzzy. That was good.
I was reading about subduction zones and I got to thinking about why in some area's quakes were so deep and why. I thought about heat and then that got me thinking about what the mantle was made of. I kind of understand, but I have to go back and read some more.
Today in Iceland
Whole country - earthquakes during the last 48 hours
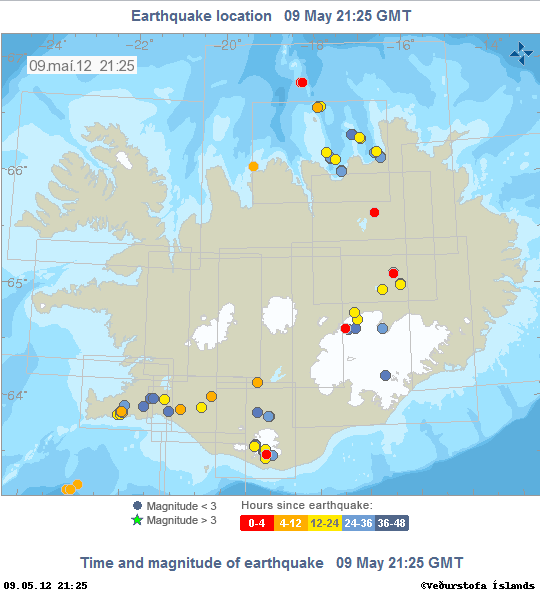
Earthquake count:
Magnitude less than 1 in all: 60
Magnitude 1 to 2 in all: 13
Magnitude 2 to 3 in all: 3
Magnitude more than 3 in all: 0
Total: 76
Looks like something is brewing, or what?
Whole country - earthquakes during the last 48 hours
Earthquake count:
Magnitude less than 1 in all: 60
Magnitude 1 to 2 in all: 13
Magnitude 2 to 3 in all: 3
Magnitude more than 3 in all: 0
Total: 76
Looks like something is brewing, or what?
Originally posted by Hithe Merinos
Today in Iceland
Whole country - earthquakes during the last 48 hours
Earthquake count:
Magnitude less than 1 in all: 60
Magnitude 1 to 2 in all: 13
Magnitude 2 to 3 in all: 3
Magnitude more than 3 in all: 0
Total: 76
Looks like something is brewing, or what?
They have some very large, unpronounceable volcanoes there.
Is this similar to the activity prior to the eruptions that shut down air traffic over Europe? It would be a shame to interrupt the Olympics(tm).
reply to post by crappiekat
Basically, the deep quakes are located where there are tectonic subduction zones. That is, where cold mantle is sinking, and it is still cold enough to be brittle and break in earthquakes rather than silently flowing, as it will do when it heats up to the usual temperatures in the mantle.
Basically, the deep quakes are located where there are tectonic subduction zones. That is, where cold mantle is sinking, and it is still cold enough to be brittle and break in earthquakes rather than silently flowing, as it will do when it heats up to the usual temperatures in the mantle.
reply to post by Hithe Merinos
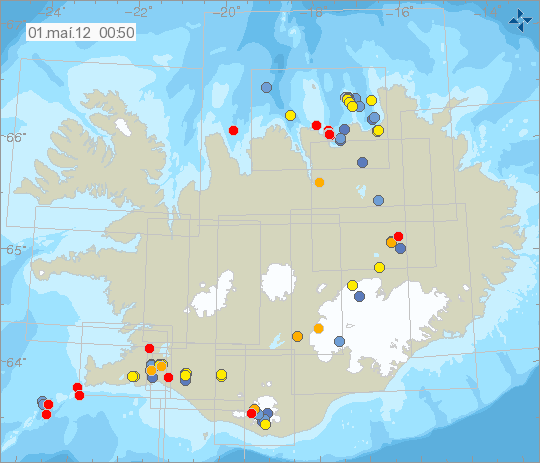
I think mine is prettier than yours, mind it is a bit older. Of course I could find some with really pretty reds all over them if I was to open up my archives.
I think the answer to that is "or what"
By the way it is spring and the icecaps are melting. The glacial load in lightening and this causes earthquakes. Happens again in October(ish) when the ice caps grow again.
Here is a link for a video I just made of the All Iceland maps for May 2011. Take a look as it hits May 21st in particular.
All_Iceland_May_2011.wmv 771 Kb
I think mine is prettier than yours, mind it is a bit older. Of course I could find some with really pretty reds all over them if I was to open up my archives.
Looks like something is brewing, or what?
I think the answer to that is "or what"
By the way it is spring and the icecaps are melting. The glacial load in lightening and this causes earthquakes. Happens again in October(ish) when the ice caps grow again.
Here is a link for a video I just made of the All Iceland maps for May 2011. Take a look as it hits May 21st in particular.
All_Iceland_May_2011.wmv 771 Kb
edit on 9/5/2012 by PuterMan because: (no reason given)
reply to post by JohnVidale
hi John,
Say,.. we have a few people on ATS makin predictions and havin bad "vibes" about a quake comin,,
Soon... like now till the 20th o may
any thoughts?
Say,.. we have a few people on ATS makin predictions and havin bad "vibes" about a quake comin,,
Soon... like now till the 20th o may
any thoughts?
reply to post by crappiekat
Depth , and Pressure!
Heres a pdf of a 2007 quake that has a cross section on it, you can see the shape of the Pacific Plate edge down to 660km or so
hazards.cr.usgs.gov...
is this the area you are talking about?
edit: heres an old sketch by GNS
www.gns.cri.nz...
if you have the bandwith available (23MB)
this is an awesome pdf map with cross sections right around the SW Pacific
hazards.cr.usgs.gov...
I just love those pdf maps that USGS put out, if you are into them too heres the ftp page where you can download them.hazards.cr.usgs.gov...
Rather than click each one to see what its about, probably easier to do a search for the date on Wiki or ANSS to see what it is first.
This one is about the Arkansas Swarm of 2010 hazards.cr.usgs.gov...
Depth , and Pressure!
Heres a pdf of a 2007 quake that has a cross section on it, you can see the shape of the Pacific Plate edge down to 660km or so
hazards.cr.usgs.gov...
is this the area you are talking about?
edit: heres an old sketch by GNS
www.gns.cri.nz...
edit on 9-5-2012 by muzzy
because: (no reason given)
if you have the bandwith available (23MB)
this is an awesome pdf map with cross sections right around the SW Pacific
hazards.cr.usgs.gov...
edit on 9-5-2012 by muzzy because: (no reason
given)
I just love those pdf maps that USGS put out, if you are into them too heres the ftp page where you can download them.hazards.cr.usgs.gov...
Rather than click each one to see what its about, probably easier to do a search for the date on Wiki or ANSS to see what it is first.
This one is about the Arkansas Swarm of 2010 hazards.cr.usgs.gov...
edit on 9-5-2012 by muzzy
because: (no reason given)
reply to post by Lil Drummerboy
LilDrummerBoy
No credible precursors are visible to me. Unfortunately, every day has about the same odds as every other day, unless a big quake just happened.
LilDrummerBoy
No credible precursors are visible to me. Unfortunately, every day has about the same odds as every other day, unless a big quake just happened.
edit on 10-5-2012 by JohnVidale because: (no reason given)
reply to post by muzzy
Nice maps Muzzy. Since you are without a doubt the resident expert on the SNZO squiggles what do you think of this one?
That is Easter Island, but considering how far away from SNZO Easter Island is that seems a very large spike for a 5.2 (mb) I would have put that (at the distance) as probably a 5.9 Mw to 6.0 Mw.
It even shows in New Mexico quite well. (And on many others)
Don't look like no 5.2 to me.
Here is is from Las Campanas, Chile.
Answering my own question:
Geofon 5.9
Of course EMSC is following the Master as usual with 5.2mb: Pathetic really.
Russia also showing 5.2mb - but then they are wanting to cooperate with the US on space-flight.
LDEO
Once again the complete BS of not being able to calculate on a common scale (Mw) becomes apparent again. If SCARDEC and GeoFon and LDEO can do it so can USGS and EMSC but they don't and I think there is an agenda there.
As I have said before, after JVs comment on the reliability of Mw where there is a small set or low magnitude, better to publish on a common scale and give a value for certainty as well as publish the mb than to ignore the Mw and let people who are not aware think it was a 5.2
Either ALL mb or ALL Mw but preferably both in all instances with a certainty weighting if you like, or use mb < mb 5.0 and calculate Mw for ALL mb > 5.0. It is not difficult, it just requires a little methodical application. Oh wait, these are scientists.......
So when they count for the statistics what do USGS use?
(Eye newt, toe of frog, hair of a virgin.............hubble bubble...........)
Nice maps Muzzy. Since you are without a doubt the resident expert on the SNZO squiggles what do you think of this one?
That is Easter Island, but considering how far away from SNZO Easter Island is that seems a very large spike for a 5.2 (mb) I would have put that (at the distance) as probably a 5.9 Mw to 6.0 Mw.
It even shows in New Mexico quite well. (And on many others)
Don't look like no 5.2 to me.
Here is is from Las Campanas, Chile.
Answering my own question:
Geofon 5.9
Of course EMSC is following the Master as usual with 5.2mb: Pathetic really.
Russia also showing 5.2mb - but then they are wanting to cooperate with the US on space-flight.
LDEO
2012 5 10 2 13 52.0 -29.50 -112.50 33.0 5.9 EASTER ISLAND REGION
Once again the complete BS of not being able to calculate on a common scale (Mw) becomes apparent again. If SCARDEC and GeoFon and LDEO can do it so can USGS and EMSC but they don't and I think there is an agenda there.
As I have said before, after JVs comment on the reliability of Mw where there is a small set or low magnitude, better to publish on a common scale and give a value for certainty as well as publish the mb than to ignore the Mw and let people who are not aware think it was a 5.2
Either ALL mb or ALL Mw but preferably both in all instances with a certainty weighting if you like, or use mb < mb 5.0 and calculate Mw for ALL mb > 5.0. It is not difficult, it just requires a little methodical application. Oh wait, these are scientists.......
So when they count for the statistics what do USGS use?
(Eye newt, toe of frog, hair of a virgin.............hubble bubble...........)
edit on 10/5/2012 by PuterMan because: (no reason given)
Scrapped the post: Having a bad hair day! I think Firefox is steadily getting as bad as IE because the problems with the USGS interactive page are not
apparent in Chrome.
edit on 10/5/2012 by PuterMan because: (no reason given)
reply to post by PuterMan
PuterMan, I believe that you may have uncovered the problem...it's their FORMULA...they're not checking to make sure that they're actually acquiring 100% PURE hair of virgin!
Unless you pick and bag your own, you'll be scammed 99% of the time
(Eye newt, toe of frog, hair of a virgin.............hubble bubble...........)
PuterMan, I believe that you may have uncovered the problem...it's their FORMULA...they're not checking to make sure that they're actually acquiring 100% PURE hair of virgin!
Unless you pick and bag your own, you'll be scammed 99% of the time
Originally posted by SpaceJockey1
reply to post by PuterMan
(Eye newt, toe of frog, hair of a virgin.............hubble bubble...........)
PuterMan, I believe that you may have uncovered the problem...it's their FORMULA...they're not checking to make sure that they're actually acquiring 100% PURE hair of virgin!
Unless you pick and bag your own, you'll be scammed 99% of the time
Duh! Of course! I should have considered that.
In the meantime they are up to their usual tricks changing mb to Mw (see they can do it if they get the right type of virgin). Maybe they think no one will notice? Wrong! PuterMan will.
This was 5.6 mb and is now 6.0 Mw
On this occasion obviously the European virgin's hair was pure as EMSC always did have it at 6.0 Mw
Here is another one changed from 5.8mb to 6.0Mw and again EMSC always had it at that.
edit on 10/5/2012 by PuterMan because: (no reason given)
reply to post by muzzy
Thank you muzzy. I just got this. Have alot to look at. But yes this is what I was talking about.
Thank you muzzy. I just got this. Have alot to look at. But yes this is what I was talking about.
Two more new Mag 6+ for April
M6.1 - off the west coast of northern Sumatra
M6.0 - off the west coast of northern Sumatra
These are Ms but since Ms compares well to Mw
Both of these are completely new additions and were not listed al lower values previously.
And another one not previously listed
M6.0 - Taitung City, Taiwan
Someone else had better check these out in case I am reading things wrong. I don't see any of these 3 previously listed at all.
And one previously listed at 5.9
M6.0 - Bandon, Oregon (off coast of Oregon)
EMSC always had this as 6.0 Mw
M6.0 - Santa Isabel, Mexico (Gulf Of California) down to 6.0 from 6.2.
but M7.0 - Santa Isabel, Mexico (Gulf Of California) is up to 7.0 from 6.9.
M6.1 - off the west coast of northern Sumatra
M6.0 - off the west coast of northern Sumatra
These are Ms but since Ms compares well to Mw
Both of these are completely new additions and were not listed al lower values previously.
And another one not previously listed
M6.0 - Taitung City, Taiwan
Someone else had better check these out in case I am reading things wrong. I don't see any of these 3 previously listed at all.
And one previously listed at 5.9
M6.0 - Bandon, Oregon (off coast of Oregon)
EMSC always had this as 6.0 Mw
edit on 10/5/2012 by PuterMan because: (no reason given)
M6.0 - Santa Isabel, Mexico (Gulf Of California) down to 6.0 from 6.2.
but M7.0 - Santa Isabel, Mexico (Gulf Of California) is up to 7.0 from 6.9.
edit on 10/5/2012 by PuterMan because: (no reason given)
reply to post by PuterMan
why would it take a month for them to finally list those if they were not previously listed? any clue?
why would it take a month for them to finally list those if they were not previously listed? any clue?
3.7 here in East Texas!! Not cool!! Too close for comfort...I should have felt it but I did not.. ?? Anyone else close to me that felt this
here???
earthquake.usgs.gov...
earthquake.usgs.gov...
new topics
-
Gov Kristi Noem Shot and Killed "Less Than Worthless Dog" and a 'Smelly Goat
2024 Elections: 41 minutes ago -
Falkville Robot-Man
Aliens and UFOs: 55 minutes ago -
James O’Keefe: I have evidence that exposes the CIA, and it’s on camera.
Whistle Blowers and Leaked Documents: 1 hours ago -
Australian PM says the quiet part out loud - "free speech is a threat to democratic dicourse"...?!
New World Order: 2 hours ago -
Ireland VS Globalists
Social Issues and Civil Unrest: 2 hours ago -
Biden "Happy To Debate Trump"
Mainstream News: 3 hours ago -
RAAF airbase in Roswell, New Mexico is on fire
Aliens and UFOs: 3 hours ago -
What is the white pill?
Philosophy and Metaphysics: 5 hours ago -
Mike Pinder The Moody Blues R.I.P.
Music: 5 hours ago -
Putin, Russia and the Great Architects of the Universe
ATS Skunk Works: 8 hours ago
top topics
-
A Warning to America: 25 Ways the US is Being Destroyed
New World Order: 13 hours ago, 21 flags -
Biden "Happy To Debate Trump"
Mainstream News: 3 hours ago, 7 flags -
Mike Pinder The Moody Blues R.I.P.
Music: 5 hours ago, 7 flags -
What is the white pill?
Philosophy and Metaphysics: 5 hours ago, 5 flags -
Australian PM says the quiet part out loud - "free speech is a threat to democratic dicourse"...?!
New World Order: 2 hours ago, 5 flags -
James O’Keefe: I have evidence that exposes the CIA, and it’s on camera.
Whistle Blowers and Leaked Documents: 1 hours ago, 5 flags -
RAAF airbase in Roswell, New Mexico is on fire
Aliens and UFOs: 3 hours ago, 4 flags -
Ireland VS Globalists
Social Issues and Civil Unrest: 2 hours ago, 4 flags -
Putin, Russia and the Great Architects of the Universe
ATS Skunk Works: 8 hours ago, 3 flags -
Falkville Robot-Man
Aliens and UFOs: 55 minutes ago, 1 flags
active topics
-
Candidate TRUMP Now Has Crazy Judge JUAN MERCHAN After Him - The Stormy Daniels Hush-Money Case.
Political Conspiracies • 801 • : Vermilion -
Australian PM says the quiet part out loud - "free speech is a threat to democratic dicourse"...?!
New World Order • 3 • : Athetos -
Gov Kristi Noem Shot and Killed "Less Than Worthless Dog" and a 'Smelly Goat
2024 Elections • 17 • : WeMustCare -
Biden "Happy To Debate Trump"
Mainstream News • 35 • : WeMustCare -
University of Texas Instantly Shuts Down Anti Israel Protests
Education and Media • 297 • : cherokeetroy -
-@TH3WH17ERABB17- -Q- ---TIME TO SHOW THE WORLD--- -Part- --44--
Dissecting Disinformation • 699 • : Thoughtful3 -
Putin, Russia and the Great Architects of the Universe
ATS Skunk Works • 25 • : SchrodingersRat -
Ditching physical money
History • 22 • : StudioNada -
Falkville Robot-Man
Aliens and UFOs • 3 • : KKLOCO -
Krystalnacht on today's most elite Universities?
Social Issues and Civil Unrest • 10 • : xuenchen