It looks like you're using an Ad Blocker.
Please white-list or disable AboveTopSecret.com in your ad-blocking tool.
Thank you.
Some features of ATS will be disabled while you continue to use an ad-blocker.

Research Article A comparison of tropical temperature trends with model predictions
page: 11
share:
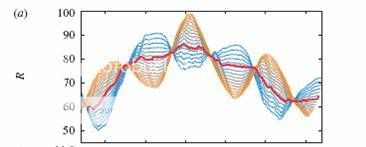
I wanted to show this, which is not the only evidence that supports the fact that GCMs are flawed, and shouldn't be relied on.
www3.interscience.wiley.com...
Research Article
A comparison of tropical temperature trends with model predictions
David H. Douglass 1 *, John R. Christy 2, Benjamin D. Pearson 1 a, S. Fred Singer 3 4
1Department of Physics and Astronomy, University of Rochester, Rochester, NY 14627, USA
2Department of Atmospheric Science and Earth System Science Center, University of Alabama in Huntsville, Huntsville, AL 35899, USA
3Science and Environmental Policy Project, Arlington, VA 22202, USA
4University of Virginia, Charlottesville, VA 22903, USA
email: David H. Douglass ([email protected])
*Correspondence to David H. Douglass, Department of Physics and Astronomy, University of Rochester, Rochester, NY 14627, USA.
aCurrent address: VWR International, 5100 W. Henrietta Rd., Rochester, NY 14692, USA.
Keywords
climate trend • troposphere • observations
Abstract
We examine tropospheric temperature trends of 67 runs from 22 Climate of the 20th Century model simulations and try to reconcile them with the best available updated observations (in the tropics during the satellite era). Model results and observed temperature trends are in disagreement in most of the tropical troposphere, being separated by more than twice the uncertainty of the model mean. In layers near 5 km, the modelled trend is 100 to 300% higher than observed, and, above 8 km, modelled and observed trends have opposite signs. These conclusions contrast strongly with those of recent publications based on essentially the same data. Copyright © 2007 Royal Meteorological Society
www3.interscience.wiley.com...
Oh, goodie. At least you're leaving the interpretations to scientists, lol. Although, it's a questionable classification for Fred Singer these days.
The next step is to be able to take a particular interpretation and see its weaknesses and to accept that peer review is little more than a necessary
step towards quality control in science - necessary but not sufficient.
Okie dokie. Although they claim that the problem is with the models, that isn't the only interpretation.
Firstly, it could be the observations used in the article. This wasn't the first time that Singer, Christy, Douglass et al have published such stuff to later be reamed for using unreliable data and crap maths. Last time they used the Spencer & Christy UAH satellite data to make claims of discrepencies between other data. It was published and paraded around like a head on stick in the expected places by the usual suspects, only later to find that poor Spencer and Christy had a few issues with basic maths. On correcting the data, no problem. Now notice how I don't claim shennanigans, mistakes happen.
Secondly, it could be a crap paper with crap statistics, and essentially a load of crap.
In fact, it is both. I can show you why if you're willing to listen.
And, finally, if Fred Singer says the sky is blue, I'd check out the window
[edit on 29-4-2009 by melatonin]
looks like everybody has a few pet adversaries, no matter which point of view....
i'm afraid deviating results here and there won't do, GW will eventually either be confirmed by immediately obvious signs like 30' sea level rise, monsoon rains in Stockholm and a viable North West passage - or it will be refuted.
by that time we will all be long dead (2100AD ?), so we will never find out whether we embraced a couple of highly detrimental rackets while trying to tackle a legitimate concern or were simply conned.
'Cause if there's one thing i know it's that even with goodwill bonus, at least half of what's flying the flag of GW is an exercise in destructive futility.
Originally posted by Long Lance
looks like everybody has a few pet adversaries, no matter which point of view....
i'm afraid deviating results here and there won't do, GW will eventually either be confirmed by immediately obvious signs like 30' sea level rise, monsoon rains in Stockholm and a viable North West passage - or it will be refuted.
by that time we will all be long dead (2100AD ?), so we will never find out whether we embraced a couple of highly detrimental rackets while trying to tackle a legitimate concern or were simply conned.
'Cause if there's one thing i know it's that even with goodwill bonus, at least half of what's flying the
flag of GW is an exercise in destructive futility.
There are signs that icebergs are melting from underwater volcanoes. I gave several links to this, but like always sir Melatonin thinks he knows best than real scientists who have been studying this.
Oh, and of course, he dismisses, and denies anything and everyhting that refutes his AGW religion. He tries anything and everything to even undermine those who bring forward evidence of the farce of Global Warming.
As for interpretation, I always leave the interpretation to what the scientists say and not to you (melatonin) who likes to twist everything, or deny it just because "melatonin" says so.
[edit on 29-4-2009 by ElectricUniverse]
Originally posted by melatonin
.......................
Secondly, it could be a crap paper with crap statistics, and essentially a load of crap.
In fact, it is both. I can show you why if you're willing to listen.
And, finally, if Fred Singer says the sky is blue, I'd check out the window
The only crapola is what comes from Hansen and company. Hansen has been caught at least twice accepting errors int the data because it showed a bias towards warming, and presenting the errors as evidence of Global Warming.
You better get your facts straight if you want to discuss this topic seriously. Your dismissing of everything which contradicts your religion only shows you are a charlatan and nothing more.
[edit on 29-4-2009 by ElectricUniverse]
Originally posted by Long Lance
looks like everybody has a few pet adversaries, no matter which point of view....
Well, if you want to cheerlead Singer, ugh.
This is the dude who hounded an ill and dying Roger Revelle to put his name on a paper Singer wrote and has shilled for a range of industry interests, from tobacco to CFCs to oil industry.
A pretty despicable creature. I have at least some respect (not much of course) for Spencer and Christy, although they are still shilling deniers they do more than bleat and shill.
Originally posted by ElectricUniverse
You better get your facts straight if you want to discuss this topic seriously. Your dismissing of everything which contradicts your religion only shows you are a charlatan and nothing more.
bwhahahaha.
I guess you're happy to wallow in ignorance. But for anyone who is interested in why the Douglass article was a waste of journal space...
Research Article
Consistency of modelled and observed temperature trends in the tropical troposphere
B. D. Santer 1 *, P. W. Thorne 2, L. Haimberger 3, K. E. Taylor 1, T. M. L. Wigley 4, J. R. Lanzante 5, S. Solomon 6, M. Free 7, P. J. Gleckler 1, P. D. Jones 8, T. R. Karl 9, S. A. Klein 1, C. Mears 10, D. Nychka 4, G. A. Schmidt 11, S. C. Sherwood 12, F. J. Wentz 10
1Program for Climate Model Diagnosis and Intercomparison (PCMDI), Lawrence Livermore National Laboratory, Livermore, CA 94550, USA
2U.K. Meteorological Office Hadley Centre, Exeter, EX1 3PB, UK
3Department of Meteorology and Geophysics, University of Vienna, Althanstrasse 14, A-1090, Vienna, Austria
4National Center for Atmospheric Research, Boulder, CO 80307, USA
5National Oceanic and Atmospheric Administration/Geophysical Fluid Dynamics Laboratory, Princeton, NJ 08542, USA
6National Oceanic and Atmospheric Administration/Earth System Research Laboratory, Chemical Sciences Division, Boulder, CO 80305, USA
7National Oceanic and Atmospheric Administration/Air Resources Laboratory, Silver Spring, MD 20910, USA
8Climatic Research Unit, School of Environmental Sciences, University of East Anglia, Norwich, NR4 7TJ, UK
9National Oceanic and Atmospheric Administration/National Climatic Data Center, Asheville, NC 28801, USA
10Remote Sensing Systems, Santa Rosa, CA 95401, USA
11NASA/Goddard Institute for Space Studies, New York, NY 10025, USA
12Yale University, New Haven, CT 06520, USA
email: B. D. Santer ([email protected])
*Correspondence to B. D. Santer, Program for Climate Model Diagnosis and Intercomparison (PCMDI), Lawrence Livermore National Laboratory, Livermore, CA 94550, USA.
Keywords
tropospheric temperature changes • climate model evaluation • statistical significance of trend differences • tropical lapse rates • differential warming of surface and temperature
Abstract
A recent report of the U.S. Climate Change Science Program (CCSP) identified a potentially serious inconsistency between modelled and observed trends in tropical lapse rates (Karl et al., 2006). Early versions of satellite and radiosonde datasets suggested that the tropical surface had warmed more than the troposphere, while climate models consistently showed tropospheric amplification of surface warming in response to human-caused increases in well-mixed greenhouse gases (GHGs). We revisit such comparisons here using new observational estimates of surface and tropospheric temperature changes. We find that there is no longer a serious discrepancy between modelled and observed trends in tropical lapse rates.
This emerging reconciliation of models and observations has two primary explanations. First, because of changes in the treatment of buoy and satellite information, new surface temperature datasets yield slightly reduced tropical warming relative to earlier versions. Second, recently developed satellite and radiosonde datasets show larger warming of the tropical lower troposphere. In the case of a new satellite dataset from Remote Sensing Systems (RSS), enhanced warming is due to an improved procedure of adjusting for inter-satellite biases. When the RSS-derived tropospheric temperature trend is compared with four different observed estimates of surface temperature change, the surface warming is invariably amplified in the tropical troposphere, consistent with model results. Even if we use data from a second satellite dataset with smaller tropospheric warming than in RSS, observed tropical lapse rate trends are not significantly different from those in all other model simulations.
Our results contradict a recent claim that all simulated temperature trends in the tropical troposphere and in tropical lapse rates are inconsistent with observations. This claim was based on use of older radiosonde and satellite datasets, and on two methodological errors: the neglect of observational trend uncertainties introduced by interannual climate variability, and application of an inappropriate statistical consistency test. Copyright © 2008 Royal Meteorological Society
Received: 25 March 2008; Revised: 18 July 2008; Accepted: 20 July 2008
linky to full article
There are another handful of articles that show the Douglass article to be tripe. The second time; they seem to be making a habit of it. But just getting such tripe past peer review is sufficient for their purposes - they are not speaking to the scientific community
What was interesting is that although they had the updated version of the radiosonde data available, they decided to use the older unreliable data and then compound that with bad maths. Hmm, that's what they did last time as well, as I said, making a habit of it...
[edit on 29-4-2009 by melatonin]
Originally posted by melatonin
Well, if you want to cheerlead Singer, ugh.
This is the dude who hounded an ill and dying Roger Revelle to put his name on a paper Singer wrote and has shilled for a range of industry interests, from tobacco to CFCs to oil industry.
A pretty despicable creature. I have at least some respect (not much of course) for Spencer and Christy, although they are still shilling deniers they do more than bleat and shill.
A shill of the Global Warming multi-billion dollar industry is trying to attack scientists who contradict with evidence his religious idiocracy of AGW. Who would have thought....
Originally posted by melatonin
bwhahahaha.
I guess you're happy to wallow in ignorance. But for anyone who is interested in why the Douglass article was a waste of journal space...
Naaa, I am not the one who parrots away at his own parrot because only an animal will allow itself to "wallow" in the ignorance that the mere name Melatonin spells, not to mention the crapola he spouts everyday.
Research Article
Consistency of modelled and observed temperature trends in the tropical troposphere
B. D. Santer 1 *, P. W. Thorne 2, L. Haimberger 3, K. E. Taylor 1, T. M. L. Wigley 4, J. R. Lanzante 5, S. Solomon 6, M. Free 7, P. J. Gleckler 1, P. D. Jones 8, T. R. Karl 9, S. A. Klein 1, C. Mears 10, D. Nychka 4, G. A. Schmidt 11, S. C. Sherwood 12, F. J. Wentz 10
...............
Wow...so after scientists, and the public are finding out more, and more evidence that GCMs are flawed, and at this point people should realise they have been rigged like this to try to shove down everyone's throat the lies of AGW; now the multi-billion dollar industry claims that they are now using observational "ESTIMATES" to back the lies of AGW?...
Humm, I wonder towards which bias these observational ESTIMATES will point to...
I guess the dozens, if not more "peer-reviewed" reports that show without a doubt that GCMs are flawed to the point that they are just used as a "mental masturbation" by a group of morons who can't allow their long dead religious AGW doctrine to finally rest, must not exist at all...
Let's go over again what the reseach from real scientists have found about GCMs.
Orographic cloud in a GCM: the missing cirrus
Journal Climate Dynamics
Publisher Springer Berlin / Heidelberg
ISSN 0930-7575 (Print) 1432-0894 (Online)
Issue Volume 24, Numbers 7-8 / June, 2005
DOI 10.1007/s00382-005-0020-9
Pages 771-780
Subject Collection Earth and Environmental Science
SpringerLink Date Monday, May 02, 2005
PDF (702.7 KB)HTMLFree Preview
Orographic cloud in a GCM: the missing cirrus
S. M. Dean1 , B. N. Lawrence2, R. G. Grainger1 and D. N. Heuff3
(1) Atmospheric Oceanic and Planetary Physics, Clarendon Laboratory, University of Oxford, Oxford, Oxfordshire, UK
(2) British Atmospheric Data Centre, Rutherford Appleton Laboratory, Chilton, Oxfordshire, UK
(3) Department of Physics and Astronomy, University of Canterbury, Christchurch, New Zealand
Received: 13 September 2004 Accepted: 25 February 2005 Published online: 27 April 2005
Abstract Observations from the International Satellite Cloud Climatalogy Project (ISCCP) are used to demonstrate that the 19-level HadAM3 version of the United Kingdom Met Office Unified Model does not simulate sufficient high cloud over land. By using low-altitude winds, from the European Centre for Medium Range Weather Forecasting (ECMWF) Re-Analysis from 1979 to 1994 (ERA-15) to predict the areas of maximum likelihood of orographic wave generation, it is shown that much of the deficiency is likely to be due to the lack of a representation of the orographic cirrus generated by sub-grid scale orography. It is probable that this is a problem in most GCMs.
www.springerlink.com...
Another of the many flaws of GCMs..
The widely accepted (albeit unproven) theory that manmade global warming will accelerate itself by creating more heat-trapping clouds is challenged this month in new research from The University of Alabama in Huntsville.
Instead of creating more clouds, individual tropical warming cycles that served as proxies for global warming saw a decrease in the coverage of heat-trapping cirrus clouds, says Dr. Roy Spencer, a principal research scientist in UAHuntsville's Earth System Science Center.
That was not what he expected to find.
"All leading climate models forecast that as the atmosphere warms there should be an increase in high altitude cirrus clouds, which would amplify any warming caused by manmade greenhouse gases," he said. "That amplification is a positive feedback. What we found in month-to-month fluctuations of the tropical climate system was a strongly negative feedback. As the tropical atmosphere warms, cirrus clouds decrease. That allows more infrared heat to escape from the atmosphere to outer space."
The results of this research were published today in the American Geophysical Union's "Geophysical Research Letters" on-line edition. The paper was co-authored by UAHuntsville's Dr. John R. Christy and Dr. W. Danny Braswell, and Dr. Justin Hnilo of Lawrence Livermore National Laboratory, Livermore, CA.
www.uah.edu...
Now, I am excerpting part of the crapola, I mean supposedly "peer-reviewed research work" that melatonin gave us.
They state in their work, and I quote:
Fingerprint research consistently
finds that natural causes alone cannot explain the
recent changes in many different aspects of the climate
system – the simplest, most internally consistent explanation
of the observations invariably involves a pronounced
human effect.
They say because the GCMs cannot explain Climate Changes, then they pull out of nowhere the claim that it must be mankind that is responsible.
Well, apparenlty the scientists who came up with this crapola, I mean supposedly "peer-reviewed research" didn't do enough research, because I know for a fact that GCMs cannot explain/account for everything in Climate Changes in the past, or even the present either.
Is that reason to immediately claim it must be mankind the one responsible, when General Circulation Models/computer models do not account for all natural factors that do affect the climate, and have been found to be flawed to say the least time, and again?...
Let me back my statement.
Koutsoyiannis, D., A. Efstratiadis, N. Mamassis, and A. Christofides, On the credibility of climate predictions, Hydrological Sciences Journal, 53 (4), 671–684, 2008.
[doc_id=864]
[English]
Geographically distributed predictions of future climate, obtained through climate models, are widely used in hydrology and many other disciplines, typically without assessing their reliability. Here we compare the output of various models to temperature and precipitation observations from eight stations with long (over 100 years) records from around the globe. The results show that models perform poorly, even at a climatic (30-year) scale. Thus local model projections cannot be credible, whereas a common argument that models can perform better at larger spatial scales is unsupported.
www.itia.ntua.gr...
[edit on 30-4-2009 by ElectricUniverse]
Originally posted by ElectricUniverse
They say because the GCMs cannot explain Climate Changes, then they pull out of nowhere the claim that it must be mankind that is responsible.
Nope, that's your inability to understand simple arguments.
The argument suggests that taking account of all known natural variables (solar etc) cannot explain recent past observations. Only by accounting for human activity can the observations be modelled. The most parsimonious and consistent explanation is that human activity has had a significant influence on recent climate change.
It's fairly simple.
The funny thing is that the research you cite suggests that models do not adequately model clouds. And that is probably the case, but it has little to do with past observations. It would be important for modelling future scenarios.
Indeed, I assume from you using Spencer & Christy that you propose that GCMs aren't modelling the potential cooling effects of cirrus cloud variation - and that affects modelling past climate how?
So, lets say there is a negative forcing that hasn't been accounted for in the models that acts in reality and therefore what? To adequately model past warming that would mean we are underestimating a positive forcing to fit the real observations.
lol
You don't see that don't you?
Say that in the models that to reconstuct past climate evidence suggests we have negative forcings developing to -2.2watts/m^2, but the positive forcings develop to +3.7watts/m^2. That accounts well for the real observations of around 1.5watts/m^2 over some past period. You are saying that we are missing a negative forcing, so the 2.2 is really say 2.5watts/m^2. The observations still show overall positive forcing of 1.5watts/m^2, so to balance and fit observations we have underestimated the positive forcings.
You see, that's how the models worked for that claim. We have the reality - the real-world observations. That is, the temperature data. Then you get a GCM, and start plugging in the variables. First they add the very best estimates of the natural variables over the period - it doesn't fit the observations. Then you also add the best estimates of human-induced variables, it does fit the observations. You want to add a negative forcing, so a positive would have to balance it to fit the real observations.
If you want to suggest that past climate has not been influenced by human activity, you need to find positive forcings...yeah, I know, volcanic activity has increased 18x since 1750 in cloud-cuckoo land, lol. Then you need to show why such a well-supported basic physical property of an important GHG suddenly disappears (along with the other human variables). Good luck with that.
[edit on 30-4-2009 by melatonin]
(emphasis mine)
Originally posted by melatonin
The argument suggests that taking account of all known natural variables (solar etc) cannot explain recent past observations. Only by accounting for human activity ...
this implies that we know everything, obviously, and leave it at that. indirect attribution leaves a lot to be desired, especially when you are basing far reaching decisions on them, they are a viable starting point, though.
imho, the most interesting of all is how every year that does not exhibit a strong hurricane season or mild winter, the subject is put on standby only interrupted by alarming signs from the poles or other remote locations, while every year there IS a weather related desaster, GW is immediately sold as the cause.
you will again deny it much like you denied that the use of GW/CC fluctuates with the weather or relegate the issue to the media, which are of course sensationalist....
PS: i care aboutt he content, not the people i'm just observing that what Hansen is to GW refuters, people like Singer are to you. heck, you may even be correct in your assessment, i can't really tell. all that's certain is that bias, partisanship, peer review and scientific impartiality won't mix very well, therefore a major scandal appears inevitable, unless we are all quite wrong.
Originally posted by Long Lance
this implies that we know everything, obviously, and leave it at that. indirect attribution leaves a lot to be desired, especially when you are basing far reaching decisions on them, they are a viable starting point, though.
Hey Lance, fancy meeting you here, lol.
Nah, it doesn't. It means that those that are known are accounted for. You can't account for unknowns. When the unknowns become known, and we know the importance of our not knowing, then we'll know to include them.
imho, the most interesting of all is how every year that does not exhibit a strong hurricane season or mild winter, the subject is put on standby only interrupted by alarming signs from the poles or other remote locations, while every year there IS a weather related desaster, GW is immediately sold as the cause.
Yeah, suppose it's true. But if you ask anyone who knows their ass from their elbow, they'll tell you that it's hard to state any single isolated event is due to global warming. It's all in the long-term data.
Hurricanes happen anyway. The trend over time is the important variable.
you will again deny it much like you denied that the use of GW/CC fluctuates with the weather or relegate the issue to the media, which are of course sensationalist....
You know me so well...
Scientists don't control the media. If they did, they wouldn't be representing faux balance on the issue.
PS: i care aboutt he content, not the people i'm just observing that what Hansen is to GW refuters, people like Singer are to you. heck, you may even be correct in your assessment, i can't really tell. all that's certain is that bias, partisanship, peer review and scientific impartiality won't mix very well, therefore a major scandal appears inevitable, unless we are all quite wrong.
Ugh, I wouldn't even compare them. When Hansen is known for harrassing dying men to put their name to something against what they spent their life's work consolidating, I'll consider the comparison. When Hansen is known for moving from issue to issue while in the pay of industry/ideological interests, I'll consider the comparison.
Singer is a serial denier and BSer, and would probably tell you the massive uncertainties in the claim that uranium causes cancer if you paid him enough. Hansen is a well-respected scientist at the top of the game who probably advocates a bit too much and is somewhat at the extreme in his position (i.e., potential outcomes) on the issue. Not as extreme as some (e.g., Lovelock), though.
The deniers gain no credibility by having such a shill on board the good ship HMS Inactivism. Indeed, if Singer's involved it's a good sign the ship's going down.
Glug, glug, glug...
[edit on 30-4-2009 by melatonin]
Originally posted by melatonin
Nope, that's your inability to understand simple arguments.
The argument suggests that taking account of all known natural variables (solar etc) cannot explain recent past observations. Only by accounting for human activity can the observations be modelled. The most parsimonious and consistent explanation is that human activity has had a significant influence on recent climate change.
It's fairly simple.
And that argument is wrong, because as I have shown GCMs DO NOT ACCOUNT FOR ALL NATURAL FACTORS..
Even then we know for a fact that the claims you keep propagating about "TSI stopped increasing decade ago", is nothing more than a lie. Just like the whole AGW hoax.
Originally posted by ElectricUniverse
And that argument is wrong, because as I have shown GCMs DO NOT ACCOUNT FOR ALL NATURAL FACTORS..
No, you showed that they may not adequately model clouds. They do model them, just not very well.
There's a difference. It's a pretty big one. On one side there is the 'do not account for' and on the other 'do account for but perhaps not ideally'.
Even then we know for a fact that the claims you keep propagating about "TSI stopped increasing decade ago", is nothing more than a lie. Just like the whole AGW hoax.
Bleh. Lockwood and Frohlich show solar trends have been down for the past 20 years or so and solar activity has barely reached the levels of the 40/50s since then. Nice, I suppose, to see you back.
Lockwood & Frohlich 2007
[edit on 30-4-2009 by melatonin]
Originally posted by melatonin
No, you showed that they may not adequately model clouds. They do model them, just not very well.
.... They do not, quit twisting what SCIENTISTS are saying.... You keep showing signs of a desperate man who doesn't know what else to do to save his religious belief...
Originally posted by melatonin
Bleh. Lockwood and Frohlich show solar trends have been down for the past 20 years or so and solar activity has barely reached the levels of the 40/50s since then. Nice, I suppose, to see you back.
Bleh...and NASA's main researcher on ACRIM satellite data, Wilson, alongside some other scientists have shown that this is nothing more than a lie...
The activity of the Sun and the TSI had been increasing, according to Wilson's research which was for 24 years, from 1978 until 2002 shows that TSI had been increasing by about 0.04-0.05% per decade, and previous research shows that the increase had been ongoing for over 100-150 years...
Give it up already with the lies...
6. Conclusions
[22] The philosophies of the ACRIM and PMOD TSI
composite constructions are very different. The ACRIM
composite uses results originally published by the science
teams of contributory experiments and the NIMBUS7/ERB
comparisons to relate ACRIM1 and ACRIM2. This
approach is based on our belief that in most cases the
science teams had unique knowledge of each experiment
that could produce results that most accurately represent
their instrumentation’s performances.
[23] The PMOD approach modifies published contributory
TSI results. Their modifications have the effect of
conforming the ACRIM1/ACRIM2 ratio to ERBS during
the ACRIM gap and matching composite TSI to the lower
values predicted by solar-proxy models during the activity
maximum of solar cycle 21.
[24] Construction of TSI composite databases will not be
without its controversies for the foreseeable future. However
we believe the ACRIM composite and trend represents
the best interpretation of the information presently available
for solar cycles 21–23.
[25] The 0.05%/decade minimum-to-minimum trend
appears to be significant. If so it has profound implications
for both solar physics and climatology. For solar physics it
means that TSI variability can be caused by unknown
mechanisms other than the solar magnetic activity cycle.
Much longer time scales for TSI variations are therefore a
possibility, which has obvious implications for solar forcing
of climate.
[26] The absence of a minima-to-minima trend in the
PMOD composite is an artifact of uncorrected ERBS
degradation. ERBS degradation during the gap equals the
trend difference and the PMOD offsets (within computational
uncertainty).
[url=http://www.acrim.com/Reference%20Files/Secular%20total%20solar%20irradiance%20trend%20during%20solar%20cycles%2021%E2%80%9323.pdf]www.acrim.com[/ url]
[edit on 2-5-2009 by ElectricUniverse]
We also have corroborating evidence from the AA index which shows that Solar magnetic activity had been increasing, which means it's overal activity
was increasing until about 2006.
www.ngdc.noaa.gov...
Not only that, but we know that since 1998 the Sun had been unleashing some of the most powerful sunspots, and Solar Flares since we have been studying the Sun with modern technology.
www.gsfc.nasa.gov...
www.spacedaily.com...
www.esa.int...
www.nasa.gov...
www.theregister.co.uk...
Scientists even had to update the scale of Sunspots because the largest ever recorded Sunspot, even larger than the one that hit Canada, and the east coast occurred in 2003, and you "melatonin" want to claim the Sun's activity has been decreasing since the 1940s, and 1950s?....
[edit on 2-5-2009 by ElectricUniverse]
MAJOR MAGNETIC STORMS 1868-2007
ACCORDING TO THE AA* CRITERIA
Because of the difference in units of presentation, the values of AA* and Ap* are not the same so that different major magnetic storm onset and end threshold values are used for the two series. However their comparison for the years of overlapping coverage show that relative frequency of occurrence of major storms per year are similar. Another reason for differences is that an index derived from magnetic perturbation values at only two observatories easily experiences larger extreme values if either input site is well situated to the overhead ionospheric and.or field aligned current systems producing the magnetic storm effects. Although not documented here, it is interesting to note that the overall level of magnetic disturbance from year to year has increased substantially from a low around 1900 Also, the level of mean yearly aa is now much higher so that a year of minimum magnetic disturbances now is typically more disturbed than years at maximum disturbance levels before 1900.
www.ngdc.noaa.gov...
Not only that, but we know that since 1998 the Sun had been unleashing some of the most powerful sunspots, and Solar Flares since we have been studying the Sun with modern technology.
NOW PLAYING AT A STAR NEAR YOU: THE LARGEST SUNSPOT IN TEN YEARS BLAZES AWAY WITH ERUPTIONS
A huge sunspot as big as the surface area of thirteen Earths is growing on the Sun and has now rotated with the Sun to face the Earth. The sunspot, in the region designated AR 9393, is the largest of the current solar cycle, making it the biggest to appear in ten years. This region also has been a prolific generator of stormy solar activity, hurling clouds of electrified gas towards Earth, producing four explosions, called flares, and spawning storms of high-speed particles in space.
The largest of the four flares occurred at 9:57 UT Thursday, March 29 and was rated as an X-class flare, the most potent designation. The other three flares were rated M-class, second only to the X-class. An eruption near AR 9393 hurled a cloud of electrified, magnetic gas towards Earth on Wednesday. This eruption, called a Coronal Mass Ejection (CME), may cause auroral (northern and southern lights) displays and magnetic storm activity when it impacts the Earth's magnetic field sometime Friday. Another Earthbound CME associated with the X-class flare was seen at 10:26 UT March 29, and is expected to arrive on Saturday.
www.gsfc.nasa.gov...
Massive Sunspot Cluster Warns Of Flare Danger
Washington - March 2, 2000 - Active sunspot regions 8882 and 8891 are very large naked-eye (BUT DON'T LOOK AT THEM DIRECTRLY) sunspot groups occupying an area near 1,000 millionths of a solar hemisphere. Region 8882 is currently the most complex magnetically and now sports a delta magnetic configuration where opposite polarity umbrae exist within a single penumbra. This configuration is the most magnetically unstable and often results in more prolific solar flaring.
There is concern that further growth or development in Region 8882 may spawn a major M or X class solar proton flare. When major flares occur in regions as large as these are, they often succeed in accelerating prodigious quantities of high-energy protons toward the Earth at near-relativistic speeds.
www.spacedaily.com...
Massive sunspot faces Earth
24 October 2003
Our Sun has been remarkably active this week. Sunspot 484, which first appeared last weekend, has grown into one of the biggest sunspots seen in years.
Now about the size of the planet Jupiter, it's easy to see. But never look directly at the sun!
Sunspots are cooler regions of the Sun where magnetic energy builds up, often prior to eruptions.
While being monitored by the ESA/NASA SOHO spacecraft, this particular sunspot let loose a storm of energetic particles, known as a 'coronal mass ejection' on Wednesday, 22 October 2003.
www.esa.int...
Earth-Directed Sunspot Now Size of 20 Earths 07.22.04
At 20 times the size of Earth, the largest sunspot observed since the fall solar storm onslaught is now pointed directly at Earth. Its unusually large size also means that it's now visible with the naked eye (although you should never look at the Sun without a proper filter). The implications of this spot have scientists on the edge of their seats - if the active region generates coronal mass ejections (CMEs), massive explosions with a potential force of a billion megaton bombs, it will be a fairly direct hit to Earth and its satellites and power grids.
Right: A view from the Michelson Doppler Imager (MDI) instrument on the SOHO spacecraft. It's a helioseismology instrument that analyzes the vibrational modes of the Sun as well as the Sun's magnetic field. Click on image for movie. Credit: NASA/ESA
The last large solar events occurred in the fall of 2003 when about 17 major flares erupted on the Sun. In this case, the region (AR 10652) has generated several medium-sized flares and CMEs over the past three and a half days. These views are from the SOHO spacecraft's MDI and EIT instruments, respectively. The EIT view shows the active regions churning out massive amounts of magnetically confined plasma in small blasts. Over the next few days, the region has the potential for unleashing more and larger solar storms.
www.nasa.gov...
Massive sunspot has Earth in its sights
Track this topic Print story Brace for impact
By Lucy Sherriff • Get more from this author
Posted in Science, 15th September 2005 15:37 GMT
Free whitepaper – Choosing the best CRM for your organization
A sunspot five times the size of Earth could wreak havoc with satellites and radio communication systems, scientists warn, as it moves across the face of the sun and Earth moves directly into its firing line.
Seven huge X-class flares have already erupted from the spot, including one of magnitude X17 last Wednesday that made it into the record books as the fourth largest ever seen.
The US National Oceanic and Atmospheric Administration (NOAA) said that the flares have already caused problems with some electric power systems, radio communications and global positioning equipment.
www.theregister.co.uk...
Scientists even had to update the scale of Sunspots because the largest ever recorded Sunspot, even larger than the one that hit Canada, and the east coast occurred in 2003, and you "melatonin" want to claim the Sun's activity has been decreasing since the 1940s, and 1950s?....
[edit on 2-5-2009 by ElectricUniverse]
Latest Sun Flare Put at X28, Strongest on Record
By Robert Roy Britt
Senior Science Writer
posted: 05 November 2003
10:01 pm ET
Update, 7:20 A.M. ET, 06 November 2003: NOAA's Space Environment Center (SEC) has classified this flare as an X28, making it in fact the strongest ever recorded. A source told SPACE.com that the SEC is aware other scientists still think the flare was even stronger. The article below remains as it originally appeared. - RRB
[size]A flare released by the Sun on Tuesday could be the most powerful ever witnessed, a monster X-ray eruption twice as strong as anything detected since satellites were capable of spotting them starting in the mid-1970s
The strongest flares on record, in 1989 and 2001, were rated at X20. This one is at least that powerful, scientists say. But because it saturated the X-ray detector aboard NOAA's GOES satellite that monitors the Sun, a full analysis has not been done.
The satellite was blinded for 11 minutes.
Craig DeForest, a solar physicist at the Southwest Research Institute, said others in his field are discussing the possibility that Tuesdays flare was an X40.
"I'd take a stand and say it appears to be about X40 based on extrapolation of the X-ray flux into the saturated period," DeForest told SPACE.com.
That estimate may even be conservative, he said.
www.space.com...
Yet despite the observational, and even instrument data "melatonin" wants to claim the Sun's activity has been decreasing?.......
Are you getting paid by Al Gore to make these lies despite all the evidence that shows the contrary?...
Why would anyone, more so someone who is not a scientist, claim the contrary to what the evidence says?....
[edit on 2-5-2009 by ElectricUniverse]
Originally posted by ElectricUniverse
I wanted to show this, which is not the only evidence that supports the fact that GCMs are flawed, and shouldn't be relied on.
Research Article
A comparison of tropical temperature trends with model predictions
David H. Douglass 1 *, John R. Christy 2, Benjamin D. Pearson 1 a, S. Fred Singer 3 4
1Department of Physics and Astronomy, University of Rochester, Rochester, NY 14627, USA
2Department of Atmospheric Science and Earth System Science Center, University of Alabama in Huntsville, Huntsville, AL 35899, USA
3Science and Environmental Policy Project, Arlington, VA 22202, USA
4University of Virginia, Charlottesville, VA 22903, USA
email: David H. Douglass ([email protected])
*Correspondence to David H. Douglass, Department of Physics and Astronomy, University of Rochester, Rochester, NY 14627, USA.
aCurrent address: VWR International, 5100 W. Henrietta Rd., Rochester, NY 14692, USA.
Keywords
climate trend • troposphere • observations
Abstract
We examine tropospheric temperature trends of 67 runs from 22 Climate of the 20th Century model simulations and try to reconcile them with the best available updated observations (in the tropics during the satellite era). Model results and observed temperature trends are in disagreement in most of the tropical troposphere, being separated by more than twice the uncertainty of the model mean. In layers near 5 km, the modelled trend is 100 to 300% higher than observed, and, above 8 km, modelled and observed trends have opposite signs. These conclusions contrast strongly with those of recent publications based on essentially the same data. Copyright © 2007 Royal Meteorological Society
www3.interscience.wiley.com...
Lets have this article please. No link.
Further - there have been literally hundreds of thousands of models run - literally - and you are trying to claim that one "version" of a model disproves all the other empirical data - how profoundly absurd.
Further the climate models ARE NOT USED AS PROOF - they are used to model the evidence at hand - this could go either way - if it disproved global warming what would you be saying then ?
These models are the result of the research - do you not understand that - my god you are incredibly thick. Please how old are you - lets have it out in the open so we know we are dealing with a child.
Originally posted by ElectricUniverse
We also have corroborating evidence from the AA index which shows that Solar magnetic activity had been increasing, which means it's overal activity was increasing until about 2006.
Again, you show that you just, basically, do not understand what you are going on about.
You state that the aa index show increasing magnetic activity up to 2006.
Yet it doesn't. That data isn't even the aa index.
It is the aa* index. Read the website, and read it properly.
A simple global index of magnetic activity is produced in France from the K indices of two nearly antipodal magnetic observatories in England and Australia. This index aa, is the 3-hourly equivalent amplitude antipodal index. Daily average AA may be derived similarly to Ap. An historical advantage to using aa rather than ap is that these indices have been extended back in time through scaling of magnetic activity from magnetograms of earlier observations. The aa indices are derived from 1868 to the present.
OK.
So that's the aa index. And here is the aa index data from a Leif Svalgaard article, the article that I posted which you obviously ignored, or were unable to comprehend:
[atsimg]http://files.abovetopsecret.com/images/member/7dba1b21e5c9.jpg[/atsimg]
And for good luck, here's two more different measures of magnetic activity:
ap index:
[atsimg]http://files.abovetopsecret.com/images/member/56048a2d9745.jpg[/atsimg]
am index:
[atsimg]http://files.abovetopsecret.com/images/member/61130f7a730b.jpg[/atsimg]
Figures come out naff on here, so the data can be seen in the original article:
www.leif.org...
An AA* index has been derived that is the counterpart of Ap* but is available for a longer span of years. However, the AA* is derived from indices from only two magnetic observatories whereas Ap* incorporates indices from more observatories.
That is the aa* index.
The aa* index is a measure of major magnetic storms. It's not the same thing as the aa index.
This is the aa index from the website. It's actually there if you had the ability to understand what you were reading.
www.ngdc.noaa.gov...
Not only that, but we know that since 1998 the Sun had been unleashing some of the most powerful sunspots, and Solar Flares since we have been studying the Sun with modern technology.
What? The biggest for 10 years? In an 11-year solar cycle.
lol
NOW PLAYING AT A STAR NEAR YOU: THE LARGEST SUNSPOT IN TEN YEARS BLAZES AWAY WITH ERUPTIONS
A huge sunspot as big as the surface area of thirteen Earths is growing on the Sun and has now rotated with the Sun to face the Earth. The sunspot, in the region designated AR 9393, is the largest of the current solar cycle, making it the biggest to appear in ten years.
Scientists even had to update the scale of Sunspots because the largest ever recorded Sunspot, even larger than the one that hit Canada, and the east coast occurred in 2003, and you "melatonin" want to claim the Sun's activity has been decreasing since the 1940s, and 1950s?....
The data is readily available. A big sunspot. Whoopee whoo. The main measure is TSI and sunspot number. They are the main measures that are used to assess trends in solar activity. One hot day does not a trend in global warming make, and similarly, one big sunspot does not an increase in solar activity make.
From earlier...
Bleh...and NASA's main researcher on ACRIM satellite data, Wilson, alongside some other scientists have shown that this is nothing more than a lie...
The activity of the Sun and the TSI had been increasing, according to Wilson's research which was for 24 years, from 1978 until 2002 shows that TSI had been increasing by about 0.04-0.05% per decade, and previous research shows that the increase had been ongoing for over 100-150 years...
Give it up already with the lies...
Better hadn't say anything about lady-bits, so...you don't know your ass from your elbow, muaddib.
Trends in TSI:
[atsimg]http://files.abovetopsecret.com/images/member/d6168d9bfd6f.png[/atsimg]
www.mps.mpg.de...
Sunspot number:
[atsimg]http://files.abovetopsecret.com/images/member/bcce6a5c5a5a.png[/atsimg]
www.mps.mpg.de...
Satellite TSI:
[atsimg]http://files.abovetopsecret.com/images/member/4c5bcf1b21d1.jpg[/atsimg]
www.mps.mpg.de...
Now, yes, we have two measures for the satellite data. Willson's and Frohlich's. I went over this two years ago with you. I noted it again the other day. And I'll do it once more:
their data is a composite of various different satellite data, another study which used the same data, Frolich & Lean (1998, 2004; Frolich, 2006), finds no trend in the minima. They each use different methods of 'sewing' the data from the different satellites together. So, which is correct? If you check the greenwich sunspot comparison on the same page as their TSI data (bottom figure), then we can start to see which is likely correct.
www.giss.nasa.gov...
The only way to know is to compare to other data...which also show no significant upward trend over the last few decades, and actually show a downward trend. Lockwood & Frolich contains more than just the direct TSI data, but also other measures which cross-validate. Thus, the sunspot data shows a similar downward trend (peak is approximately 1985, 5 yr divisions):
So does the solar flux data (same idea, peak at 1985'ish, 5 yr divisions):
Other measures show exactly the same thing, a downward trend in solar activity.

So there is good reason to view Willson's data as unreliable.
Keep perseverating, but I'd get it checked out if I was you.
[edit on 2-5-2009 by melatonin]
reply to post by audas
By now we know you are the child making incredible stupid claims, not me...
There are as many projections that refute the claims of those projections that say we are causing Climate Change, but of course the child audas who only knows how to mock people who present evidence against his claims can only make iditic comments and presents no evidence at all, except to give a couple of books by a mammalogist concerning Climate Change as evidence that we are the cause....
Grow the hell up.
reply to post by melatonin
WOW...i missed the *.... Phew thank heavens we got Melatonin to point this out and show this is proof that the research i post is wrong....
Again, you make a mockery of science with your red herrings and nitpicking the information that backs your belief, which is all you have.
There is ample evidence from real scientists, and not from "Melatonin", that shows the overall activity of the Sun had been increasing during the 20th century, and the beginning of the 21st century..
But of course, Melatonin and audas want to make their own conclusion so it fits their belief...
[edit on 20-7-2009 by ElectricUniverse]
new topics
-
A Warning to America: 25 Ways the US is Being Destroyed
New World Order: 1 hours ago -
President BIDEN's FBI Raided Donald Trump's Florida Home for OBAMA-NORTH KOREA Documents.
Political Conspiracies: 7 hours ago -
Maestro Benedetto
Literature: 8 hours ago -
Is AI Better Than the Hollywood Elite?
Movies: 9 hours ago
top topics
-
President BIDEN's FBI Raided Donald Trump's Florida Home for OBAMA-NORTH KOREA Documents.
Political Conspiracies: 7 hours ago, 27 flags -
Weinstein's conviction overturned
Mainstream News: 17 hours ago, 8 flags -
Gaza Terrorists Attack US Humanitarian Pier During Construction
Middle East Issues: 13 hours ago, 8 flags -
Massachusetts Drag Queen Leads Young Kids in Free Palestine Chant
Social Issues and Civil Unrest: 15 hours ago, 7 flags -
Las Vegas UFO Spotting Teen Traumatized by Demon Creature in Backyard
Aliens and UFOs: 12 hours ago, 6 flags -
Meadows, Giuliani Among 11 Indicted in Arizona in Latest 2020 Election Subversion Case
Mainstream News: 15 hours ago, 5 flags -
2024 Pigeon Forge Rod Run - On the Strip (Video made for you)
Automotive Discussion: 13 hours ago, 4 flags -
Is AI Better Than the Hollywood Elite?
Movies: 9 hours ago, 3 flags -
A Warning to America: 25 Ways the US is Being Destroyed
New World Order: 1 hours ago, 3 flags -
Maestro Benedetto
Literature: 8 hours ago, 1 flags
active topics
-
New whistleblower Jason Sands speaks on Twitter Spaces last night.
Aliens and UFOs • 65 • : Jukiodone -
HORRIBLE !! Russian Soldier Drinking Own Urine To Survive In Battle
World War Three • 50 • : F2d5thCavv2 -
Russia Ukraine Update Thread - part 3
World War Three • 5732 • : F2d5thCavv2 -
The Acronym Game .. Pt.3
General Chit Chat • 7751 • : F2d5thCavv2 -
Salvador Dali's Moustaches
People • 28 • : zosimov -
Is AI Better Than the Hollywood Elite?
Movies • 17 • : ThePsycheaux -
The best Rice dish i've ever tasted... Kimchi Rice
Food and Cooking • 26 • : lamhaocc -
A Warning to America: 25 Ways the US is Being Destroyed
New World Order • 1 • : 727Sky -
Massachusetts Drag Queen Leads Young Kids in Free Palestine Chant
Social Issues and Civil Unrest • 15 • : tarantulabite1 -
How ageing is" immune deficiency"
Medical Issues & Conspiracies • 35 • : annonentity
1