It looks like you're using an Ad Blocker.
Please white-list or disable AboveTopSecret.com in your ad-blocking tool.
Thank you.
Some features of ATS will be disabled while you continue to use an ad-blocker.

Quake Watch 2014
page: 104share:
M6.1 - 86km NE of Keelung, Taiwan
Event Time
2014-12-10 21:03:39 UTC
2014-12-11 05:03:39 UTC+08:00 at epicenter
2014-12-10 15:03:39 UTC-06:00 system time
Location
25.568°N 122.448°E depth=254.4km (158.1mi)
Nearby Cities
86km (53mi) NE of Keelung, Taiwan
108km (67mi) ENE of Taipei, Taiwan
113km (70mi) NE of Yilan, Taiwan
116km (72mi) ENE of Banqiao, Taiwan
918km (570mi) ENE of Hong Kong, Hong Kong
earthquake.usgs.gov...
Speaking of earthquakes, a new movie is already being advertised, and it's apparently coming out next year in May.
"San Andreas"- looks...well... like another earthquake movie. But using state of the art effects. Looks like they've got tsunamis in this one too. But hasn't the San Andreas been done to death? They should have used the Cascadia fault and gone all out for the mega big one. Or the New Madrid. The east coast needs some destruction for a change.
"San Andreas"- looks...well... like another earthquake movie. But using state of the art effects. Looks like they've got tsunamis in this one too. But hasn't the San Andreas been done to death? They should have used the Cascadia fault and gone all out for the mega big one. Or the New Madrid. The east coast needs some destruction for a change.
Visits to my NZ earthquakes pages have dropped 55.56% since I stopped the interactive maps. My guess is that no one is interested in looking at the
data on Google Earth.
Damn Google again.
But I may have solved the problem, by taking a leaf out of Geonet's mapping layout.
They use NZ Topo maps when you zoom in close, which I like a lot. They only do the last 100 events as a minimum which can be confusing.
So I went and had a look at NZ Topo Maps and found that you can upload KML files, and create your own maps there.
Wonderful!
Been playing around with it this evening, have had to alter the KML file creation to set a centre point and height right from the get go, as there is no way to reset these after the KML is loaded to NZ Topo Maps.
Still need to learn what else it can do, but here is how it seems to work, I need to figure out how to get it onto my blog page yet, as Wordpress won't accept the i-frame.
When you click on the map image below it should open in NZ Topo Maps and be interactive. I've set this particular map of NZ earthquakes 10th December 2014 UTC centred on Cook Strait and at 295km high. By default the Topo map shows first.

On the top right you will see a slider
Move that and a popup will give the instructions
"The base map has been set to the Google satellite map.
Use the transparency slider control to view more or less of the Google map beneath the topo map.
OK"
And this is what you can get, for example
now the fun of interactivity....... or should I say "the value of interactivity"
There have been a couple of M3 quakes SW of Reefton, SI in the last few days, of interest mainly because they are on the Alpine Fault, which is due to go M7+ any day (so they have been saying since 1968, since the last M6.7)
so lets zoom in to the Topo view now ............
interesting ......... lots of old Mines in the area (I already knew this, but there they are marked on the Topo Map!)
I'll have to see where the other M3 was at the day before, could be an old coal mine tunnel collapse rather than the Alpine Fault kicking off ......
If I can get this to work I could maybe post the most interesting quake each day as a starter, then readers can zoom out and look at others that day as well if they want to.
Maybe Google has done me a favour by dumping Classic Maps
this could be better.
Of course it only works for New Zealand.
The other M3.8 on December 9 2014, 13:29:58UTC was across the Inangahua Valley to the NE, at Garveys Creek Coal Mine
Damn Google again.
But I may have solved the problem, by taking a leaf out of Geonet's mapping layout.
They use NZ Topo maps when you zoom in close, which I like a lot. They only do the last 100 events as a minimum which can be confusing.
So I went and had a look at NZ Topo Maps and found that you can upload KML files, and create your own maps there.
Wonderful!
Been playing around with it this evening, have had to alter the KML file creation to set a centre point and height right from the get go, as there is no way to reset these after the KML is loaded to NZ Topo Maps.
Still need to learn what else it can do, but here is how it seems to work, I need to figure out how to get it onto my blog page yet, as Wordpress won't accept the i-frame.
When you click on the map image below it should open in NZ Topo Maps and be interactive. I've set this particular map of NZ earthquakes 10th December 2014 UTC centred on Cook Strait and at 295km high. By default the Topo map shows first.
On the top right you will see a slider
Move that and a popup will give the instructions
"The base map has been set to the Google satellite map.
Use the transparency slider control to view more or less of the Google map beneath the topo map.
OK"
And this is what you can get, for example
now the fun of interactivity....... or should I say "the value of interactivity"
There have been a couple of M3 quakes SW of Reefton, SI in the last few days, of interest mainly because they are on the Alpine Fault, which is due to go M7+ any day (so they have been saying since 1968, since the last M6.7)
so lets zoom in to the Topo view now ............
interesting ......... lots of old Mines in the area (I already knew this, but there they are marked on the Topo Map!)
I'll have to see where the other M3 was at the day before, could be an old coal mine tunnel collapse rather than the Alpine Fault kicking off ......
If I can get this to work I could maybe post the most interesting quake each day as a starter, then readers can zoom out and look at others that day as well if they want to.
Maybe Google has done me a favour by dumping Classic Maps
this could be better.
Of course it only works for New Zealand.
edit on 12u34434414 by muzzy because: (no reason given)
The other M3.8 on December 9 2014, 13:29:58UTC was across the Inangahua Valley to the NE, at Garveys Creek Coal Mine
edit on 12u34434414 by
muzzy because: (no reason given)
further to post by: muzzy
I have settled on this layout for NZ.
When you click on the daily map image it will open in NZ Topo Maps and by default will be an interactive Topographical Map to the scale 1:250,000.
By using the slider control on the top right you can change this to satellite view only, or any combination in between.
Click on an icon for the details of each event.
screenshot of the first post like this. Had to alter the text at the bottom so they line up when viewed in category pages (depending on the size of your screen) Click this image to go to the Home page and test it out for yourself.
Thank you for your patience, hopefully this will work out, only time will tell if I can get back my readers. Only a few from ATS, the rest come from all over.
Now to go back and change them all. Thanks a lot Google, NOT.
Oh, the number in the top left corner is for the animations I'll be doing each month, might as well put the date on them now and save some work later.
I have settled on this layout for NZ.
When you click on the daily map image it will open in NZ Topo Maps and by default will be an interactive Topographical Map to the scale 1:250,000.
By using the slider control on the top right you can change this to satellite view only, or any combination in between.
Click on an icon for the details of each event.
screenshot of the first post like this. Had to alter the text at the bottom so they line up when viewed in category pages (depending on the size of your screen) Click this image to go to the Home page and test it out for yourself.
Thank you for your patience, hopefully this will work out, only time will tell if I can get back my readers. Only a few from ATS, the rest come from all over.
Now to go back and change them all. Thanks a lot Google, NOT.
edit on 1200000034434414 by muzzy because: (no reason given)
Oh, the number in the top left corner is for the animations I'll be doing each month, might as well put the date on them now and save some work later.
edit on 1200000034434414 by muzzy because: (no reason given)
this would have rattled some Christchurch folks nerves
4 years after the M7.1
some people are still waiting to settle with their Insurance, but a lot of rebuilding going on
www.geonet.org.nz...
Reported Felt as
Destructive [21]: Opawa [8], Richmond [13]
Strong [17]: Spreydon [17]
Rather Strong [404]: Addington [19], Avondale [2], Burwood [4], Christchurch [164], Halswell [39], Lincoln [20], Oaklands, Rangiora [9], Riccarton [21], Rolleston [52], Russley [3], Saint Martins [9], Somerfield [14], Springston [4], Strowan [4], Sydenham [7], Upper Riccarton [23], Wainoni [4], Waltham [4], Weedons
Moderate [348]: Akaroa [2], Allenton, Aranui [5], Ashley, Avonhead [8], Avonside, Barrys Bay, Beckenham [6], Bishopdale [7], Bromley [4], Bryndwr [7], Burnham [5], Burnside [10], Burnside, Casebrook [2], Cashmere [12], Cass, Coalgate, Culverden, Cust, Dallington, Darfield [2], Diamond Harbour [3], Doyleston, Dunsandel [2], Edgeware [5], Eyrewell [2], Fendalton [3], Fernside, Ferrymead [2], Harewood, Hawarden, Heathcote Valley [3], Hei Hei [5], Hillmorton [6], Hoon Hay [19], Hornby [20], Huntsbury [2], Ilam [9], Kaiapoi [4], Kennedys Bush, Kirwee, Lakeside, Lansdowne, Leeston [7], Leithfield, Lincoln [3], Linwood [9], Little River [4], Lyttelton [6], Mairehau [4], Merivale [7], Mount Pleasant [2], New Brighton [2], Northcote, North New Brighton [3], Northwood [6], Ohoka [2], Papanui [7], Parklands [3], Phillipstown [4], Prebbleton [5], Rakaia, Redcliffs [4], Redwood [7], Saint Albans [24], Shirley [4], Sockburn [4], Southbridge [2], Sumner [5], Swannanoa, Tai Tapu [6], Templeton [6], Temuka, Timaru, Tinwald [2], Waikuku Beach, Watlington, West Eyreton, West Melton [7], Westmorland [4], Wigram [6], Woolston [7], Yaldhurst [4]
Slight [1]: Winchester
Total 791
4 years after the M7.1
some people are still waiting to settle with their Insurance, but a lot of rebuilding going on
Public ID 2014p933966
Intensity strong
Universal Time December 12 2014, 13:37:04
NZ Daylight Time Sat, Dec 13 2014, 2:37:04 am
Depth 9 km
Magnitude 4.5
Location 715 Ellesmere Junction Road, Springston, 25 km south-west of Christchurch
Latitude, Longitude -43.64, 172.37
Agency WEL(GNS_Primary)
www.geonet.org.nz...
Reported Felt as
Destructive [21]: Opawa [8], Richmond [13]
Strong [17]: Spreydon [17]
Rather Strong [404]: Addington [19], Avondale [2], Burwood [4], Christchurch [164], Halswell [39], Lincoln [20], Oaklands, Rangiora [9], Riccarton [21], Rolleston [52], Russley [3], Saint Martins [9], Somerfield [14], Springston [4], Strowan [4], Sydenham [7], Upper Riccarton [23], Wainoni [4], Waltham [4], Weedons
Moderate [348]: Akaroa [2], Allenton, Aranui [5], Ashley, Avonhead [8], Avonside, Barrys Bay, Beckenham [6], Bishopdale [7], Bromley [4], Bryndwr [7], Burnham [5], Burnside [10], Burnside, Casebrook [2], Cashmere [12], Cass, Coalgate, Culverden, Cust, Dallington, Darfield [2], Diamond Harbour [3], Doyleston, Dunsandel [2], Edgeware [5], Eyrewell [2], Fendalton [3], Fernside, Ferrymead [2], Harewood, Hawarden, Heathcote Valley [3], Hei Hei [5], Hillmorton [6], Hoon Hay [19], Hornby [20], Huntsbury [2], Ilam [9], Kaiapoi [4], Kennedys Bush, Kirwee, Lakeside, Lansdowne, Leeston [7], Leithfield, Lincoln [3], Linwood [9], Little River [4], Lyttelton [6], Mairehau [4], Merivale [7], Mount Pleasant [2], New Brighton [2], Northcote, North New Brighton [3], Northwood [6], Ohoka [2], Papanui [7], Parklands [3], Phillipstown [4], Prebbleton [5], Rakaia, Redcliffs [4], Redwood [7], Saint Albans [24], Shirley [4], Sockburn [4], Southbridge [2], Sumner [5], Swannanoa, Tai Tapu [6], Templeton [6], Temuka, Timaru, Tinwald [2], Waikuku Beach, Watlington, West Eyreton, West Melton [7], Westmorland [4], Wigram [6], Woolston [7], Yaldhurst [4]
Slight [1]: Winchester
Total 791
further to post by: muzzy
sticking with the Open Street Maps for the Monthly Animation, the Satellite maps tend to look a bit patchy because of the dark colours when they change from one image to the next. Satellite map also is a bigger size, 51-67KB versus the OSM 20-25KB.
Have re-done back to the beginning of November 2014
this is going to take a while .................
Dec
Nov
Monthly Animations
bit of a swarm going on offshore Milford Sound, SI, NZ

click image for NZ Topo interactive map
TimeUTC, Lat, Long, Mag
13/12/2014 22:24:07, -44.3663, 166.8281, 3.45*
13/12/2014 22:33:36, -44.4153, 166.9047, 3.38*
13/12/2014 23:23:30, -44.7233, 167.2596, 3.0*
14/12/2014 00:26:10, -44.4799, 167.2358, 3.95
14/12/2014 00:42:09, -44.7487, 167.272, 2.91
14/12/2014 00:46:10, -44.7318, 167.2637, 2.98
14/12/2014 11:16:24, -44.4304, 166.9651, 2.96
14/12/2014 13:04:31, -44.3694, 166.8788, 3.59
14/12/2014 13:09:47, -44.3884, 166.8993, 3.59
14/12/2014 13:26:52, -44.4858, 167.2083, 3.07
14/12/2014 13:30:48, -44.5006, 167.2269, 4.09
14/12/2014 13:41:31, -44.5184, 167.2964, 4.38
14/12/2014 13:46:15, -44.7366, 167.2851, 3.22
14/12/2014 14:02:37, -44.7264, 167.3107, 2.92
14/12/2014 14:09:43, -44.3124, 166.8174, 3.10
14/12/2014 14:35:34, -44.7768, 167.3163, 2.93
14/12/2014 14:37:26, -44.6499, 167.2084, 3.20
14/12/2014 14:39:41, -44.4688, 166.9609, 2.93
14/12/2014 14:46:37, -44.4751, 167.3018, 3.99
14/12/2014 14:53:57, -44.7242, 167.2333, 2.99
14/12/2014 15:06:09, -44.3834, 166.9007, 3.17
14/12/2014 15:21:33, -44.498, 167.2826, 4.01
138.26TTNT energy released
* not shown on map as was yesterdays daily file
edit on 12u34734714 by muzzy because: (no reason given)
Update on the o/s Milford Sound swarm
one M4 dropped to 3.94, but a few more added
www.topomap.co.nz...
National Geographic Maps this time
alternative to Google Maps, whom I am boycotting at the moment
one M4 dropped to 3.94, but a few more added
www.topomap.co.nz...
National Geographic Maps this time
alternative to Google Maps, whom I am boycotting at the moment
edit on 1200000034934914 by muzzy because: (no reason given)
a reply to: muzzy
Didn't feel the one the other night, but is it not something that there was a large 'Fiordland' region (offshore) 'quake before the 2010 ChCh 'quake?
Maybe a few months down the track?
I hope not, but we all known that the Alpine Fault is going to go - large - at some stage.
Was in Wellington a couple of weeks ago for the Nick Cave concert (bloody awesome, and Warren Ellis is just as much of a musical god: two birds with one stone!) and felt really uneasy walking around the streets downtown. They're stuffed when (not if) it happens....as if the raised shore platforms at Cape Palliser weren't enough warning...had a friend ask me about the fault running through Wellington and I said " think of it less as a fault and more as a fault zone"
I think it sunk in!
a reply to: aorAki
hey aorAki, long time since you been on, still crazy down there in road cone country?
You are probably thinking of the Dusky Sound July 15th 2009 M7.8, which supposedly pulled the Fiordland area 350mm towards Tasmania and stretched the south of the south island away from Banks Peninsula, resulting in the Darfield M7.1?
info.geonet.org.nz...
Maybe there was another one. I was looking at the double 6 in this o/s Milford Sound area in 2007 as a possible historical match, very close to this recent swarm.
seabreeze.wordpress.com...
edit on 1200000034934914 by muzzy because: changed the link as the previously linkable map done on Google Maps doesn't work anymore thanks to
GM's poor decision making. Link is now to my page with 2000-2009 M5+ maps
edit on 1200000034934914 by muzzy because: (no reason
given)
a reply to: muzzy
Hiya!
Yep, been lying relatively low. Road cones are still everywhere. Road closures daily with different routes home all the time. City is slowly building itself again though and there is a generally positive vibe in the air, amidst the exhaustion of dealing with insurance companies and exorbitant rents. It sure is dusty at times though....expect silicosis and asbestosis to be the silent storm in the future!
Yep, the Dusky Sound 'quake was the one I was thinking of.
Hope all's well in your neck of the woods
a reply to: aorAki
Yeah all good here, was thinking of you guys down there the other day, we are getting a new expressway built here and most of the moderate traffic feeder roads to the old state highway 1 that cross the new route will be having bridges built, so you can imagine the chaos, why on earth they need to have a km of road cones each side of the work is beyond belief, they may be left over from Christchurch. I doesn't mtter which way you go they are building all the bridges at the same time.
Yeah all good here, was thinking of you guys down there the other day, we are getting a new expressway built here and most of the moderate traffic feeder roads to the old state highway 1 that cross the new route will be having bridges built, so you can imagine the chaos, why on earth they need to have a km of road cones each side of the work is beyond belief, they may be left over from Christchurch. I doesn't mtter which way you go they are building all the bridges at the same time.
ID: 2014p952799 Network: geonet
Status: confirmed
Date/Time NZDT: 20/12/2014 01:51:22
Date/Time UTC: 19/12/2014 12:51:22
Latitude, Longitude: -38.2617, 178.0028
Magnitude: 4.81M
Depth: 35.12 km
Energy Released: 248.7759 tonnes of TNT
Location: Matahi-Matawai-Tolaga Bay-Ruatoria Knoll
www.geonet.org.nz...
GFZ say 5.1Mw
geofon.gfz-potsdam.de...
Reported Felt as
Rather Strong [73]: Gisborne [37], Mangapapa [17], Ormond [7], Te Hapara [12]
Moderate [119]: Awapuni [2], Edgecumbe [3], Elgin [4], Featherston, Frasertown, Hexton [3], Kaiti [11], Kawerau, Kutarere, Mahia, Makaraka [5], Makauri [2], Matawai, Nelson, Ngatapa, Ohope [3], Opotiki [10], Outer Kaiti [5], Tamarau, Te Kaha, Te Karaka [8], Tokomaru Bay [2], Tolaga Bay, Wainui, Wainui [4], Waiotahi, Waipaoa, Wairoa [2], Whakatane [16], Whangara, Whatatutu, Whataupoko [23]
Total 192
edit on 12u35235214 by muzzy because: (no reason given)
Still messing around with the New Zealand maps
Might seem a bit retro, but I kind of like these Black and White versions I made
They are SVG (Scalable Vector Graphic images)
Rather than use colour its based on scale 1-6
Some times the yellow colour of the M4 icon gets hidden behind the early aftershocks, and often the odd orange M5 doesn't usually stand out very well either, at least this style you can see at a quick glance what is going on, except for the detail, which is screwed anyway since Google Maps changed the Classic Interactive Maps.
Here is an example, yesterday 19th Dec UTC
First the coloured icon version, see how you can't really see the yellow icon for the East Cape 4.8 quake, or the other M4 up by Whakatane Seamount
Whereas in the B&W scaled version it very obvious
I made an animation of Dec so far too. Like this the animations are way less data size, so I will be able to make more of them.
If I go with this style I'll still make the image link to the NZ Topo Map, still got to have the interactivity available eh.
Where it gets messy is if there are a bunch of M3's very close together, like on this one on 14th Dec.
But at least you can see something significant happened
This would likely work OK with Japan too, as they have the same scales of earthquakes 1+
I tried colourizing the circles too, but what happens is when several circles get on top of each other the colour of the smaller ones inside the bigger ones changes completely, due to opacity and the colour combinations of the spectrum.
Might seem a bit retro, but I kind of like these Black and White versions I made
They are SVG (Scalable Vector Graphic images)
Rather than use colour its based on scale 1-6
Some times the yellow colour of the M4 icon gets hidden behind the early aftershocks, and often the odd orange M5 doesn't usually stand out very well either, at least this style you can see at a quick glance what is going on, except for the detail, which is screwed anyway since Google Maps changed the Classic Interactive Maps.
Here is an example, yesterday 19th Dec UTC
First the coloured icon version, see how you can't really see the yellow icon for the East Cape 4.8 quake, or the other M4 up by Whakatane Seamount
Whereas in the B&W scaled version it very obvious
I made an animation of Dec so far too. Like this the animations are way less data size, so I will be able to make more of them.
If I go with this style I'll still make the image link to the NZ Topo Map, still got to have the interactivity available eh.
Where it gets messy is if there are a bunch of M3's very close together, like on this one on 14th Dec.
But at least you can see something significant happened
edit on 12u35335314 by muzzy because: (no reason given)
This would likely work OK with Japan too, as they have the same scales of earthquakes 1+
edit on 1200000035335314 by muzzy because: (no reason
given)
I tried colourizing the circles too, but what happens is when several circles get on top of each other the colour of the smaller ones inside the bigger ones changes completely, due to opacity and the colour combinations of the spectrum.
edit on 1200000035335314 by muzzy because: (no
reason given)
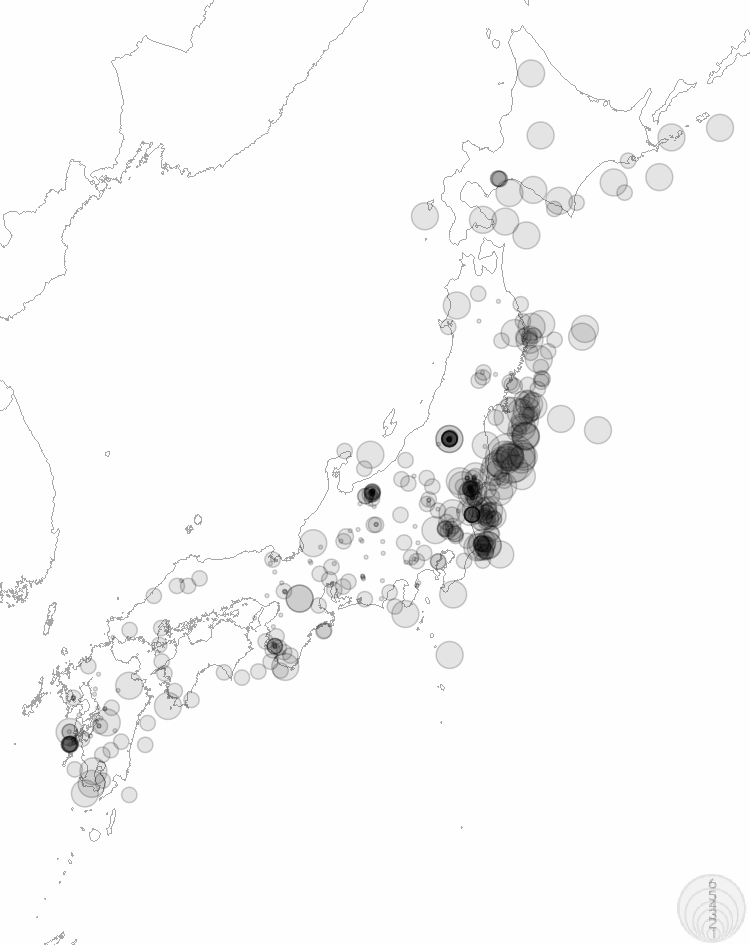
So the Japan Map might look like this on conversion to SVG
Last 24 hours M0+. Little dots are less than M1
But I'd likely just do M1+, as without interactive process you can't zoom in anyway
right click view image for full size
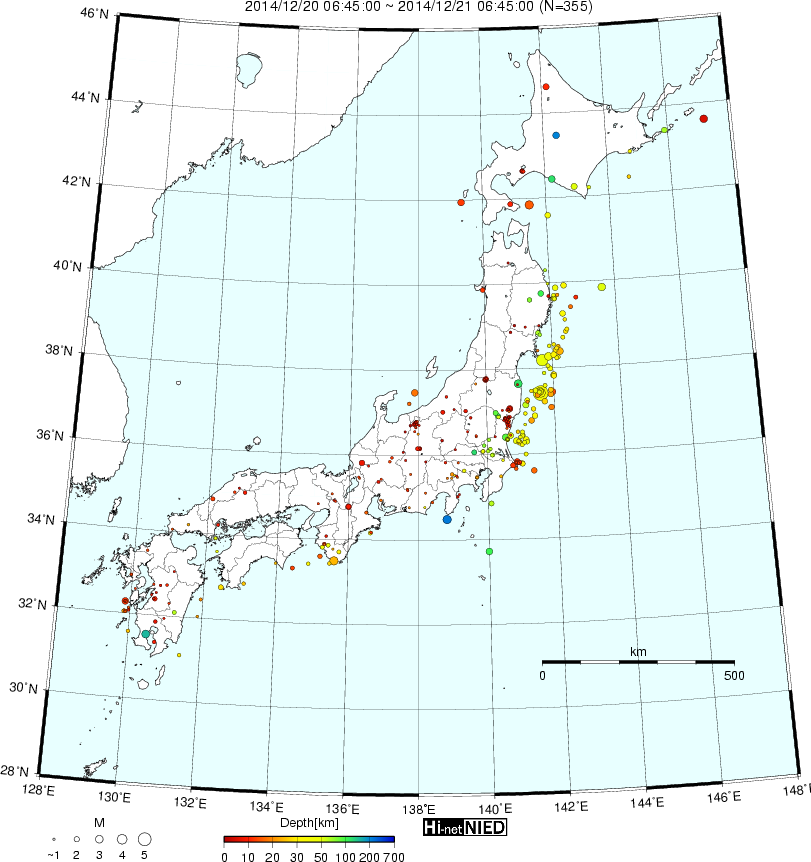
to
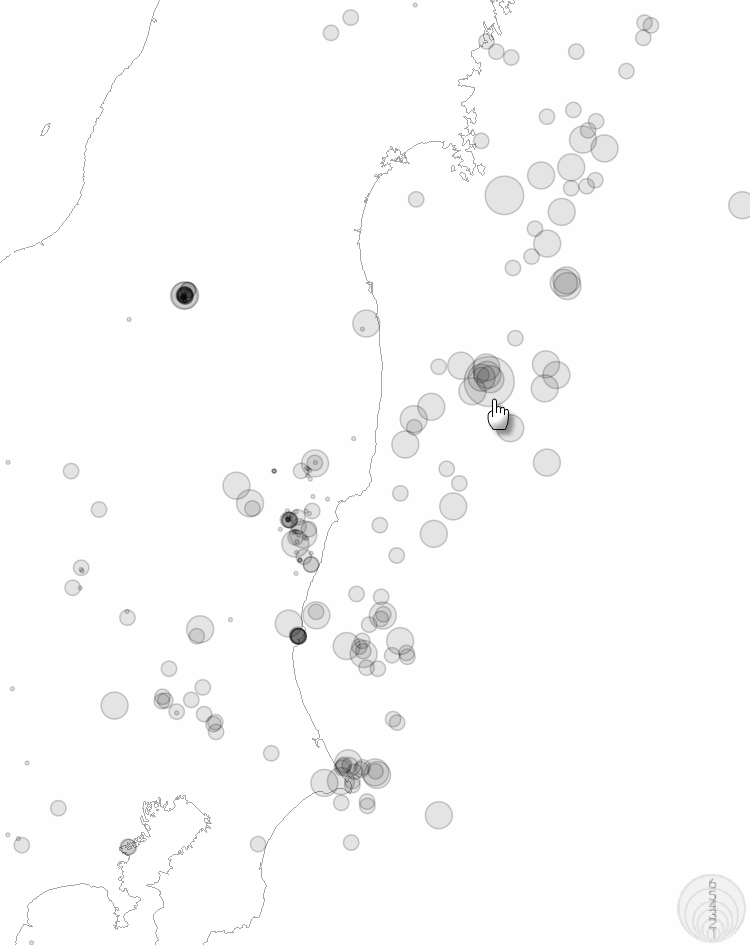
and here is a closeup of near and offshore Honshu, showing the 5.8
18:30 JST 20 Dec 2014 37.4N 141.6E 40 km 5.8 Fukushima-ken Oki
Last 24 hours M0+. Little dots are less than M1
But I'd likely just do M1+, as without interactive process you can't zoom in anyway
right click view image for full size
to
edit on 12u35335314 by muzzy because: (no reason given)
and here is a closeup of near and offshore Honshu, showing the 5.8
18:30 JST 20 Dec 2014 37.4N 141.6E 40 km 5.8 Fukushima-ken Oki
edit on 12u35335314 by muzzy because: (no reason given)
originally posted by: TrueAmerican
Speaking of earthquakes, a new movie is already being advertised, and it's apparently coming out next year in May.
"San Andreas"- looks...well... like another earthquake movie. But using state of the art effects. Looks like they've got tsunamis in this one too. But hasn't the San Andreas been done to death? They should have used the Cascadia fault and gone all out for the mega big one. Or the New Madrid. The east coast needs some destruction for a change.
I'm not expecting a masterpiece, but I'm pumped for this movie. The Rock was my idol growing up. On top of that, there have been 5 small earthquakes off of the top of Vancouver Island in the past day so that has me even more eager to see this movie. When Cascadia goes, it's going to be so scary.
further to post by: muzzy
I have transfered the NZ SVG maps to quaketrails.wordpress.com...
but will keep the coloured pages going on seabreeze.wordpress.com...
just December so far
I was able to make the KML file scalable icons too, but only on Google Earth, when it is transferred to NZ Topo Maps they come out all the same size.
I have transfered the NZ SVG maps to quaketrails.wordpress.com...
but will keep the coloured pages going on seabreeze.wordpress.com...
just December so far
edit on 12u35535514 by muzzy because: (no reason given)
I was able to make the KML file scalable icons too, but only on Google Earth, when it is transferred to NZ Topo Maps they come out all the same size.
edit on 1200000035535514 by muzzy because: (no reason given)
Not very big but an odd location for such a very deep one
or is it?
cross section 45-46south
yes
may be an error, got it off JSON data,but it's not showing on Geonets public pages
had a hunt around, yes it's for real, but advised caution as to quality
www.geonet.org.nz...
ID: 2014p960937 Network: geonet
Status: automatic
Date/Time NZDT: 23/12/2014 02:08:14
Date/Time UTC: 22/12/2014 13:08:14
Latitude, Longitude: -45.5062, 171.3585
Magnitude: 3.15M
Depth: 216.88 km
Energy Released: 0.8031 tonnes of TNT
Location: 50 km east of Palmerston, Off E. Coast Of S. Island.
or is it?
cross section 45-46south
yes
may be an error, got it off JSON data,
edit on 12u35535514 by muzzy because: (no reason given)
had a hunt around, yes it's for real, but advised caution as to quality
www.geonet.org.nz...
edit on 12u35535514 by muzzy because: (no reason given)
Where, When, Lat, Long, Mag
WEST OF MACQUARIE, 24/12/2014 1:19, -56.5, 147.5, 5.6
WEST OF MACQUARIE, 24/12/2014 1:58, -56.5, 147.5, 6.0
WEST OF MACQUARIE, 24/12/2014 2:36, -57, 147, 5.2
WEST OF MACQUARIE, 24/12/2014 4:22, -56.5, 147.5, 5.1
www.ldeo.columbia.edu...
Let's hope the same scenerio as 10 years ago doesn't play out again
Where, When, Lat, Long, Mag
NORTH OF MACQUARIE ISLAND, 23/12/2004 14:59, -50.1, 160.3, 8.1
SOUTH INDIAN OCEAN, 24/12/2004 22:42, -8.6, 91.1, 5.4
NORTHERN SUMATERA, INDONESIA, 26/12/2004 0:58, 3.1, 96.2, 9.0
Merry Christmas everyone
Muzzy 25/12/2014 5:57am NZDT
a reply to: phoenixlights321
It wouldn't be ATS of me not to say.......they trying to tell us something???
Rainbow blessings to all you 'movers and shakers here on Quake Watch....and may your 2015 be full of love, peace, joy and grace,

Jane
It wouldn't be ATS of me not to say.......they trying to tell us something???
Rainbow blessings to all you 'movers and shakers here on Quake Watch....and may your 2015 be full of love, peace, joy and grace,
Jane
new topics
-
A Warning to America: 25 Ways the US is Being Destroyed
New World Order: 26 minutes ago -
America's Greatest Ally
General Chit Chat: 1 hours ago -
President BIDEN's FBI Raided Donald Trump's Florida Home for OBAMA-NORTH KOREA Documents.
Political Conspiracies: 6 hours ago -
Maestro Benedetto
Literature: 7 hours ago -
Is AI Better Than the Hollywood Elite?
Movies: 7 hours ago -
Las Vegas UFO Spotting Teen Traumatized by Demon Creature in Backyard
Aliens and UFOs: 11 hours ago
top topics
-
President BIDEN's FBI Raided Donald Trump's Florida Home for OBAMA-NORTH KOREA Documents.
Political Conspiracies: 6 hours ago, 27 flags -
Krystalnacht on today's most elite Universities?
Social Issues and Civil Unrest: 17 hours ago, 9 flags -
Gaza Terrorists Attack US Humanitarian Pier During Construction
Middle East Issues: 12 hours ago, 8 flags -
Supreme Court Oral Arguments 4.25.2024 - Are PRESIDENTS IMMUNE From Later Being Prosecuted.
Above Politics: 17 hours ago, 8 flags -
Weinstein's conviction overturned
Mainstream News: 15 hours ago, 8 flags -
Massachusetts Drag Queen Leads Young Kids in Free Palestine Chant
Social Issues and Civil Unrest: 14 hours ago, 7 flags -
Las Vegas UFO Spotting Teen Traumatized by Demon Creature in Backyard
Aliens and UFOs: 11 hours ago, 6 flags -
Meadows, Giuliani Among 11 Indicted in Arizona in Latest 2020 Election Subversion Case
Mainstream News: 14 hours ago, 5 flags -
2024 Pigeon Forge Rod Run - On the Strip (Video made for you)
Automotive Discussion: 12 hours ago, 4 flags -
Is AI Better Than the Hollywood Elite?
Movies: 7 hours ago, 3 flags
active topics
-
A Warning to America: 25 Ways the US is Being Destroyed
New World Order • 1 • : 727Sky -
Massachusetts Drag Queen Leads Young Kids in Free Palestine Chant
Social Issues and Civil Unrest • 15 • : tarantulabite1 -
America's Greatest Ally
General Chit Chat • 1 • : BingoMcGoof -
How ageing is" immune deficiency"
Medical Issues & Conspiracies • 35 • : annonentity -
HORRIBLE !! Russian Soldier Drinking Own Urine To Survive In Battle
World War Three • 49 • : Freeborn -
Gaza Terrorists Attack US Humanitarian Pier During Construction
Middle East Issues • 30 • : Asher47 -
Electrical tricks for saving money
Education and Media • 8 • : anned1 -
Is AI Better Than the Hollywood Elite?
Movies • 16 • : 5thHead -
Hate makes for strange bedfellows
US Political Madness • 48 • : Terpene -
President BIDEN's FBI Raided Donald Trump's Florida Home for OBAMA-NORTH KOREA Documents.
Political Conspiracies • 17 • : BingoMcGoof