It looks like you're using an Ad Blocker.
Please white-list or disable AboveTopSecret.com in your ad-blocking tool.
Thank you.
Some features of ATS will be disabled while you continue to use an ad-blocker.

Quake Watch 2014
page: 102share:
a reply to: PuterMan
These are pretty big aftershocks for a M7.0, I wonder if they got that first one wrong?
When, Mag, Lat, Long, Depth, location
2014-11-15 02:31:43 , 7.0 , 1.98°N , 126.48°E , 53 , Northern Molucca Sea
2014-11-15 03:08:05 , 6.2 , 0.23°S , 124.07°E , 104 , Southern Molucca Sea
2014-11-21 10:10:18 , 6.5 , 2.40°N , 127.09°E , 28 , Northern Molucca Sea
2014-11-26 14:33:45 , 6.7 , 1.97°N , 126.53°E , 51 , Northern Molucca Sea
Source: GFZ
Thought you's might like to have a look at this web site. I heard about it on Radio NZ yesterday while driving to work.
Its archive.org
Of particular interest is the Wayback Machine, where you can go back and look at web sites that were archived on that particular day, 435 billion web pages saved over time (since 1995)
May be helpful in some cases doing research on earthquakes, particlarily that site called USGS, who keep changing things.
I did a search on USGS 7 days map (using the current url as the address)
I can't link to the results, so you have to do it yourself
copy and paste this into the box beside the "Browse History" button
take the * out of the http part before you do
click on a blue dot and you get the web page for that day, works great, although not every day is archived, but possibly enough to check out what they said at the time.
No more hiding behind the 7/30 days alterations which often change the original estimates for events without any notiification.
There are many more uses for this, especially for web pages that expire (IRIS QuakQuery may be one worth checking out, but I haven't tried it yet)
what a great project!
The people are taking back the Internet from the Corporations, for the use of the people!
Its archive.org
Of particular interest is the Wayback Machine, where you can go back and look at web sites that were archived on that particular day, 435 billion web pages saved over time (since 1995)
May be helpful in some cases doing research on earthquakes, particlarily that site called USGS, who keep changing things.
I did a search on USGS 7 days map (using the current url as the address)
I can't link to the results, so you have to do it yourself
copy and paste this into the box beside the "Browse History" button
h*t*t*p://earthquake.usgs.gov/earthquakes/map/#[%22feed%22%3A%227day_m45%22%2C%22search%22%3Anull%2C%22sort%22%3A%22newest%22%2C%22basemap%22%3A%2 2grayscale%22%2C%22autoUpdate%22%3Atrue%2C%22restrictListToMap%22%3Atrue%2C%22timeZone%22%3A%22local%22%2C%22mapp
take the * out of the http part before you do
click on a blue dot and you get the web page for that day, works great, although not every day is archived, but possibly enough to check out what they said at the time.
No more hiding behind the 7/30 days alterations which often change the original estimates for events without any notiification.
There are many more uses for this, especially for web pages that expire (IRIS QuakQuery may be one worth checking out, but I haven't tried it yet)
what a great project!
The people are taking back the Internet from the Corporations, for the use of the people!
edit on 1100000032932914 by muzzy because: truble
with the text changing to a link, put in the *'s to stop that.
Or there's more to come.
originally posted by: muzzy
a reply to: PuterMan
These are pretty big aftershocks for a M7.0, I wonder if they got that first one wrong?
When, Mag, Lat, Long, Depth, location
2014-11-15 02:31:43 , 7.0 , 1.98°N , 126.48°E , 53 , Northern Molucca Sea
2014-11-15 03:08:05 , 6.2 , 0.23°S , 124.07°E , 104 , Southern Molucca Sea
2014-11-21 10:10:18 , 6.5 , 2.40°N , 127.09°E , 28 , Northern Molucca Sea
2014-11-26 14:33:45 , 6.7 , 1.97°N , 126.53°E , 51 , Northern Molucca Sea
Source: GFZ
a reply to: CranialSponge
First nice to see you pop your head up over the quake parapet. Long time no see in here.
Basically it is because of the stringently precise science of earthquakes NOT. One only needs to look at a phase listing to see that every seismo station records a different value and the figure we get is an average of many rounded up or down to one decimal place. Take the EMSC phase data for the quake as an example.
If you click on the word Mag to sort it you will see that the values range from 7.2mb down to 5.5mb. No one station can provide the value, and in any event all of these are mb values - the body wave magnitude - derived from the first second of the P wave. mb scales are not accurate over about 5.5 to 5.8 and the calculation has to be done to arrive at the moment of magnitude (Mw) based on the area of rupture of the quake.
A quick conversion can be done using a formula to convert the mb value, but it is unlikely to be exactly the same value as the proper moment tensor calculation for Mw. This is why Mw values are often delayed and result in a change of value. These calculations are further refined over a period of time and it can be as much as two years before the final value for the earthquake is determined.
It does not always go down but the quick calcs do tend to be higher than the full calcs. Even so it is fairly often that a quake values goes down and then goes back up again, for example 6.6 > 6.3 > 6.4.
Bet you are glad you asked !!!
Why is it that earthquake magnitudes always end up dropping down a notch or two after the fact
First nice to see you pop your head up over the quake parapet. Long time no see in here.
Basically it is because of the stringently precise science of earthquakes NOT. One only needs to look at a phase listing to see that every seismo station records a different value and the figure we get is an average of many rounded up or down to one decimal place. Take the EMSC phase data for the quake as an example.
If you click on the word Mag to sort it you will see that the values range from 7.2mb down to 5.5mb. No one station can provide the value, and in any event all of these are mb values - the body wave magnitude - derived from the first second of the P wave. mb scales are not accurate over about 5.5 to 5.8 and the calculation has to be done to arrive at the moment of magnitude (Mw) based on the area of rupture of the quake.
A quick conversion can be done using a formula to convert the mb value, but it is unlikely to be exactly the same value as the proper moment tensor calculation for Mw. This is why Mw values are often delayed and result in a change of value. These calculations are further refined over a period of time and it can be as much as two years before the final value for the earthquake is determined.
It does not always go down but the quick calcs do tend to be higher than the full calcs. Even so it is fairly often that a quake values goes down and then goes back up again, for example 6.6 > 6.3 > 6.4.
Bet you are glad you asked !!!
a reply to: muzzy
A site I know well! The way back machine however is often lacking just that important piece of information you need to fill a gap. Strange how much of the temperature data (GISS) did not get recorded very often.
They do now, but only available on request from my personal archive of GISS, MAISIE, QED and Mines data collected daily.
a reply to: PuterMan

No I don't regret asking you, LOL.
So basically what you're saying is that these seismographs are no where near to being an exact science.
I guess that's why I always wondered what was up with the neverending changes because I just assumed that it was a precision driven science due to the ability using measuring devices. But apparently not.
So when we see an earthquake magnitude declaration, we need to understand that number as a generalized average rather than an absolute measurement... gotcha.
Muchly appreciated for the clarification on my silly little query (but it's been bugging me for a while).
Oh, and good to see you too old chap !
Thanks for your patience and letting me whine about how Google has/is changing Google Classic Maps to My Maps, how it just isn't up to scratch for
my purposes, and how I'm going to use ikimaps etc.
I have made the decision to;
~ use ikimaps where you can click on the image and it goes directly to the interactive ikimap.
~ after 7 days that individual map will change to another one where the link downloads the KMZ file
you need Google Earth to open it
~ I'll use Wordpress to store the png images you see on the page, by deleting one and replacing it with another on a 7 day rotating schedule. If my calculations are correct, based on each image being 70kb I should have enough storage for 44,900 images!!! That's 123 years worth of daily maps. Should be enough, the NZ GNS data only really kicked in on a daily basis in the 1940's so probably looking at 25,185 maps when the whole thing is done. But of course it will never be "done", as each day there are more earthquakes to add.
The numbers are staggering, I forget how many earthquakes have been recorded for NZ since they started recording them, but based on 20,000 per year that is over a million since 1945 alone!.
The goal here is to map the lot!
Its a real pain in the ar_e to have to do all this now but I think its the simplest workaround to keep my blog workable after Feb 2015. Simple because I already have the KMZ file of every interactive map currently on the blog saved either on Google Drive or Dropbox . All I have to do is go back and change the html on each daily map on Wordpress, all 2180+ of them, but that is easier than creating 2180+ new maps on My Maps, which won't work properly anyway if there are more than 100 events on each one. All it takes is a big event with hundreds of aftershocks and the MyMaps system collapses. Its bloody useless.
I have gone back and redone the last 6 days, so that the first page at least looks consistant.
seabreeze.wordpress.com...
further to post by: muzzy
Have redone October, I reset the page to take 32 posts, so you can see the whole month on one page.
made the maps as GIF's which as well as being smaller file size also gives more flexibility, such as being able to make an animated map for the whole month at the end, which also downloads the KMZ file when clicked
two birds with one stone
NZ October 2014
Been kinda keeping an eye on those two quakes in southern Alaska within 130 km or so from each other- a 4.6 and a 4.8. Kinda big for both of them to
be there within a day of each other. Usually it's only one bigger one and a bunch of smaller quakes 3 mag or less. Hope that is not a harbinger of
evil to come.
edit on Sat Nov 29th 2014 by TrueAmerican because: (no reason given)
Public ID 2014p901017
Universal Time November 30 2014, 9:01:56
NZ Daylight Time Sun, Nov 30 2014, 10:01:56 pm
Depth 83 km
Magnitude 5.1
Location 40 km north of Te Araroa
Latitude, Longitude -37.26, 178.30
Agency WEL(GNS_Primary)
www.geonet.org.nz...
Reported Felt as
Strong[74]: Whakatane [74]
Rather Strong [30]: Ohope [30]
Moderate [85]: Awakeri [6], Coastlands [5], Edgecumbe [3], Gisborne [3], Mangapapa [3], Ngatea, Ohiwa [3], Omaio [2], Opotiki [24], Parua Bay, Poroporo, Potaka, Ruatoria [4], Springfield, Taneatua [7], Te Araroa [2], Te Kaha [3], Te Karaka, Te Teko, Tikitiki, Tirohanga, Tokomaru Bay [2], Waihi, Waimana [3], Waimarama, Waiotahi, Whanarua Bay, Whitianga [2]
Slight[9]:Kaiti, Patutahi, Tauwhareparae, Te Aroha, Te Hapara, Toatoa, Wainui, Welcome Bay, Whataupoko
Total 198
Arizona M 4.7
earthquake.usgs.gov...
At First reported as a 3.2 then upgraded to a 4.7 by USGS
M4.7 - 12km N of Sedona, Arizona
2014-12-01 05:57:38 UTC
Event Time
2014-12-01 05:57:38 UTC
2014-11-30 22:57:38 UTC-07:00 at epicenter
2014-11-30 21:57:38 UTC-08:00 system time
Location
34.977°N 111.740°W depth=10.2km (6.4mi)
Nearby Cities
12km (7mi) N of Sedona, Arizona
13km (8mi) NNE of West Sedona, Arizona
25km (16mi) SSW of Flagstaff, Arizona
36km (22mi) NE of Cottonwood, Arizona
172km (107mi) N of Phoenix, Arizona
edit on 7/30/2012 by dreamfox1 because: (no reason given)
a reply to: dreamfox1
I saw this on USGS and got to wondering what in the world caused that. The San Francisco peaks in the Flagstaff area have been dormant for quite some time. Could this be a wake-up call?
Source
So long . . . and thanks for all the fish!
Bishop
Arizona M 4.7
I saw this on USGS and got to wondering what in the world caused that. The San Francisco peaks in the Flagstaff area have been dormant for quite some time. Could this be a wake-up call?
Once the fiery center of one of Arizona's most explosive volcanoes, the summits surrounding the now dormant inner core stand guard, protecting land that the native people of Arizona consider to be so sacred it is where earth meets heaven.
Source
So long . . . and thanks for all the fish!
Bishop
edit on 12/1/2014 by Bishop2199 because: I like change.
The "migration" from Google MyMaps continues, working on LDEO now
Just experimenting with the map type at this stage, may change to Open Street Map when I get time.
One drawback of using ikimaps with LDEO data is that when you click on an icon on the map it only shows one popup tag with the details, which is a problem, because LDEO tend to locate quakes in a swarm with the same Lat/Long. On Google Classic Maps you had the option of clicking the "1 of 7 nearby results Next »" at the bottom of the popup tag to see the other ones nearby.
So the only way to see the details (of multiple events on top of each other) on the LDEO ikimaps is to use the dropdown list on the right hand side and click each item to see where it was. One solution may be to alter the titles to give the location too, which would show in the green text in the list, might be easier to find individual events, such as;
There is a swarm going on at CARLSBERG RIDGE the last few days, LDEO has got 41 events from M4.6-M5.8 on that map, but you can only see 5 icons on the ikimap.
(click the "list" text to see the full list of events on my LDEO map page )
tricky
damn google for making these changes
edit on 12u33433414 by muzzy because: (no reason given)
a reply to: Bishop2199
been to Flagstaff, but don't remember seeing any volcano's there
was probably too focused on getting to the Grand Canyon at the time
was before I developed what is now a keen interest in volcanism
been to Flagstaff, but don't remember seeing any volcano's there
was probably too focused on getting to the Grand Canyon at the time
was before I developed what is now a keen interest in volcanism
Deep
The MT (beachball) says 6.5Mw though
F-E Region: Mindanao, Philippines
Time: 2014-12-02 05:11:32.6 UTC
Magnitude: 6.3
Epicenter: 123.16°E 6.15°N
Depth: 631 km
geofon.gfz-potsdam.de...
The MT (beachball) says 6.5Mw though
Close and Shallow
In the hills behind us. I had just left home and was driving so didn't feel it, but the other half called me right away and said it was a big jolt, then some shaking, doors swinging, she thought the contractors working on the new highway were blowing something up, they are about 2km away from us.
Public ID 2014p907483
Universal Time December 2 2014, 18:27:28
NZ Daylight Time Wed, Dec 3 2014, 7:27:28 am
Depth 16 km
Magnitude 3.0
Location 10 km south-east of Paraparaumu
Latitude, Longitude -41.02, 175.05
www.geonet.org.nz...
In the hills behind us. I had just left home and was driving so didn't feel it, but the other half called me right away and said it was a big jolt, then some shaking, doors swinging, she thought the contractors working on the new highway were blowing something up, they are about 2km away from us.
Moderate, Very Deep and reasonably Close, rare location
Reported Felt as
Moderate [1]: Auckland
Slight [3]: Feilding, Wellington, Wellington Cbd
Total 4
before the one here in Lower NI yesterday morning, which was actually 2.9926ML, so gets a green icon instead of a Grey one (M3.0)
I think I'm going to dump the NZ earthquake maps on ikimaps, I set it up to rotate every day over a 7 day period, but its too much work, just going to have KML available now, gives me more free time to backtrack on my older NZ maps before Google Classic Maps goes blank in Feb 2015. I''ll keep using ikimaps for the Bardarbunga pages.
Looks like ikimaps is being abused by some commercial entities, lots of people are putting up blank maps which don't even have an icon to show location, but they have a spam description on their company in the description box, free advertising.. I don't think this is what the designers of ikimaps had in mind.
ID: 2014p906006 Network: geonet
Status: automatic
Date/Time NZDT: 02/12/2014 18:19:49
Date/Time UTC: 02/12/2014 05:19:49
Latitude, Longitude: -38.1771, 172.071
Magnitude: 5.06M
Depth: 750.00 km
Energy Released: 582.8520 tonnes of TNT
Location: Off W. Coast Of N. Island. N.Z.
www.ikimap.com...,-85.678104,-26.054225,70.365869&BASE=omap
Reported Felt as
Moderate [1]: Auckland
Slight [3]: Feilding, Wellington, Wellington Cbd
Total 4
before the one here in Lower NI yesterday morning, which was actually 2.9926ML, so gets a green icon instead of a Grey one (M3.0)
edit on 12u33633614 by muzzy because: (no reason given)
I think I'm going to dump the NZ earthquake maps on ikimaps, I set it up to rotate every day over a 7 day period, but its too much work, just going to have KML available now, gives me more free time to backtrack on my older NZ maps before Google Classic Maps goes blank in Feb 2015. I''ll keep using ikimaps for the Bardarbunga pages.
Looks like ikimaps is being abused by some commercial entities, lots of people are putting up blank maps which don't even have an icon to show location, but they have a spam description on their company in the description box, free advertising.. I don't think this is what the designers of ikimaps had in mind.
edit on 12u33633614 by muzzy because: (no reason given)
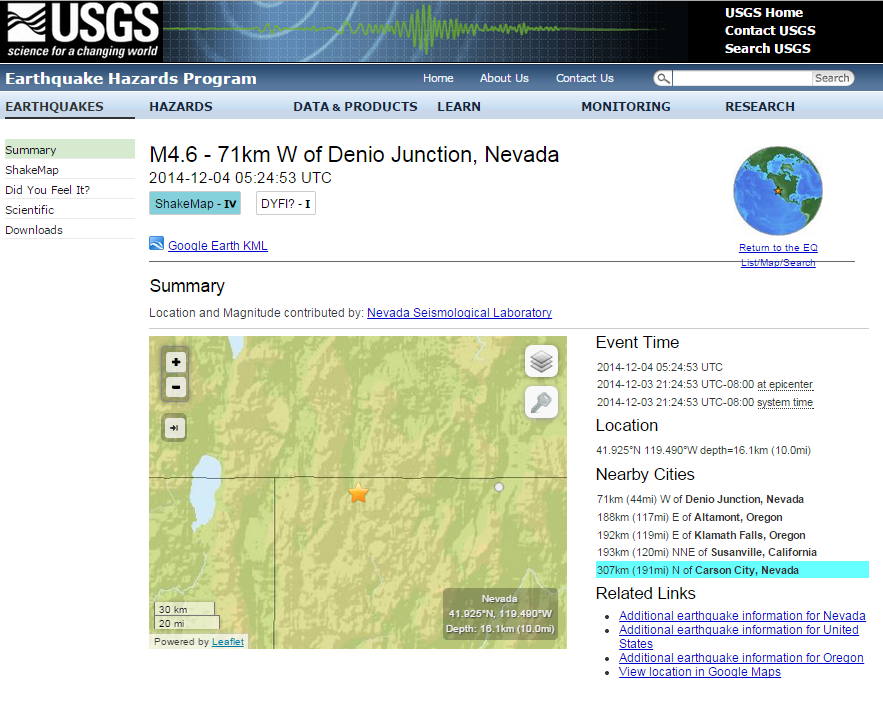
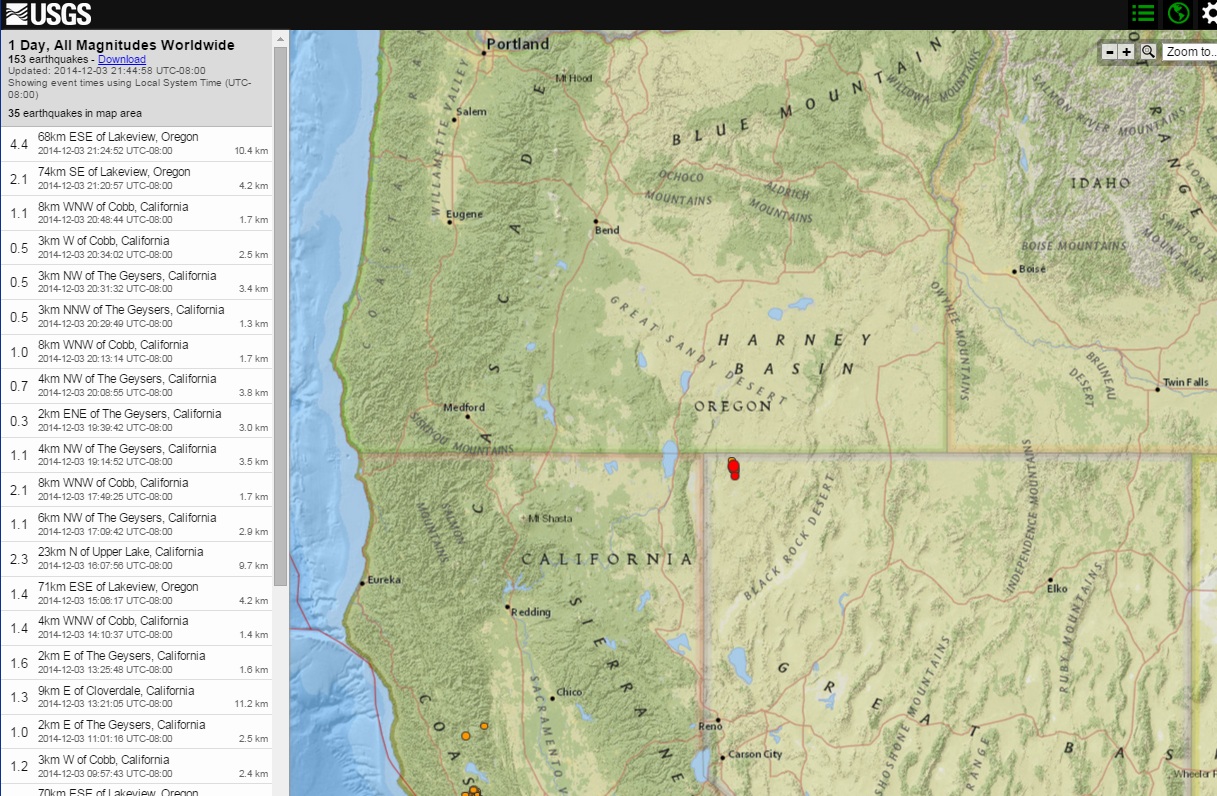
M4.6
earthquake.usgs.gov...
- 71km W of Denio Junction, Nevada
2014-12-04 05:24:53 UTC
Event Time
2014-12-04 05:24:53 UTC
2014-12-03 21:24:53 UTC-08:00 at epicenter
2014-12-03 21:24:53 UTC-08:00 system time
Location
41.925°N 119.490°W depth=16.1km (10.0mi)
Nearby Cities
71km (44mi) W of Denio Junction, Nevada
188km (117mi) E of Altamont, Oregon
192km (119mi) E of Klamath Falls, Oregon
193km (120mi) NNE of Susanville, California
307km (191mi) N of Carson City, Nevada
files.abovetopsecret.com...
files.abovetopsecret.com...
M4.4 - 68km ESE of Lakeview, Oregon
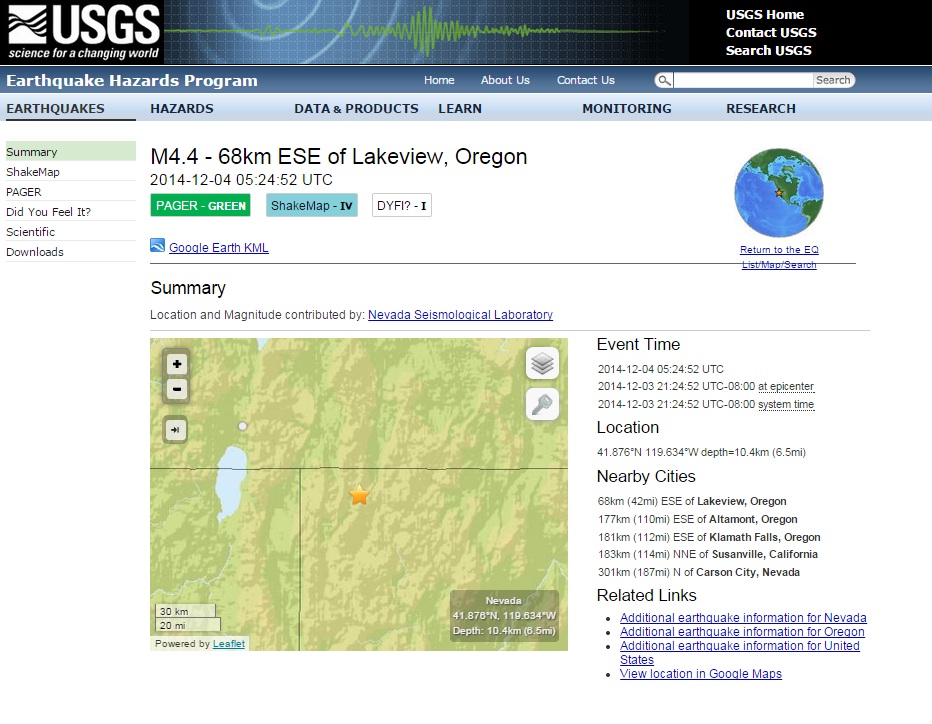
Event Time
2014-12-04 05:24:52 UTC
2014-12-03 21:24:52 UTC-08:00 at epicenter
2014-12-03 21:24:52 UTC-08:00 system time
Location
41.876°N 119.634°W depth=10.4km (6.5mi)
Nearby Cities
68km (42mi) ESE of Lakeview, Oregon
177km (110mi) ESE of Altamont, Oregon
181km (112mi) ESE of Klamath Falls, Oregon
183km (114mi) NNE of Susanville, California
301km (187mi) N of Carson City, Nevada
files.abovetopsecret.com...
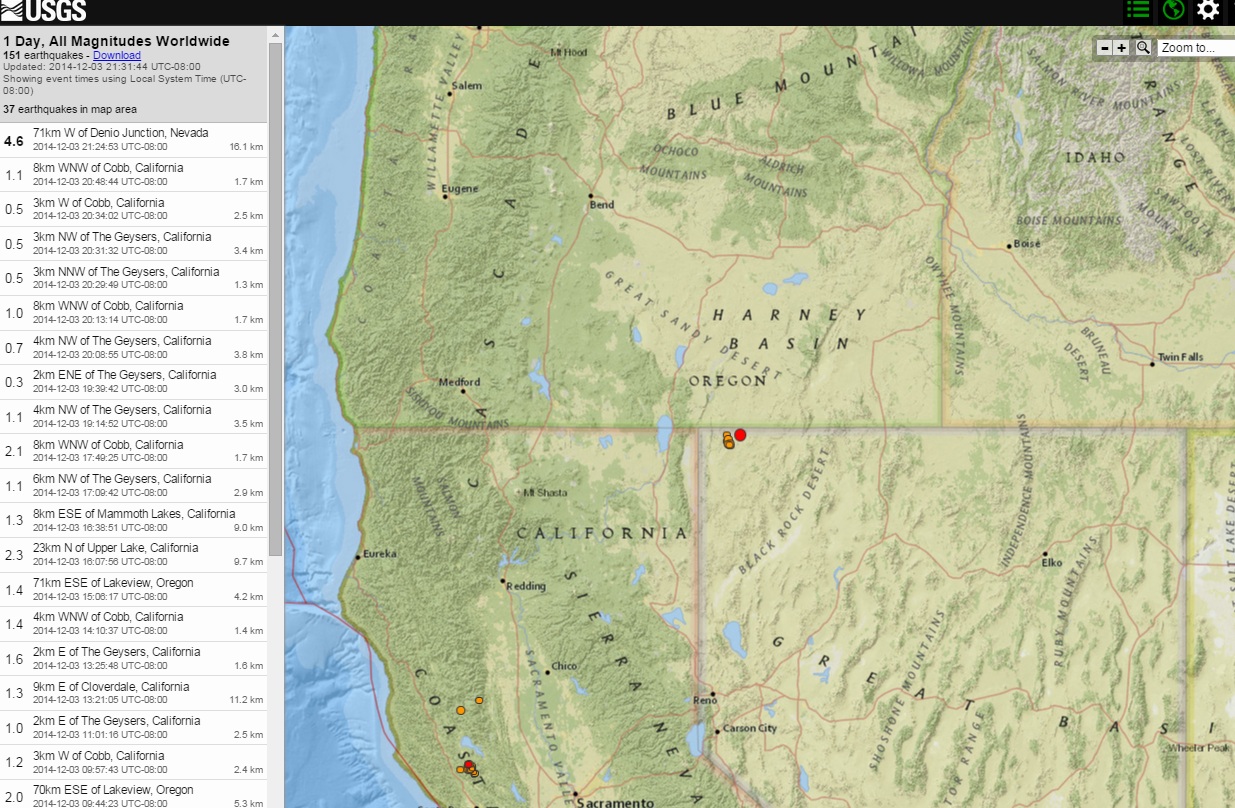
earthquake.usgs.gov...
Last time i checked thats was still part of Nevada ?
files.abovetopsecret.com...
M4.2 - 68km ESE of Lakeview, Oregon
2014-12-04 05:24:52 UTC
earthquake.usgs.gov...
earthquake.usgs.gov...
- 71km W of Denio Junction, Nevada
2014-12-04 05:24:53 UTC
Event Time
2014-12-04 05:24:53 UTC
2014-12-03 21:24:53 UTC-08:00 at epicenter
2014-12-03 21:24:53 UTC-08:00 system time
Location
41.925°N 119.490°W depth=16.1km (10.0mi)
Nearby Cities
71km (44mi) W of Denio Junction, Nevada
188km (117mi) E of Altamont, Oregon
192km (119mi) E of Klamath Falls, Oregon
193km (120mi) NNE of Susanville, California
307km (191mi) N of Carson City, Nevada
files.abovetopsecret.com...
files.abovetopsecret.com...
M4.4 - 68km ESE of Lakeview, Oregon
Event Time
2014-12-04 05:24:52 UTC
2014-12-03 21:24:52 UTC-08:00 at epicenter
2014-12-03 21:24:52 UTC-08:00 system time
Location
41.876°N 119.634°W depth=10.4km (6.5mi)
Nearby Cities
68km (42mi) ESE of Lakeview, Oregon
177km (110mi) ESE of Altamont, Oregon
181km (112mi) ESE of Klamath Falls, Oregon
183km (114mi) NNE of Susanville, California
301km (187mi) N of Carson City, Nevada
files.abovetopsecret.com...
earthquake.usgs.gov...
Last time i checked thats was still part of Nevada ?
files.abovetopsecret.com...
M4.2 - 68km ESE of Lakeview, Oregon
2014-12-04 05:24:52 UTC
earthquake.usgs.gov...
edit on 7/30/2012 by dreamfox1 because: (no reason given)
new topics
-
Any one suspicious of fever promotions events, major investor Goldman Sachs card only.
The Gray Area: 1 hours ago -
God's Righteousness is Greater than Our Wrath
Religion, Faith, And Theology: 5 hours ago -
Electrical tricks for saving money
Education and Media: 8 hours ago -
VP's Secret Service agent brawls with other agents at Andrews
Mainstream News: 10 hours ago -
Sunak spinning the sickness figures
Other Current Events: 10 hours ago -
Nearly 70% Of Americans Want Talks To End War In Ukraine
Political Issues: 11 hours ago
top topics
-
VP's Secret Service agent brawls with other agents at Andrews
Mainstream News: 10 hours ago, 9 flags -
Cats Used as Live Bait to Train Ferocious Pitbulls in Illegal NYC Dogfighting
Social Issues and Civil Unrest: 14 hours ago, 8 flags -
Electrical tricks for saving money
Education and Media: 8 hours ago, 4 flags -
Nearly 70% Of Americans Want Talks To End War In Ukraine
Political Issues: 11 hours ago, 3 flags -
Sunak spinning the sickness figures
Other Current Events: 10 hours ago, 3 flags -
Late Night with the Devil - a really good unusual modern horror film.
Movies: 12 hours ago, 2 flags -
The Good News According to Jesus - Episode 1
Religion, Faith, And Theology: 16 hours ago, 1 flags -
Any one suspicious of fever promotions events, major investor Goldman Sachs card only.
The Gray Area: 1 hours ago, 1 flags -
God's Righteousness is Greater than Our Wrath
Religion, Faith, And Theology: 5 hours ago, 0 flags
active topics
-
Sunak spinning the sickness figures
Other Current Events • 8 • : McUrnsalso -
God's Righteousness is Greater than Our Wrath
Religion, Faith, And Theology • 10 • : randomuser2034 -
-@TH3WH17ERABB17- -Q- ---TIME TO SHOW THE WORLD--- -Part- --44--
Dissecting Disinformation • 661 • : Justoneman -
SETI chief says US has no evidence for alien technology. 'And we never have'
Aliens and UFOs • 59 • : andy06shake -
HORRIBLE !! Russian Soldier Drinking Own Urine To Survive In Battle
World War Three • 36 • : TheMisguidedAngel -
British TV Presenter Refuses To Use Guest's Preferred Pronouns
Education and Media • 146 • : Consvoli -
Nearly 70% Of Americans Want Talks To End War In Ukraine
Political Issues • 19 • : Consvoli -
Terrifying Encounters With The Black Eyed Kids
Paranormal Studies • 76 • : Consvoli -
Samuel Aun Woer
Religion, Faith, And Theology • 27 • : helebi20 -
Any one suspicious of fever promotions events, major investor Goldman Sachs card only.
The Gray Area • 2 • : Cavemannick