It looks like you're using an Ad Blocker.
Please white-list or disable AboveTopSecret.com in your ad-blocking tool.
Thank you.
Some features of ATS will be disabled while you continue to use an ad-blocker.

No Evidence That Global Warming is manmade
page: 5share:
A lie, before your edit, huh?
Moderator, please end this thread.
Moderator, please end this thread.
Originally posted by TheAvenger
I started this thread, I'm not here to take a schoolboy's quiz. Perhaps I should kill it because it has digressed to this level of absurdity.
I see nothing absurd.
If you don't want to talk about the subject "No Evidence That Global Warming is manmade", why are you still posting in this thread?
I will not be called a liar by anyone Mr. Loam. You wisely edited the remark, but it was there.
Moderator kill this thread.
Moderator kill this thread.
Originally posted by TheAvenger
I will not be called a liar by anyone Mr. Loam. You wisely edited the remark, but it was there.
Moderator kill this thread.
Why? It's getting interesting now.
Lets take this quote:
Recalculating this amount into the total anthropogenic carbon dioxide emission in grams of CO2, one obtains the estimate 1.003×10¹⁸ g, which constitutes less than 0.00022% of the total CO2 amount naturally degassed from the mantle during geologic history. Comparing these figures, one can conclude that anthropogenic carbon dioxide emission is negligible (indistinguishable) in any energy-matter transformation processes changing the Earth’s climate.
schwinger.harvard.edu...
The authors are having a laugh, no?
If it was emitted over the course of geological history it would be negligible. But when it has happened in a few hundred years, it could be just a little more significant, no?
This is the sort of joke science these contrarians get ridiculed for. This is worse than Soon & Baliunas' study.
[edit on 3-4-2007 by melatonin]
Originally posted by TheAvenger
I will not be called a liar by anyone Mr. Loam. You wisely edited the remark, but it was there.
Yes it was....for as long as it took me to proof read my post and choose the correct word that matched my intention. I do not know whether you intended to say something untrue. The choice of my edit makes that clear.
[edit on 3-4-2007 by loam]
Originally posted by thelibra
..............
Do you agree or disagree with the assessment that we are experiencing global climate change and that it is being amplified by the actions of mankind?
Climate Change is happening, as it has been happening for 4.2 to 4.5 billion years on Earth, but mankind has nothing to do with Climate Change/Global Warming.
Originally posted by thelibra
So please enlighten me as to how you have found peer reviewed papers printed in the last year that adequately refutes mankind's involvement in global climate change. I'm going to hazard that you haven't, and that instead you've found articles in magazines, newspapers, or a web site. I could be wrong, and I leave myself open to this possibility, but so far more than 90% of the worldwide scientific community has the hard, peer-reviewed data to prove that "Yes, humans have significantly contributed to global climate change."
Kind of funy that anyone just drops in into the debate makes a wild remark and thinks that's the proof that mankind is the cause for Climate Change/Global Warming....
There are thousands of scientists that disagree with the claim that mankind is at fault for Climate Change/Global Warming, and at no time has the "scientific concensus", which nowadays is nothing more than agreeing with the policymakers, shown to be true just because the "policymakers" agree with it...
We have been discussing this topic in several threads now and provided tons of information from research which shows the current warming is a continuation of the warming the Earth has been experiencing on the overall since the last Ice Age, during the time period known as the Holocene.
The following is just one of the many articles which shows the current warming trends, and the "melting of glaciers in some areas, while on others there is increase ice mass", have nothing to do with human activities.
The Arctic shelf is currently undergoing dramatic thermal changes caused by the continued warming associated with Holocene sea level rise. During this transgression, comparatively warm waters have flooded over cold permafrost areas of the Arctic Shelf. A thermal pulse of more than 10°C is still propagating down into the submerged sediment and may be decomposing gas hydrate as well as permafrost.
www.agu.org...
If you want to discuss the topic, then keep yourself updated into what has been discussed and the evidence that has been presented instead of just dropping in and making wild claims out of nowhere...
[edit on 3-4-2007 by Muaddib]
Originally posted by melatonin
............
This is the sort of joke science these contrarians get ridiculed for. This is worse than Soon & Baliunas' study.
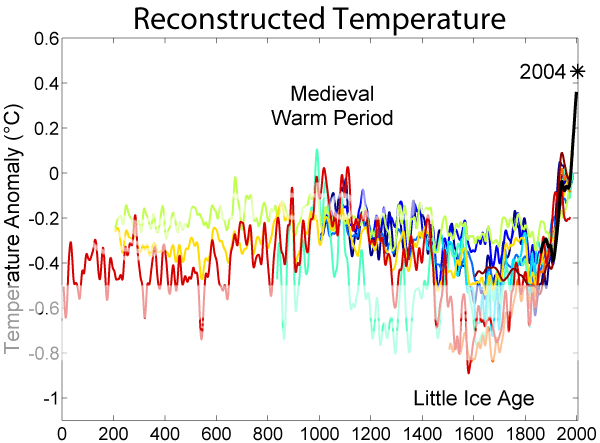
You mean worse than you and your crowd continuously quoting from Real Climate the same site where Mann is one of the directors and the same Mann that alongside some of his colleages tried to bury the Medieval Warming and the Little Ice Age events?.....
Not to mention the fact that Real Climate is being provided web hosting and "support" by EMS, an organization founded by Arlie Schardt, who has been the communications director for Al Gore in 2000, while also been press secretary to Al Gore in 1988 and in 1998.
Humm, wonder who is going to be the communications director, or perform some other higher job for Al Gore in 2008?...
[edit on 3-4-2007 by Muaddib]
Originally posted by melatonin
The authors are having a laugh, no?
If it was emitted over the course of geological history it would be negligible. But when it has happened in a few hundred years, it could be just a little more significant, no?
I always hear that the CO2 man contributes is significantly less than 1% of what would occur were we not here... is that (above) the kind of logic used to get that figure? How is the % of CO2 man is responsible for calculated, the 'for dummies version' please.
If these guys are arguing this the way you've shown here that's a bit scary. It appears to be deliberately mis-leading but I'm not informed enough to understand the larger context.
(edit)here-hear
[edit on 3-4-2007 by Rren]
Originally posted by Muaddib
You mean worse than you and your crowd continuously quoting from Real Cliamte the same site where Mann is one of the directors and the same Mann that alongside some of his colleages tried to bury the Medieval Warming and the Little Ice Age events?.....
No, that's a study that has been essentially replicated by numerous other reconstructions. You should know this by now.
The quote from the article avenger posted is just another nail in the coffin of the scientific credibility of anyone who thinks it contains anything of real merit.
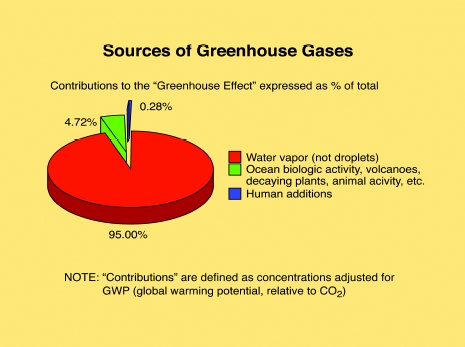
Here is a graph which puts in perspective the CO2 contributed by mankind.
And here is a link to a powerpoint presentation which shows some of the data that refutes the claim "mankind is at fault for Climate Change/Global Warming."
ff.org...
The second link in that site is a powerpoint presentation which anyone interested in this topic should see.
And here is a link to a powerpoint presentation which shows some of the data that refutes the claim "mankind is at fault for Climate Change/Global Warming."
ff.org...
The second link in that site is a powerpoint presentation which anyone interested in this topic should see.
Originally posted by Rren
I always hear that the CO2 man contributes is significantly less than 1% of what would occur were we not here... is that (above) the kind of logic used to get that figure? How is the % of CO2 man is responsible for calculated, the 'for dummies version' please.
If these guys are arguing this the way you've shown here that's a bit scary. It appears to be deliberately mis-leading but I'm not informed enough to understand the larger context.
Hey Rren,
nice to see you in here
The easiest way to really assess it is to remove particular forcings from climate models. These are based in the basic physico-chemical properties of the appropriate atmospheric constituents. The red-herring in the arguments from the likes of Bob Carter (who I think this 95% thing comes from), is that the IR absorption bands for the various GHGs overlap, and they tend to lump clouds and water vapour together.
Thus, using the NASA GISS model, removing water vapour and clouds leaves 34% of the absorption (basically greenhouse effect). If you remove all but water vapour and clouds, you have 85% of the original absorption.
So what they do is take the original 95% figure (which should be 85% really), then take it from 100%, leaving 5% (which should be 34%). Then they attribute 74% of the 5% to CO2 (3.65%). Then they also mislead in saying that 3% of this CO2 is human-sourced. This is in relation to total emissions of CO2 from all natural sources, when in fact about 30% of the current increase in CO2 in human-sourced.
So, in the some twilight zone, you can use 3% (human sourced CO2) x 3.65% (Greenhouse effect) to get a very negligible number (0.11%)
So, it's really a case of between 15-34% forcings for other GHGs. And 66-85% for clouds and water vapour (due to overlapping absorption).
The CO2 attribution should be 9-26% for CO2. And overall comes to about 3-8% for human effects. Quite a bit larger than the misleading numbers suggest.
[edit on 3-4-2007 by melatonin]
Except for the well known fact that CO2 levels have increased for the past 150 years 0.01%.... That's puting together anthropogenic CO2 and
naturally released CO2...
Melatonin, I really don't know how to put it anymore.. You quote from the Real Climate website, where Mann and associates is one of the directors, the same Mann that tried to bury the fact that there was a Medieval Warming and Little Ice Age events, and at the same time you "try" to dismiss people like Dr. Akasofu who has been the director of the International Arctic Research Center since 1998 until early 2007 when he retired...
You have even claimed that Dr. Akasofu has no relevant knowledge on Climate, despite the fact that he has "has published more than 550 professional journal articles" and written 10 books which deal not only with "auroral work", but also has written books on "Solar-terrestrial physics" and other works which has everything to do with Climate Change...
www.gi.alaska.edu...
[edit on 3-4-2007 by Muaddib]
Melatonin, I really don't know how to put it anymore.. You quote from the Real Climate website, where Mann and associates is one of the directors, the same Mann that tried to bury the fact that there was a Medieval Warming and Little Ice Age events, and at the same time you "try" to dismiss people like Dr. Akasofu who has been the director of the International Arctic Research Center since 1998 until early 2007 when he retired...
You have even claimed that Dr. Akasofu has no relevant knowledge on Climate, despite the fact that he has "has published more than 550 professional journal articles" and written 10 books which deal not only with "auroral work", but also has written books on "Solar-terrestrial physics" and other works which has everything to do with Climate Change...
Now in retirement, the 76-year-old former director of both UAF’s Geophysical Institute and International Arctic Research Center is digging in on a new idea that runs contrary to popular beliefs—that today’s global warming might be more due to the planet’s natural recovery from its last cold period than from our pumping of greenhouse gases into the air. Akasofu recently gave a talk at the International Arctic Research Center in which he presented evidence for how the world has warmed in a steady fashion from well before the Industrial Revolution to the current day.
“If you look back far enough, we have a bunch of data that show that warming has gone on from the 1600s with an almost linear increase to the present,” Akasofu said. He showed ice core data from the Russian Arctic that shows warming starting from the early 1700s, temperature records from England showing the same trend back to 1660, and ice breakup dates at Tallinn, Estonia, that show a general warming since the year 1500.
Akasofu said scientists who support the manmade greenhouse gas theory disregard information from centuries ago when exploring the issue of global warming. Satellite images of sea ice in the Arctic Ocean have only been available in the satellite era since the 1960s and 1970s.
www.gi.alaska.edu...
[edit on 3-4-2007 by Muaddib]
Originally posted by Muaddib
And I also note with interest that you are giving a link to Real Climate, a website where Michael Mann is one of the directors...the same Mann that tried to make a dissapearing act of the Medieval Warming and the Little Ice Age events....
A more balanced view…
Originally posted by Muaddib
Maudibb
How about that source for your graph???
That graph itself gives credit to it's creators.
www.geocraft.com is not very helpful, but I managed to figure it out. Moreover, the graph itself improperly credits the sources for the information. You have to go here to see that.
The two sources are:
Temperature after C.R. Scotese
and
CO2 after R.A. Berner & Z. Kothavala, 2001 .
So let’s discuss this graph.
First, as I have already pointed out, it is a compilation of data from two graphs into one.
The creator seems to make a lot of undocumented claims, found nowhere in the underlying sources:
For example, Berner’s actual research paper says:
This means that there appears to have been very high early Paleozoic levels of CO2, followed by a large drop during the Devonian, and a rise to moderately high values during the Mesozoic, followed by a gradual decline through both the later Mesozoic and Cenozoic. This type of modeling is incapable of delimiting shorter term CO2 fluctuations (Paleocene-Eocene boundary, late Ordovician glaciation) because of the nature of the input data which is added to the model as 10 my or longer averages.
Did you get that???? 10 Million year increments!
He continues:
Thus, exact values of CO2, as shown by the standard curve, should not be taken literally and are always susceptible to modification. Nevertheless, the overall trend remains. This means that over the long term there is indeed a correlation between CO2 and paleotemperature, as manifested by the atmospheric greenhouse effect.
But wait! Isn’t that the opposite of what our West Virginia guy says?
Berner is also quoted here saying:
“The geologic record over the past 550 million years indicates a good correlation,” said Robert A. Berner, a Yale geologist and pioneer of paleoclimate analysis. “There are other factors at work here. But in general, global warming is due to CO2. It was in the past and is now.”
Apparently, the co-author of Berner’s paper, Z. Kothavala, even says:
It is now well known that concentrations of greenhouse gases in the atmosphere have been increasing since the mid 19th century as a result of human activities.
www3.interscience.wiley.com...=1&SRETRY=0" target="_blank" class="postlink" rel="nofollow"> "Assessing simulations of daily temperature and precipitation variability with global climate models for present and enhanced greenhouse climates", by K. McGuffie, A. Henderson-Sellers, N. Holbrook, Z. Kothavala, O. Balachova, and J. Hoekkstra, International Journal of Climatology, vol. 19, pg. 1-2 (1999)
Also found www.drudgeforum.com..." target="_blank" class="postlink" rel="nofollow">here.
With regard to Scotese’s portion of the graph…
Unlike Berner and Kothavala, who actually studied the issue of CO2 and temperature correlation, Scotese never says anything of the kind. Why? Because his focus is on plate tectonics…NOT the GW issue.
This graph is a bad PASTE job with no science to support the assertions being made from it.
[edit on 3-4-2007 by loam]
BTW...that last graph I gave comes from the following powerpoint presentation.
The second link in the following link gives the powerpoint presentation, by Dr. Lee C. Gerhard, who put together data and graphs from differentsources which give a different picture to what people like Mann have tried to claim.
ff.org...
The second link in the following link gives the powerpoint presentation, by Dr. Lee C. Gerhard, who put together data and graphs from differentsources which give a different picture to what people like Mann have tried to claim.
ff.org...
Originally posted by loam
A more balanced view…
A "more balanced view"... is that what they say nowadays when scientists try to hide the truth about Climate Change?....
Originally posted by loam
But wait! Isn’t that the opposite of what our West Virginia guy says?
Research shows that CO2 levels lag temperatures by an average of 400 years. There are times when the lag is less at about 80 years, and at other times up to 800 years. During the current period it appears that CO2 levels lagged behind temperatures by about 260 years.
Originally posted by loam
Berner is also quoted here saying:
............
Yes, there are scientists who believe CO2 has caused Global Warming, and there are others who don't...
Your claim of a "bad PASTE job" was actually done by "scientists"...not by Al Gore's crowd...
I can also show you research done in Florida where a scientist found proof that there was several Clmate Changes in North America during the same time period that the Roman Warming was experienced in Europe, yet after she shows her research she claims this Climate Change was done by the Roman building their roads and clear cutting trees....
Scientists can have their own opinion even if their research shows the contrary...
Rren
I'm not buying what Maudibb is selling on this one and neither should you.
He can make the amount of CO2 appear as insignificant as he wants, but it wouldn't be because of science.
His pie chart isn't factually correct, and neither is his interpretation of it.
See, for example: Gases: Man versus the Volcanoes
and
Water vapour: feedback or forcing?
Also, Maudibb can whine all he wants about Real Climate, but he never actually disputes the substance of the science presented. In other words, his arguments stop there. All he has is a misguided political opinion.
[edit on 3-4-2007 by loam]
Originally posted by Muaddib
Originally posted by loam
A more balanced view…
A "more balanced view"... is that what they say nowadays when scientists try to hide the truth about Climate Change?....
Another political opinion. Never mind actually addressing the scientific arguments.
Originally posted by Muaddib
Originally posted by loam
But wait! Isn’t that the opposite of what our West Virginia guy says?
Research shows that CO2 levels lag temperatures by an average of 400 years. There are times when the lag is less at about 80 years, and at other times up to 800 years. During the current period it appears that CO2 levels lagged behind temperatures by about 260 years.
Huh?
That isn't even responsive to the issue! Berner's study admits 10 MILLION YEAR or MORE gaps in its data. Its says:
It should be emphasized that GEOCARB modeling has only a long time resolution. Data are input into the model at 10 million year intervals with linear interpolation between. In the case of rock abundance data, averages for up to 30 million year time slices are sometimes used. Thus, shorter term phenomena occurring over a few million years or less are generally missed in this type of modeling.
What you say is unresponsive and unintelligible.
Originally posted by Muaddib
Originally posted by loam
Berner is also quoted here saying:
............
Yes, there are scientists who believe CO2 has caused Global Warming, and there are others who don't...
Again, unresponsive and unintelligible.
The graph you used to say "the geological record has shown us that CO2 levels could be high during warm and cold events" is based on the very study where Berner says: "This means that over the long term there is indeed a correlation between CO2 and paleotemperature, as manifested by the atmospheric greenhouse effect."
In other words, he disagrees with you based on his research. You use a mischaracterization of that research to say the opposite.
Originally posted by Muaddib
Your claim of a "bad PASTE job" was actually done by "scientists"...
Oh, really?
Who were the scientists that put the two graphs together??? Find me who that was. SPECIFICALLY.
Without that you have nothing! Other than what some guy in West Virginia decided to post on his website about fossils.
Originally posted by Muaddib
I can also show you research...
Show me the science... and spare me your political rhetoric and faulty interpretations.
So far, you have nothing.
[edit on 3-4-2007 by loam]
Originally posted by loam
Another political opinion. Never mind actually addressing the scientific arguments.
It has nothing to do with politics...it is the truth, even the IPCC refrained from referencing the Hockey Stick Graph because it has been discredited, yet you and some other lackeys of Mann have been trying to corroborate that false data in these forums for a while now....
Originally posted by Muaddib
Huh?
That isn't even responsive to the issue! Berner's study admits 10 MILLION YEAR or MORE gaps in its data.
See anwser below.
Originally posted by loam
What you say is unresponsive and unitelligible.
I "might" have taken that statement a bit more seriously if only you knew how to spell "unintelligible"....
Originally posted by loam
The graph you used to say "the geological record has shown us that CO2 levels could be high during warm and cold events" is based on the very study where Berner says: "This means that over the long term there is indeed a correlation between CO2 and paleotemperature, as manifested by the atmospheric greenhouse effect."
In other words, he disagrees with you based on his research. You use a mischaracterization of that research to say the opposite.
Really?... Could you tell us then why is it that several research work has shown that temperatures were much higher during the Medieval Warming and the Roman Warming events, yet CO2 levels were much lower than today?....
Originally posted by loam
Oh, really?
Who were the scientists that put the two graphs together??? Find me who that was. SPECIFICALLY.
According to Dr. Lee C. Gerhard, who has that same graph in his powerpoint presentation it was done by the Kansas Geological Society.
Originally posted by loam
Without that you have nothing! Other than what some guy in West Virginia decided to post on his website about fossils.
Lol... actually I have posted more research and excerpts to corroborate my statements than you have posted "Yawns"...
"Yawning" is what you are good at loam, do yourself a favor and stick to it....
Originally posted by loam
Show me the science... and spare me your political rhetoric and faulty interpretations.
Oh i have, several times, you were too busy sleeping or "yawning" all day long for the past several weeks....
[edit on 3-4-2007 by Muaddib]
Originally posted by loam
...........
He can make the amount of CO2 appear as insignificant as he wants, but it wouldn't be because of science.
And science tells us that water vapor is a worse greenhouse gas than CO2, it retains twice the amoung of heat than CO2, and it exists in larger abundance in the atmosphere than CO2. During warming events water vapor, and natural occuring CO2 levels, alongside other trace gases, increase also. So a good amount of CO2 increase in the past 150 years is natural. Yet Loam, melatonin and the rest of Al Gore/Mann's lackeys continuously dismiss these facts, and they don't blame the "evil water vapor trace gas"...
[edit on 3-4-2007 by Muaddib]
Originally posted by Muaddib
Originally posted by loam
Another political opinion. Never mind actually addressing the scientific arguments.
It has nothing to do with politics...it is the truth, even the IPCC refrained from referencing the Hockey Stick Graph because it has been discredited, yet you and some other lackeys of Mann have been trying to corroborate that false data in these forums for a while now....
I'm Mann's lackey now?
Originally posted by Muaddib
Originally posted by loam
What you say is unresponsive and unintelligible.
I "might" have taken that statement a bit more seriously if only you knew how to spell "unintelligible"....
Huh? So you avoid my point and decide to attack my spelling?
unintelligible
:shk:
Didn't like the substance of what I had to say, did you?
Originally posted by Muaddib
Could you tell us then why is it that several research work has shown that temperatures were much higher during the Medieval Warming and the Roman Warming events, yet CO2 levels were much lower than today?....
I'm done answering your UNDOCUMENTED questions. Show me something. Make a point about what you think it might show. I will go from there.
Originally posted by Muaddib
Originally posted by loam
Who were the scientists that put the two graphs together??? Find me who that was. SPECIFICALLY.
According to Dr. Lee C. Gerhard, who has that same graph in his powerpoint presentation it was done by the Kansas Geological Society.
That didn't answer my question. As I have already shown, your West Virginia fossil guy didn't get the credit right either. If this graph is what you say it is, WHO TAKES CREDIT for this great smoking gun against the prevailing scientific view?
Why the tough time determining its origin?
Originally posted by Muaddib
Originally posted by loam
Without that you have nothing! Other than what some guy in West Virginia decided to post on his website about fossils.
Lol... actually I have posted more research and excerpts to corroborate my statements than you have posted "Yawns"...
"Yawning" is what you are good at loam, do yourself a favor and stick to it....
Another personal attack...because you can do nothing else.
Originally posted by Muaddib
Originally posted by loam
Show me the science... and spare me your political rhetoric and faulty interpretations.
Oh i have, several times, you were too busy sleeping or "yawning" all day long for the past several weeks....
Like I said. You have nothing.
new topics
-
A Warning to America: 25 Ways the US is Being Destroyed
New World Order: 4 hours ago -
President BIDEN's FBI Raided Donald Trump's Florida Home for OBAMA-NORTH KOREA Documents.
Political Conspiracies: 9 hours ago -
Maestro Benedetto
Literature: 11 hours ago -
Is AI Better Than the Hollywood Elite?
Movies: 11 hours ago
top topics
-
President BIDEN's FBI Raided Donald Trump's Florida Home for OBAMA-NORTH KOREA Documents.
Political Conspiracies: 9 hours ago, 28 flags -
Gaza Terrorists Attack US Humanitarian Pier During Construction
Middle East Issues: 16 hours ago, 8 flags -
A Warning to America: 25 Ways the US is Being Destroyed
New World Order: 4 hours ago, 8 flags -
Las Vegas UFO Spotting Teen Traumatized by Demon Creature in Backyard
Aliens and UFOs: 15 hours ago, 6 flags -
2024 Pigeon Forge Rod Run - On the Strip (Video made for you)
Automotive Discussion: 15 hours ago, 4 flags -
Is AI Better Than the Hollywood Elite?
Movies: 11 hours ago, 3 flags -
The functionality of boldening and italics is clunky and no post char limit warning?
ATS Freshman's Forum: 17 hours ago, 1 flags -
Maestro Benedetto
Literature: 11 hours ago, 1 flags
active topics
-
A Warning to America: 25 Ways the US is Being Destroyed
New World Order • 6 • : theatreboy -
Supreme Court to decide if states can control fate of social media
Education and Media • 14 • : SMMPanelPro -
Gaza Terrorists Attack US Humanitarian Pier During Construction
Middle East Issues • 35 • : Lazy88 -
Definitive 9.11 Pentagon EVIDENCE.
9/11 Conspiracies • 426 • : Lazy88 -
Alternate Electors vs Fake Electors - What is the Difference.
2024 Elections • 117 • : ADVISOR -
-@TH3WH17ERABB17- -Q- ---TIME TO SHOW THE WORLD--- -Part- --44--
Dissecting Disinformation • 691 • : Imbackbaby -
Victoria government has cancelled the commmonwealth games, no money.
Regional Politics • 3 • : nazaretalazareta -
President BIDEN's FBI Raided Donald Trump's Florida Home for OBAMA-NORTH KOREA Documents.
Political Conspiracies • 19 • : ADVISOR -
When an Angel gets his or her wings
Religion, Faith, And Theology • 22 • : AcrobaticDreams1 -
King Charles 111 Diagnosed with Cancer
Mainstream News • 321 • : FlyersFan