It looks like you're using an Ad Blocker.
Please white-list or disable AboveTopSecret.com in your ad-blocking tool.
Thank you.
Some features of ATS will be disabled while you continue to use an ad-blocker.

There was no global warming hiatus.
page: 5share:
a reply to: mbkennel
RSS have also now released their temperature data for December, which, as with UAH, shows a big drop from the month before.
Annually, RSS co9me to the same conclusion as UAH, that 2016 was 0.02C warmer than 1998.
Opinions on this link?
RSS have also now released their temperature data for December, which, as with UAH, shows a big drop from the month before.
Annually, RSS co9me to the same conclusion as UAH, that 2016 was 0.02C warmer than 1998.
Opinions on this link?
a reply to: D8Tee
February 2016 was the absolute greatest departure from normal at +0.99 in RSS for the TLT. The next highest is March 2016 at +0.87. The next highest is April 1998 at +0.86. You want to know why 1998 is only barely below 2016?
Well, 'a year' is a bit of an arbitrary measurement, given that nature doesn't necessarily follow our Jan - Dec schedule.
It happened that the warmest consecutive 12 months of the 1997-1998 El Niño were Jan 1998 - Dec 1998.
In RSS for the TLT, this is +0.55 for 1998 (this is rounded up).
2015-2016 El Niño did not turn out the same way; the warmest months were not Jan 2016 - Dec 2016.
In RSS for the TLT, this is +0.57 for 2016 (this is rounded down).
The warmest months of the 2015-2016 El Niño were actually Oct 2015 - Sep 2016.
In RSS for the TLT, this is +0.62 for these 12 months (this is rounded up).
The next highest is Nov 2015 - Oct 2016 at +0.61 (this is rounded up).
Then the next highest is Sep 2015 - Aug 2016 at +0.60 (this is rounded down).
Then the next highest is Dec 2015 - Nov 2016 at +0.60 (this is rounded down).
Then the next highest is Aug 2015 - Jul 2016 at +0.60.
Then the next highest is Jul 2015 - Jun 2016 at +0.58 (this is rounded down).
Finally, the next highest is Jun 2015 - May 2016 at +0.58 (this is rounded up).
Incidentally, May 2015 - Apr 2016 was also higher than 1998 at +0.56.
They can weasel word it for now, it will only get warmer.
edit on 19Sat, 07 Jan 2017 19:35:28 -0600America/ChicagovAmerica/Chicago1 by Greven
because: (no reason given)
a reply to: D8Tee
I think you would have to get in contact with the people who process the data. In addition to commercial shipping, there are dedicated research vessels and navy vessels which would cover a wider area.
The data now is better because of the Argo ocean monitoring system of thousands of drones.
I think you would have to get in contact with the people who process the data. In addition to commercial shipping, there are dedicated research vessels and navy vessels which would cover a wider area.
The data now is better because of the Argo ocean monitoring system of thousands of drones.
originally posted by: TheRedneck
a reply to: Greven
Hey, you're good! Switching from oceanic temperature adjustments to sea ice area... and I fell for it! Maybe next page you can switch to polar bear population...
Now, care to talk about polar ice volume? Area isn't really the issue, and neither is sea ice alone.
I can't help that you can't read a chart that clearly says Global Sea Ice Area yet come to the conclusion that it's temperature. You were complaining about the signal-to-noise ratio in temperatures. So, I provided a chart of global sea ice area, since it's a good indicator for temperature as well as being either there or not.
You might not like the answer for volume:
December 2016 sea ice volume was 11,200 km3 , nearly 1000 km3 below the previous record for December in 2012. This record is in part the result of anomalously high temperatures throughout the Arctic for November and end of December discussed here and here. 2016 December volume was 52% below the maximum December ice volume in 1979, 39% below the 1979-2015 mean, and about 1.3 standard deviations below the long term trend line.
Sea ice was far below average in the Antarctic, a departure from recent years of being above average. I'm uncertain off-hand where to dig up that info, and I feel like I do a lot of work while being met with little to none.
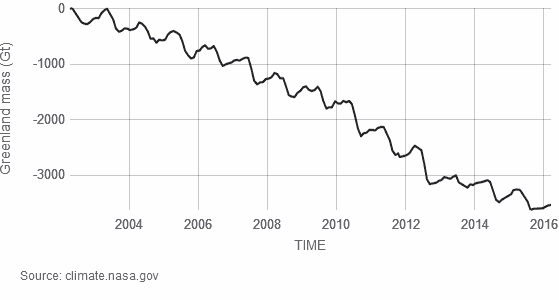
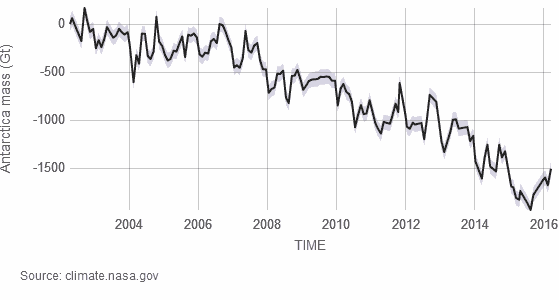
As to volume of the land ice...? Not great, from March 2016:
Antarctica is trending -118.0 Gt/yr ±79, though at last measurement it had been rising.
Greenland is trending -281.0 Gt/yr ±25.
edit on 20Sat, 07 Jan 2017 20:39:18 -0600America/ChicagovAmerica/Chicago1 by Greven because: (no
reason given)
a reply to: Greven
Gee, I would expect you to be a bit more magnanimous after that admission of error... oh, well, never mind.
I will point out that sea ice area is not a good indicator of temperature. It is a binary picture of greater than vs. less than freezing point temperatures, indeterminate at freezing point.
I am not going to debate you over Arctic ice volume. It is indeed decreasing, primarily because colder air is being moved farther south than it used to be. That increases local Arctic temperatures. One intriguing aspect is that the Bering Current is warming. The southern flow seems to have abated to some degree starting last winter, so I would expect reports to show a slowing at least of the localized sea ice loss.
As to the Antarctic, there is data in those links concerning it. I will need some time to review the data.
TheRedneck
What about the blip? What are these guys talking about doing? Hiatus, Blip, whatever you want to call them, they're just data points, and it seems
data points are quite easy to change.
Wigley and Jones
Wigley and Jones
So, if we could reduce the ocean blip by, say, 0.15 degC,
then this would be significant for the global mean -- but
we'd still have to explain the land blip.
a reply to: D8Tee
The thing that really gets me is "precise to 1/100 degrees". We know that not instrument is capable of measuring to that degree of precision so the extra 0.05 results in rounding up errors etc etc.
And even with the problems of precision, I never see a discussion of the accuracy of each data set.
Tired of Control Freaks
a reply to: Greven
We know about Antarctica ice and cause of the ice loss
www.sciencemag.org...
Which goes to prove that current warming is just a repeat of warming in 1930s and 1940s.
Tired of Control Freaks
We know about Antarctica ice and cause of the ice loss
www.sciencemag.org...
n 1945, a year after the Allies stormed the beaches of Normandy, the ocean was busy establishing a beachhead of its own, burrowing beneath a fortified section of an important Antarctic glacier. Pine Island Glacier, a Texas-sized, 2-kilometer-thick ice sheet (pictured), is the linchpin of the rapidly disappearing West Antarctic Ice Sheet—one of the largest drivers of uncertainty for sea level rise this century. No glacier has lost more water to the ocean in recent years: It is thinning by more than a meter each year as warm ocean water creeps in and melts it from underneath, hollowing out a vast ice shelf. Now, scientists can trace the beginning of this accelerated melting to a surge of warming in the Pacific Ocean more than 70 years ago. Researchers already knew that in the 1970s the glacier lost contact with an undersea ridge that had held ocean water at bay. But how long did it take for the ocean to worm its way through? Working in remote conditions, researchers in the winter of 2012 ran a drill through 450 meters of ice and 500 meters of ocean to collect seafloor sediments on either side of this lost bulwark. Analyzing and dating these rocks, they found that ocean water began to appear on the ridge's land-facing side in 1945, even as the ice sheet remained grounded on the ridge’s summit, scientists report online today in Nature. Furthermore, they found that the incursion of ocean water followed a notably warm El Niño in the Pacific Ocean between 1939 and 1942. It would be nearly a half-century before the oceans around Antarctica saw such warmth again. Yet the water in the cavity never refroze, suggesting that the melting of some ice sheets will be difficult to reverse, even if human-driven warming is curbed.
Which goes to prove that current warming is just a repeat of warming in 1930s and 1940s.
Tired of Control Freaks
originally posted by: D8Tee
What about the blip? What are these guys talking about doing? Hiatus, Blip, whatever you want to call them, they're just data points, and it seems data points are quite easy to change.
Wigley and Jones
So, if we could reduce the ocean blip by, say, 0.15 degC,
then this would be significant for the global mean -- but
we'd still have to explain the land blip.
What is your concern with this?
While I don't know the exact context, this is the only reply I see to that.
Maybe this will clear things up; note that this article is discussing research prior to that email by more than a year.
This article refers to the sudden and rapid post-war drop in sea surface temperatures, with the explanation that - due to the WW2 conditions - sea surface temperatures seemed to rise. Immediately after WW2, these conditions changed - and sea surface temperatures seemed to fall abruptly. The email discusses some speculation on how much of a drop could happen, along with the inability to apply an adjustment to the land temperatures.
If you are going by the notion that someone adjusted temperatures in the 1940s as a whole downward, please note that older data might use different baselines for what 0 anomaly is. This is more apparent in longer-running plots, rather than snippets of these that utterly fail to take them into account.
a reply to: TiredofControlFreaks
Interesting, but I don't see that the conclusion you draw is particularly valid.
Last I checked, CO2 has been rising for awhile, and we've been the ones doing it.
Interesting, but I don't see that the conclusion you draw is particularly valid.
Last I checked, CO2 has been rising for awhile, and we've been the ones doing it.
a reply to: Greven
interesting but what problem are you actually concerned about. Rising CO2 or rising temperatures. Since CO2 is only 1 part of the rising temperature, isn't it in your best temperature to examine other sources that cause temperature change?
Or are you so wedded to the CO2 theory that you can't see past it to anything else?
Tired of Control Freaks
a reply to: TiredofControlFreaks
CO2 happens to outweigh anything else right now. It doesn't matter so much what it is, but how it works.
What do you have in mind?
CO2 happens to outweigh anything else right now. It doesn't matter so much what it is, but how it works.
What do you have in mind?
a reply to: D8Tee
Mauna Loa has been monitoring since 1958.
The steady trend is up, and data can be gotten from there. Unfortunately, we do not have much in the way of recorded CO2 levels prior to this. CO2 levels have been reconstructed with ice cores all over the place.
Mauna Loa has been monitoring since 1958.
The steady trend is up, and data can be gotten from there. Unfortunately, we do not have much in the way of recorded CO2 levels prior to this. CO2 levels have been reconstructed with ice cores all over the place.
edit on 17Sun, 08 Jan 2017 17:52:11 -0600America/ChicagovAmerica/Chicago1 by
Greven because: (no reason given)
a reply to: Greven
There has been data sets collected, the data has been disregarded in favor of indirect measurements.
180 YEARS OF ATMOSPHERIC CO2 GAS ANALYSIS
BY CHEMICAL METHODS
There has been data sets collected, the data has been disregarded in favor of indirect measurements.
180 YEARS OF ATMOSPHERIC CO2 GAS ANALYSIS
BY CHEMICAL METHODS
new topics
-
President BIDEN's FBI Raided Donald Trump's Florida Home for OBAMA-NORTH KOREA Documents.
Political Conspiracies: 4 hours ago -
Maestro Benedetto
Literature: 5 hours ago -
Is AI Better Than the Hollywood Elite?
Movies: 6 hours ago -
Las Vegas UFO Spotting Teen Traumatized by Demon Creature in Backyard
Aliens and UFOs: 9 hours ago -
2024 Pigeon Forge Rod Run - On the Strip (Video made for you)
Automotive Discussion: 10 hours ago -
Gaza Terrorists Attack US Humanitarian Pier During Construction
Middle East Issues: 10 hours ago -
The functionality of boldening and italics is clunky and no post char limit warning?
ATS Freshman's Forum: 11 hours ago
top topics
-
President BIDEN's FBI Raided Donald Trump's Florida Home for OBAMA-NORTH KOREA Documents.
Political Conspiracies: 4 hours ago, 26 flags -
Krystalnacht on today's most elite Universities?
Social Issues and Civil Unrest: 15 hours ago, 9 flags -
Supreme Court Oral Arguments 4.25.2024 - Are PRESIDENTS IMMUNE From Later Being Prosecuted.
Above Politics: 15 hours ago, 8 flags -
Weinstein's conviction overturned
Mainstream News: 14 hours ago, 8 flags -
Massachusetts Drag Queen Leads Young Kids in Free Palestine Chant
Social Issues and Civil Unrest: 12 hours ago, 7 flags -
Gaza Terrorists Attack US Humanitarian Pier During Construction
Middle East Issues: 10 hours ago, 7 flags -
Las Vegas UFO Spotting Teen Traumatized by Demon Creature in Backyard
Aliens and UFOs: 9 hours ago, 6 flags -
Meadows, Giuliani Among 11 Indicted in Arizona in Latest 2020 Election Subversion Case
Mainstream News: 12 hours ago, 5 flags -
2024 Pigeon Forge Rod Run - On the Strip (Video made for you)
Automotive Discussion: 10 hours ago, 4 flags -
Is AI Better Than the Hollywood Elite?
Movies: 6 hours ago, 3 flags
active topics
-
Gaza Terrorists Attack US Humanitarian Pier During Construction
Middle East Issues • 28 • : firerescue -
Supreme Court Oral Arguments 4.25.2024 - Are PRESIDENTS IMMUNE From Later Being Prosecuted.
Above Politics • 89 • : WeMustCare -
SHORT STORY WRITERS CONTEST -- April 2024 -- TIME -- TIME2024
Short Stories • 23 • : DontTreadOnMe -
President BIDEN's FBI Raided Donald Trump's Florida Home for OBAMA-NORTH KOREA Documents.
Political Conspiracies • 16 • : Astyanax -
Truth Social goes public, be careful not to lose your money
Mainstream News • 130 • : Astyanax -
Las Vegas UFO Spotting Teen Traumatized by Demon Creature in Backyard
Aliens and UFOs • 11 • : AwakeNotWoke -
Is AI Better Than the Hollywood Elite?
Movies • 13 • : Justoneman -
Hate makes for strange bedfellows
US Political Madness • 47 • : 19Bones79 -
-@TH3WH17ERABB17- -Q- ---TIME TO SHOW THE WORLD--- -Part- --44--
Dissecting Disinformation • 689 • : daskakik -
University of Texas Instantly Shuts Down Anti Israel Protests
Education and Media • 265 • : Astrocometus