It looks like you're using an Ad Blocker.
Please white-list or disable AboveTopSecret.com in your ad-blocking tool.
Thank you.
Some features of ATS will be disabled while you continue to use an ad-blocker.

There was no global warming hiatus.
page: 6share:
a reply to: D8Tee
The measurements were not ignored, they were simply not reliable. Almost all of them were made in Europe, and many of them near or in major population centers.
There's a reason Mauna Loa and other stations are where they are, and it has to do with contamination.
The measurements were not ignored, they were simply not reliable. Almost all of them were made in Europe, and many of them near or in major population centers.
There's a reason Mauna Loa and other stations are where they are, and it has to do with contamination.
a reply to: Greven
I'm sure there is reasons for the IPCC favouring indirect determination methods of C02 levels.
I'm sure they investigated and found that there was no way they could come up with a correction factor for these measurements. Obviously there was no hope of salvaging this data.
I'm sure there is reasons for the IPCC favouring indirect determination methods of C02 levels.
Could the samples have been contaminated, such as by war activity, industrial processes, or other local sources of CO2? It is certainly possible. For example, a series of 25,000 measurements taken at Giessen, Germany, between 1939 and 1941, averaged 438.5 ppm.
I'm sure they investigated and found that there was no way they could come up with a correction factor for these measurements. Obviously there was no hope of salvaging this data.
a reply to: D8Tee
What is this notion you have about indirect versus direct measurements?
Do you for some reason think CO2 was higher when we didn't emit as much of it?
If so, why do you think that would be the case?
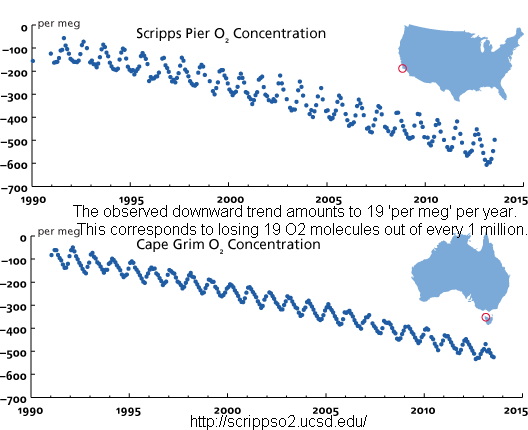
We can see the fingerprint of humans on the changing composition of the isotopic carbon in atmospheric CO2, along with the decline in O2 levels as oxygen is bound to carbon:
What is this notion you have about indirect versus direct measurements?
Do you for some reason think CO2 was higher when we didn't emit as much of it?
If so, why do you think that would be the case?
We can see the fingerprint of humans on the changing composition of the isotopic carbon in atmospheric CO2, along with the decline in O2 levels as oxygen is bound to carbon:
edit on 20Sun, 08 Jan 2017 20:54:13 -0600America/ChicagovAmerica/Chicago1 by Greven because: (no reason
given)
a reply to: D8Tee
The percent per year is small, but the net accumulation is large. Because the natural CO2 cycle was (prior to drill baby driil) in balance since the end of the Ice Age.
The accumulation from 280 ppm to over 400 and going to 600 is from mining and burning fossilized carbon which had been out of the ecological cycle for far far far longer than ten ice ages. Back then, the biology and the continents and the Sun were different.
originally posted by: TiredofControlFreaks
a reply to: Greven
interesting but what problem are you actually concerned about. Rising CO2 or rising temperatures. Since CO2 is only 1 part of the rising temperature, isn't it in your best temperature to examine other sources that cause temperature change?
Or are you so wedded to the CO2 theory that you can't see past it to anything else?
Tired of Control Freaks
There are numerous potential sources, and they are all are under major investigation by climatologists and have been for decades. What we know: the current change is NOT the Sun or volcanoes, and human activity is the dominant contribution. Though it is not simple to divvy up forcing as independent components (interactions of wavelengths in the atmosphere), a rough estimate is CO2 is a bit over 50% of the anthropogenic contribution. There are other significant anthropogenic contributions, but none are as big as CO2 in terms of size and longevity combined. Controlling these is also important.
There are also anthropogenic cooling influences (many of which are undesirable smog producing effects) which are being measured and quantified.
a reply to: D8Tee
The Keeling Curve and Global CO2
The difference is slight. It is interesting, if you look at that link, that you can see the latitude impact on distribution of CO2 isotopic composition.
The Keeling Curve and Global CO2
A Few Words about CO2 Carbon Isotopes
There are two stable isotopes of carbon, C13 and C12. C12 is the more abundant isotope; the natural ratio of C12 to C13 is about 99 to 1. The standard measure of carbon isotopes compares the C12/C13 isotope ratio of the sample in question to the C13/C12 ratio of a standard limestone, according to the expression:
d C13/C12 = ((C13/C12 sample / C13/C12 standard) – 1)*1000.
This expression, commonly termed “del 13”, amplifies small but meaningful differences in the isotopes, which are diagnostic of certain processes and occurrences of carbon. The standard is a uniform Cretaceous limestone with a d 13 value defined as zero. Positive values indicate a heavier composition, i.e., a greater concentration of C13 than the standard. Negative values indicate a lighter composition, i.e., a smaller concentration of C13 than the standard.
Plants fractionate carbon, favoring the lighter isotope C12. Anything derived from plants, including oil, gas, and coal (and algae, animals and people) carries a light (negative) d C13/C12 signature. Limestone carries a d C13/C12 ratio near zero. The atmosphere, in 1977, had a d C13/C12 ratio of about -7.5; it is currently about -8.3, reflecting the influence of fossil fuels. Oceans have a slightly positive d C13/C12 ratio of dissolved inorganic carbon, although Northern Hemisphere waters show a negative ratio due to the greater use of fossil fuels in the Northern Hemisphere. Fossil fuel CO2 emissions and CO2 emissions from deforestation carry a very light d C13/C12, in the range of -25 to -28. The distinctive isotopic signature of CO2 from fossil fuels and deforestation is useful in tracking the movement of carbon through the atmosphere and oceans. Boden, Marland and Andres (2013) published estimates of the annual CO2 released by fossil fuels and the d C13/C12 ratio of those emissions. Those estimates were used in this work.
The difference is slight. It is interesting, if you look at that link, that you can see the latitude impact on distribution of CO2 isotopic composition.
a reply to: mbkennel
I'm not the one with the bias. If you don't see the problem with going back and saying, hey, our measurements weren't right (when they happened to conflict with the narrative they were pushing) and then adjusting them in ways that make them fit that narrative perfectly, then there's no helping you, but I'm not about to sit here and let that bias negatively impact my standard of living and my rights.
Jaden
originally posted by: Greven
a reply to: D8Tee
The Keeling Curve and Global CO2 Carbon dioxide from fossil fuels and deforestation carries a distinctive isotopic signature, which marks the movement of man-made CO2 through the atmosphere and carbon reservoirs (soils, biomass, and oceans). This movement of carbon, as seen in both carbon isotope data and bulk CO2 data, reveals complexity in the carbon cycle. Discrepancies between the datasets imply the active exchange of carbon between the atmosphere and carbon reservoirs. More than 85% of anthropogenic CO2 emissions, as tagged by carbon isotopes, do not remain in the atmosphere, but are absorbed by carbon reservoirs. However, some of the anthropogenic carbon in the atmosphere is exchanged for natural carbon from carbon reservoirs, so that atmospheric CO2 concentration is maintained at a level equivalent to about 44% of cumulative annual CO2 emissions over the long term. The size of carbon reservoirs is estimated at more than 7 times the volume of carbon present in the atmosphere, based on a dilution calculation of anthropogenic carbon isotopes in the atmosphere.
Does this mean that if we weren't burning fossil fuels, the C02 levels would be going downwards?
a reply to: TheRedneck
Is there an active volcano on Kiribati (Christmas Island)?
scrippsco2.ucsd.edu...
Is there an active volcano on Kiribati (Christmas Island)?
scrippsco2.ucsd.edu...
edit on 1/9/2017 by Phage because: (no
reason given)
a reply to: D8Tee
arstechnica.com...
Global warming does not mean it won't get cold. It means that average temperatures increase. So even if it's cold, when it's hot it's hotter.
The claims of a few scientists that we were entering an "ice age" were based mostly on the solar dimming effect caused by high levels of particulates (pollution). There was, even then, far more concern about CO2 caused warming (among climatologists).
We have saved ourselves from the Ice Age that we were being warned about during the 1970's!
arstechnica.com...
Sure is cold here this winter....
Global warming does not mean it won't get cold. It means that average temperatures increase. So even if it's cold, when it's hot it's hotter.
edit on 1/9/2017 by Phage because: (no reason given)
a reply to: Phage
This is an interesting paper from the 1970's, it's origins appear to be the American Intelligence Community.
Potential Implications of
Trends in World Population, Food Production, and Climate," August 1974
lol, that word, 'consensus' again.....
Interesting to note that the one academic mentioned in the paper is Reid Bryson.
This is an interesting paper from the 1970's, it's origins appear to be the American Intelligence Community.
Potential Implications of
Trends in World Population, Food Production, and Climate," August 1974
There is, moreover, growing consensus among
leading climatologists that the world is undergoing
a cooling trend.
lol, that word, 'consensus' again.....
At the beginning of this century, temperatures
were rising and the mound of cold air that covers
the pole was contracting.* By about 1940 it had
reached a relatively small size and more of the
earth was dominated by warm air from tropical regions.
But since about 1940, the earth has in fact cooled
and the polar air mass has expanded.
The precarious outlook for the poor and food deficit
countries, and the enhanced role of North
American agriculture in world food trade outlined
above were predicated on the assumption that normal
weather will prevail over the next few decades. **
But many climatologists warn that this assumption
is questionable; some would say that it is almost
certainly wrong.
Perhaps the simplest worry is marked variation
within the prevailing weather patterns. The US middlewest
has had moderate to severe droughts every 20 to
25 years--e.g., 1930's, mid-1950's--as far back as
the weather records go.
Far more disturbing is the thesis that the
weather we call normal is, in fact, highly abnormal
ard unusually felicitous in terms of supporting
agricultural output. While still unable to explain
how or why climate changes, or to predict the extent
and duration of change, a number of climatologists
are in agreement that the northern hemisphere, at
least, is growing cooler.*
-Iceland, because of its location, is a good
indicator of changes in the whole Northern
Hemisphere. The weather records and evidence
for lceland indicate that the past 4 decades
were the most abnormal period in the last
1000 years--much much warmer.
--The arctic ice area has perceptibly increased
in the past few years.
--The English growing season has been
shortened by a week or more since the 1940's
The best estimates of climate over the past
1600 years indicate that major shifts have taken
place more than a dozen times. The maximum temperature
drop usually occurred within 40 years of inception
of a cooling trend; and the earliest return to
"normal" required 70 years.
Interesting to note that the one academic mentioned in the paper is Reid Bryson.
In 1973, Bryson testified to Congress that global warming from fossil-fuel combustion was politically unstoppable.
There is no way right now that we can control the climate to make it more benign. Even if we were to say "let us stop using fossil fuels so that we do not add carbon dioxide to the atmosphere, because that impacts the world climate," how on earth could you stop using fossil fuels? Even those countries that are most heavily impacted by the climatic change are the ones who say it is our turn to be affluent and it is in the use of fossil fuels that one gains affluence.[6]
In later years, when it was clear that the climate was indeed warming, Bryson argued that while climate change and a global increase in temperature are real, he did not believe that they are caused by human activity. Rather, he argued that they are part of natural global climate cycles, particularly the end of the Little Ice Age:
"All this argument is the temperature going up or not, it’s absurd," Bryson continues. "Of course it’s going up. It has gone up since the early 1800s, before the Industrial Revolution, because we’re coming out of the Little Ice Age, not because we’re putting more carbon dioxide into the air."[7]
a reply to: D8Tee
arstechnica.com...
Oh, you left out this quote from your source:
You don't think there was a short period of cooling? You didn't read the link I posted?
lol, that word, 'consensus' again.....
There's a chart and everything.
That dip is now understood as being the result of two factors: a post-World War II surge in the emissions of aerosols from dirty fossil fuel burning and the cool phase of a Pacific Ocean cycle related to the strength of the trade winds. (That same Pacific cycle suppressed global surface temperatures a bit over the past two decades.) But at the time, the causes of the dip were far from clear.
Interesting that you didn't seem to see this in the link I posted. On second thought, you don't seem to have read it.
Interesting to note that the one academic mentioned in the paper is Reid Bryson.
He was wrong. It isn't getting cooler.
The real booster of the cooling predictions was Reid Bryson, who later rejected anthropogenic warming even as global temperatures climbed. In 1975 and 1976 papers, Bryson concluded that aerosol cooling would dominate over CO2 warming—a fact he felt was demonstrated by recent temperatures. As one of his papers put it, “Since 1940, the effect of the rapid rise of atmospheric turbidity appears to have exceeded the effect of rising carbon dioxide, resulting in a rapid downward trend of temperature. There is no indication that these trends will be reversed, and there is some reason to believe that man-made pollution will have an increased effect in the future.”
arstechnica.com...
Oh, you left out this quote from your source:
documents.theblackvault.com... The trend didn't continue. Warming had resumed by the end of the 70s.
If the trend continues for several decades there would almost certainly be an absolute shortage of food.
edit on 1/9/2017 by Phage because: (no reason given)
May the first mini iceage denier to freeze to death 20 yrs from now, Win.
a reply to: Phage
I didn't present that paper as a challenge of the validity of the link you posted, I just thought it made for interesting reading. I also didn't leave out certain parts of the paper on purpose, I couldn't quote the entire paper. Oh, and I did read your link, why do you think I mentioned Bryson?
I didn't present that paper as a challenge of the validity of the link you posted, I just thought it made for interesting reading. I also didn't leave out certain parts of the paper on purpose, I couldn't quote the entire paper. Oh, and I did read your link, why do you think I mentioned Bryson?
edit on 9-1-2017 by D8Tee because: (no reason given)
a reply to: Phage
Volcano, yes, active, not so far as we know.
There is on Mauna Loa, though. That was my point. Location, location, location.
TheRedneck
Is there an active volcano on Kiribati (Christmas Island)?
Volcano, yes, active, not so far as we know.
There is on Mauna Loa, though. That was my point. Location, location, location.
TheRedneck
new topics
-
Russian intelligence officer: explosions at defense factories in the USA and Wales may be sabotage
Weaponry: 49 minutes ago -
African "Newcomers" Tell NYC They Don't Like the Free Food or Shelter They've Been Given
Social Issues and Civil Unrest: 1 hours ago -
Russia Flooding
Other Current Events: 3 hours ago -
MULTIPLE SKYMASTER MESSAGES GOING OUT
World War Three: 3 hours ago -
Two Serious Crimes Committed by President JOE BIDEN that are Easy to Impeach Him For.
US Political Madness: 4 hours ago -
911 emergency lines are DOWN across multiple states
Breaking Alternative News: 4 hours ago -
Former NYT Reporter Attacks Scientists For Misleading Him Over COVID Lab-Leak Theory
Education and Media: 6 hours ago -
Why did Phizer team with nanobot maker
Medical Issues & Conspiracies: 7 hours ago -
Pro Hamas protesters at Columbia claim hit with chemical spray
World War Three: 7 hours ago -
Elites disapearing
Political Conspiracies: 9 hours ago
top topics
-
British TV Presenter Refuses To Use Guest's Preferred Pronouns
Education and Media: 17 hours ago, 17 flags -
Go Woke, Go Broke--Forbes Confirms Disney Has Lost Money On Star Wars
Movies: 11 hours ago, 13 flags -
Pro Hamas protesters at Columbia claim hit with chemical spray
World War Three: 7 hours ago, 11 flags -
Elites disapearing
Political Conspiracies: 9 hours ago, 8 flags -
Freddie Mercury
Paranormal Studies: 11 hours ago, 7 flags -
Nirvana - Immigrant Song
Music: 16 hours ago, 5 flags -
A Personal Cigar UFO/UAP Video footage I have held onto and will release it here and now.
Aliens and UFOs: 9 hours ago, 5 flags -
African "Newcomers" Tell NYC They Don't Like the Free Food or Shelter They've Been Given
Social Issues and Civil Unrest: 1 hours ago, 5 flags -
Two Serious Crimes Committed by President JOE BIDEN that are Easy to Impeach Him For.
US Political Madness: 4 hours ago, 5 flags -
Former NYT Reporter Attacks Scientists For Misleading Him Over COVID Lab-Leak Theory
Education and Media: 6 hours ago, 4 flags
active topics
-
Israel ufo shoot down drones?
Aliens and UFOs • 26 • : GENERAL EYES -
Russian intelligence officer: explosions at defense factories in the USA and Wales may be sabotage
Weaponry • 9 • : Lazy88 -
Why did Phizer team with nanobot maker
Medical Issues & Conspiracies • 5 • : daskakik -
African "Newcomers" Tell NYC They Don't Like the Free Food or Shelter They've Been Given
Social Issues and Civil Unrest • 4 • : GENERAL EYES -
The Acronym Game .. Pt.3
General Chit Chat • 7722 • : bally001 -
Two Serious Crimes Committed by President JOE BIDEN that are Easy to Impeach Him For.
US Political Madness • 7 • : Disgusted123 -
Russia Flooding
Other Current Events • 1 • : ksihkahe -
Running Through Idiot Protestors Who Block The Road
Rant • 107 • : FlyersFan -
Russia Ukraine Update Thread - part 3
World War Three • 5694 • : F2d5thCavv2 -
-@TH3WH17ERABB17- -Q- ---TIME TO SHOW THE WORLD--- -Part- --44--
Dissecting Disinformation • 518 • : Guyfriday