It looks like you're using an Ad Blocker.
Please white-list or disable AboveTopSecret.com in your ad-blocking tool.
Thank you.
Some features of ATS will be disabled while you continue to use an ad-blocker.

Climate Change Denial, Anyone?
page: 22share:
originally posted by: syrinx high priest
originally posted by: Nathan-D
You said there was a contradiction. So, stop wasting my time and point out where you think the contradiction is in what I have said.
"have changed"
"not the main cause"
seems like quibbling on semantics eh ?
and of course it is the main cause. going back 250 years the data for the CO2 and the temps match. until there is a better match it has to be considered the reason.
I am starting to feel that I have somehow slipped into an alternate universe where the rules of common speech are subtly different to the ones I know and understand. Syrinx appears to be arguing that humans increasing atmospheric CO2 levels and the CO2 increase not being the main cause of global warming are somehow incompatible and contradictory. This is why I stopped commenting on ATS. The level of stupidity here is off the scale! Syrinx then goes on to say ‘Of course it is the main cause. Going back 250 years the data and the temperatures match’. Please burn into your memory the fundamental scientific principle that ‘correlation does not prove a cause’, which renders your attempt to prove CO2 is the main cause of temperature changes totally irrelevant and a complete red-herring. In fact if one looks at the CO2 and temperature data over the last 60 years, you will see that CO2 changes lag corresponding temperature changes. So, pray tell me, how can CO2 changes be causing the temperature changes, when the CO2 changes are lagging the temperature changes? It is equivalent to someone saying ‘Cancer causes smoking’.
originally posted by: Nathan-D
originally posted by: syrinx high priest
originally posted by: Nathan-D
You said there was a contradiction. So, stop wasting my time and point out where you think the contradiction is in what I have said.
"have changed"
"not the main cause"
seems like quibbling on semantics eh ?
and of course it is the main cause. going back 250 years the data for the CO2 and the temps match. until there is a better match it has to be considered the reason.
I am starting to feel that I have somehow slipped into an alternate universe where the rules of common speech are subtly different to the ones I know and understand. Syrinx appears to be arguing that humans increasing atmospheric CO2 levels and the CO2 increase not being the main cause of global warming are somehow incompatible and contradictory. This is why I stopped commenting on ATS. The level of stupidity here is off the scale! Syrinx then goes on to say ‘Of course it is the main cause. Going back 250 years the data and the temperatures match’. Please burn into your memory the fundamental scientific principle that ‘correlation does not prove a cause’, which renders your attempt to prove CO2 is the main cause of temperature changes totally irrelevant and a complete red-herring. In fact if one looks at the CO2 and temperature data over the last 60 years, you will see that CO2 changes lag corresponding temperature changes. So, pray tell me, how can CO2 changes be causing the temperature changes, when the CO2 changes are lagging the temperature changes? It is equivalent to someone saying ‘Cancer causes smoking’.
please refrain from childish insults
you didn't offer an alternative reason, I suspect because you don't have one
take 45 minutes to check out Dr. Muellers study. I found it very credible as a former skeptic examining the data to eliminate bias and poor quality stations testified before congress that climate change is real and man-made
Berkely Earth summary of findings
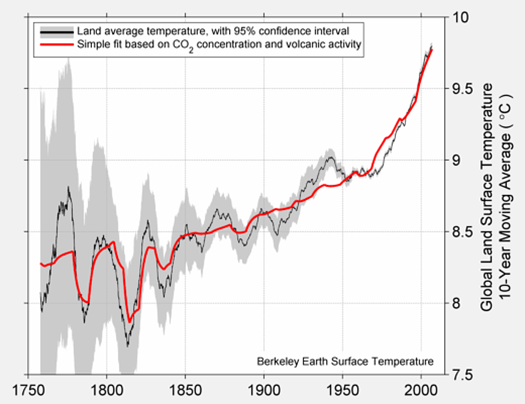
The annual and decadal land surface temperature from the BerkeleyEarth average, compared to a linear combination of volcanic sulfate emissions and the natural logarithm of CO2. It is observed that the large negative excursions in the early temperature records are likely to be explained by exceptional volcanic activity at this time. Similarly, the upward trend is likely to be an indication of anthropogenic changes. The grey area is the 95% confidence interval.
Berkely Earth press release
Richard Muller, Founder and Scientific Director of Berkeley Earth, notes “Much to my surprise, b y far the best match was to the record of atmospheric carbon dioxide, measured from atmospheric samples and air trapped in polar ice . ” He emphasizes that the match between the data and the theory do esn’t prove that carbon dioxide is responsible for the warming, but the good fit makes it the strongest contender. “ T o be considered seriously, an y alternative explanation must match the data at least as well as does carbon dioxide.” In its 2007 report the IPCC concluded only that “ most ” of the warming of the past 50 years could be attributed to humans. It was possible, according to the IPCC, that increased solar activity could have contributed to warming prior to 1956 . Berkeley Earth analyzed about 5 times more station records than were used in previous analyses, and this expanded data base along with its new statistical approach allowed Berkeley Earth to go about 100 years farther back in time than previous studies. By doing so, the Berkeley Earth team was able to conclude that over 25 0 years, the contribution of solar activity to global warming is negligible. Some of the scientists on the Berkeley Earth team admit surprise that t he new analysis has shown such clear agreement between global land -‐ temperature rise and hum an -‐ caused gree nhouse gases. “I was not expecting this,” says Richard Muller, “but as a scientist , I feel it is my duty to let the evidence change my mi nd .”
can you let the evidence change your mind ?
a reply to: Nathan-D
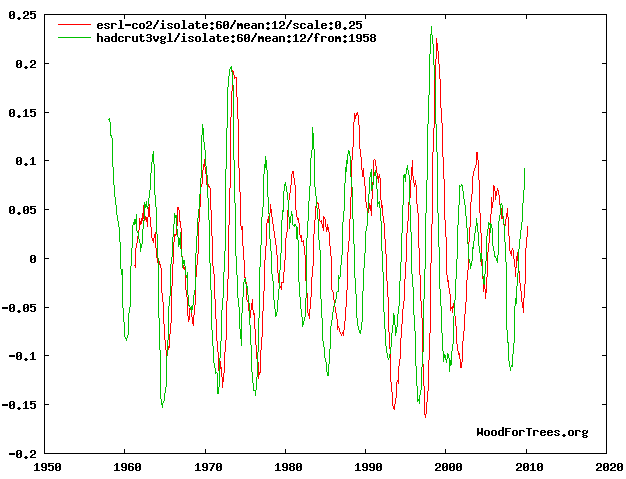
CO2 has been trending steadily upwards on a yearly average, so it's funny to see it declining in your graph. Oh, and using a series that ended several years ago.
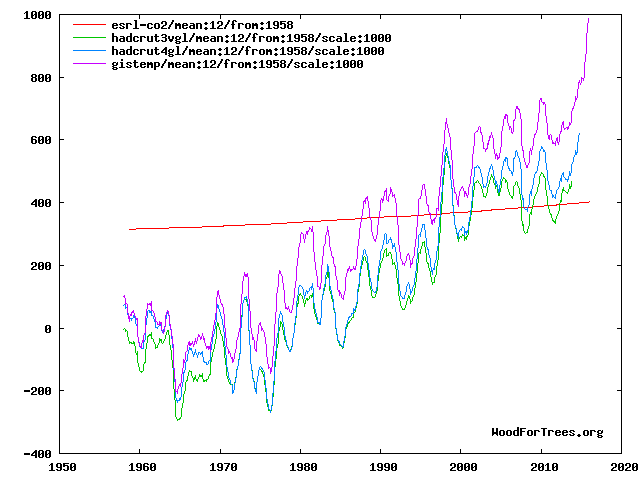
Let's instead not adjust the values (as you have) save for scaling to make everything visible (1000 = 1C):
CO2 has been trending steadily upwards on a yearly average, so it's funny to see it declining in your graph. Oh, and using a series that ended several years ago.
Let's instead not adjust the values (as you have) save for scaling to make everything visible (1000 = 1C):
edit on 9Sun, 17 Jul 2016 09:47:53 -0500America/ChicagovAmerica/Chicago7 by Greven because: (no reason given)
a reply to: jrod
its not all about YOU jrod
What this about all the artic ice will be gone by 2013?
How many media campaigns have there been about "tipping points" and we have only a few years left to stop burning fossil fuels or we will all die in blazing heat?
how the Atlantic current is slowing down and Europe will freeze?
How catastrophic events like hurricanes and tornadoes will happen more frequently and with greater intensity?
How the only way to solve the problem is to give a 100 billion to the undeveloped countries (who happen to be in the southern hemisphere and not heating up as much as the northern hemisphere)
Tired of Control Freaks
take 45 minutes to check out Dr. Muellers study. I found it very credible as a former skeptic examining the data to eliminate bias and poor quality stations testified before congress that climate change is real and man-made
Sorry, but I’ve wasted enough of my life on reading your cult’s half-baked and phoney propaganda already and I am definitely not sitting through a 45 minute video. If you have some new hard scientific evidence that actually demonstrates the truth of your claim that CO2 is the main cause for global warming (aside from a correlation), then I am willing to look at it but otherwise not.
you didn't offer an alternative reason, I suspect because you don't have one
Alternative reason for what? For global warming? But you never asked me to provide a possible reason for global warming, so why on Earth would you have expected me to have done so? In any case, you’re wrong. I can provide an alternative explanation if you wanted to see it. Even if I couldn’t provide an alternative explanation though, that wouldn’t mean that your explanation must be correct, does it?
a reply to: syrinx high priest
And in both your graphs your graps - cO 2 still lags
www.scientificamerican.com...
And now it only lags by 200 years!! Well that certainly solved the mystery of carbon increases lagging temperature increases!
So how come you are trying to convince us that it is only a myth that carbon increases lag behind temperature?
Tired of Control Freaks
originally posted by: Greven
a reply to: Nathan-D
CO2 has been trending steadily upwards on a yearly average, so it's funny to see it declining in your graph. Oh, and using a series that ended several years ago.
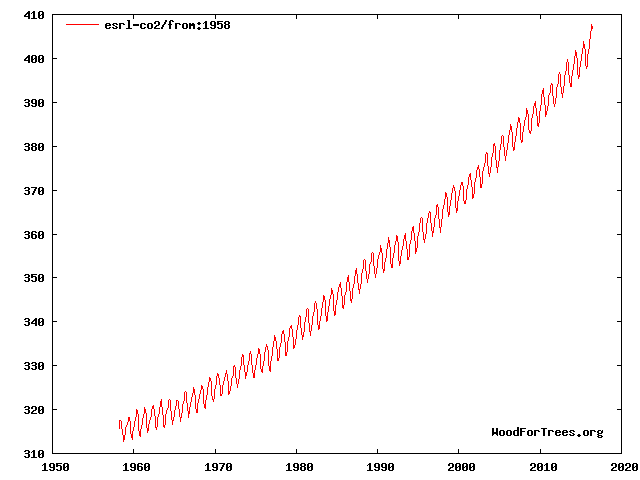
What adjusted values are you referring to? The CO2 increase is not just a straight line as it appears in your graph. Your graph shows the smoothed CO2 increase whereas my graph shows the unsmoothed CO2 increase.
a reply to: Nathan-D
classic disinfo deflection technique
its not a video it's a comprehensive study done by a self described AGW skeptic that was hired to testify in front of congress by the koch brothers to prove AGW was a hoax or at least poor science.
After studying the data he concluded that the opposite is true.
Dr. meuller showed his integrity, you showed your lack of it.
Now you go in the tiredofcontrolfreaks disinfo category, don't bother replying to this I am done with you
a reply to: syrinx high priest
love it!
There has been an unpredicted and unexplained pause in global warming! No there hasn't! now lets provide 66 different reasons for the "pause". Now we are back to there is no pause.
There is a lag between temperature and CO2. No there isn't! Well anyway we got the lag down to 200 years. Now we are back to there is no lag.
Tired of Control Freaks
originally posted by: Nathan-D
originally posted by: Greven
a reply to: Nathan-D
CO2 has been trending steadily upwards on a yearly average, so it's funny to see it declining in your graph. Oh, and using a series that ended several years ago.
What adjusted values are you referring to? The CO2 increase is not just a straight line as it appears in your graph. Your graph shows the smoothed CO2 increase whereas my graph shows the unsmoothed CO2 increase.
Are you serious?
vs
originally posted by: Nathan-D
edit on 10Sun, 17 Jul 2016 10:45:20 -0500America/ChicagovAmerica/Chicago7 by Greven because: (no reason given)
a reply to: TiredofControlFreaks
Seasonal fluctuation in the biosphere. You know, leaves spring from the trees, then later fall to the ground and decay.
Seasonal fluctuation in the biosphere. You know, leaves spring from the trees, then later fall to the ground and decay.
originally posted by: TiredofControlFreaks
ok just a question - doens't matter anyway. It has been well established anyway - CO2 lags temperatures. Your graph is really irrelelent to the issue being discussed.
You don't see any difference between the steady increase in average annual CO2 and the graph Nathan-D presented?
How exactly has it been well established that CO2 lags temperatures?
a reply to: Greven
I guess you missed this
www.scientificamerican.com...
The "mystery" was only partially solved in 2013. The AGW has been ongoing since 1985. Despite the fact that they knew, beyond a shadow of a doubt, knew that CO2 lags temperature.
Tired of Control Freaks
I guess you missed this
www.scientificamerican.com...
The "mystery" was only partially solved in 2013. The AGW has been ongoing since 1985. Despite the fact that they knew, beyond a shadow of a doubt, knew that CO2 lags temperature.
Tired of Control Freaks
a reply to: TiredofControlFreaks
This isn't saying what you think it's saying. It's also affirming my previous explanation that skeptics used to complain that ice cores are bad at measuring CO2 dates, due to gas movement and CO2 remaining a gas.
When you say CO2 lags temperature, do you know what the margin of error is?
This isn't saying what you think it's saying. It's also affirming my previous explanation that skeptics used to complain that ice cores are bad at measuring CO2 dates, due to gas movement and CO2 remaining a gas.
When you say CO2 lags temperature, do you know what the margin of error is?
a reply to: TiredofControlFreaks
No, apparently you can't.
I'm asking you, since you are the one claiming CO2 lags temperature.
No, apparently you can't.
I'm asking you, since you are the one claiming CO2 lags temperature.
a reply to: Greven
Well then I guess I don't belong in a discussion where the information is beyond my ability to read.
I guess that the artical I posted for a study done in 2013 solves no mystery whatsoever. It was just the usual waste of tax dollars. We should have understood that because ALL was understood back in 1978 when Hanson testified in Congess and when ice cores first began to be analysed (according to the artical - no one understood about movement of gas bubbles back then but, but the analysis is not to questioned and the conclusions done from it is not to be questioned?
There was a pause - no there wasn't - here are 66 different explanations for the pause that doesn't exist
CO2 lags temperature - no it doesn't - here is an explanation for the lag - The CO2 lag doesn't exist.
WOW - would you people get your theory straight
Tired of Control Freaks
a reply to: TiredofControlFreaks
So you don't know is the answer, apparently.
You quote an article with a random sentence that you suppose supports your argument, when the entirety of the article does not.
Further, you conflate ice core data with literally measured data.
And you want me to get my theory straight?
So you don't know is the answer, apparently.
You quote an article with a random sentence that you suppose supports your argument, when the entirety of the article does not.
Further, you conflate ice core data with literally measured data.
And you want me to get my theory straight?
new topics
-
Where should Trump hold his next rally
2024 Elections: 2 hours ago -
Shocking Number of Voters are Open to Committing Election Fraud
US Political Madness: 3 hours ago -
Gov Kristi Noem Shot and Killed "Less Than Worthless Dog" and a 'Smelly Goat
2024 Elections: 3 hours ago -
Falkville Robot-Man
Aliens and UFOs: 4 hours ago -
James O’Keefe: I have evidence that exposes the CIA, and it’s on camera.
Whistle Blowers and Leaked Documents: 4 hours ago -
Australian PM says the quiet part out loud - "free speech is a threat to democratic dicourse"...?!
New World Order: 5 hours ago -
Ireland VS Globalists
Social Issues and Civil Unrest: 6 hours ago -
Biden "Happy To Debate Trump"
2024 Elections: 6 hours ago -
RAAF airbase in Roswell, New Mexico is on fire
Aliens and UFOs: 6 hours ago -
What is the white pill?
Philosophy and Metaphysics: 8 hours ago
top topics
-
A Warning to America: 25 Ways the US is Being Destroyed
New World Order: 16 hours ago, 21 flags -
Blast from the past: ATS Review Podcast, 2006: With All Three Amigos
Member PODcasts: 8 hours ago, 13 flags -
James O’Keefe: I have evidence that exposes the CIA, and it’s on camera.
Whistle Blowers and Leaked Documents: 4 hours ago, 12 flags -
Australian PM says the quiet part out loud - "free speech is a threat to democratic dicourse"...?!
New World Order: 5 hours ago, 11 flags -
Biden "Happy To Debate Trump"
2024 Elections: 6 hours ago, 10 flags -
Mike Pinder The Moody Blues R.I.P.
Music: 8 hours ago, 8 flags -
Ireland VS Globalists
Social Issues and Civil Unrest: 6 hours ago, 5 flags -
RAAF airbase in Roswell, New Mexico is on fire
Aliens and UFOs: 6 hours ago, 5 flags -
What is the white pill?
Philosophy and Metaphysics: 8 hours ago, 5 flags -
Putin, Russia and the Great Architects of the Universe
ATS Skunk Works: 12 hours ago, 4 flags
active topics
-
Salvador Dali's Moustaches
People • 29 • : GENERAL EYES -
Mood Music Part VI
Music • 3111 • : TheWoker -
Where should Trump hold his next rally
2024 Elections • 12 • : StudioNada -
University of Texas Instantly Shuts Down Anti Israel Protests
Education and Media • 310 • : SchrodingersRat -
Candidate TRUMP Now Has Crazy Judge JUAN MERCHAN After Him - The Stormy Daniels Hush-Money Case.
Political Conspiracies • 815 • : Annee -
President BIDEN's FBI Raided Donald Trump's Florida Home for OBAMA-NORTH KOREA Documents.
Political Conspiracies • 35 • : Threadbarer -
Remember These Attacks When President Trump 2.0 Retribution-Justice Commences.
2024 Elections • 58 • : WeMustCare -
2024 Pigeon Forge Rod Run - On the Strip (Video made for you)
Automotive Discussion • 8 • : WhitewaterSquirrel -
Gov Kristi Noem Shot and Killed "Less Than Worthless Dog" and a 'Smelly Goat
2024 Elections • 28 • : cherokeetroy -
Shocking Number of Voters are Open to Committing Election Fraud
US Political Madness • 5 • : AwakeNotWoke