It looks like you're using an Ad Blocker.
Please white-list or disable AboveTopSecret.com in your ad-blocking tool.
Thank you.
Some features of ATS will be disabled while you continue to use an ad-blocker.

Charts the Government Doesn't Want You to See
page: 127
share:
Hello Fellow ATSers
I recently came upon a great video featuring Peter Schiff and Mike Maloney where they discuss the current and future economic situation.
Mike Maloney shows several charts that depict the real state of our economy. The video is 40 minutes long but worth every minute!
For those of you who don't know Peter Schiff was made famous for his forecasting of the 2008 Financial Crisis and being Ron Paul's economic adviser for his presidential runs.
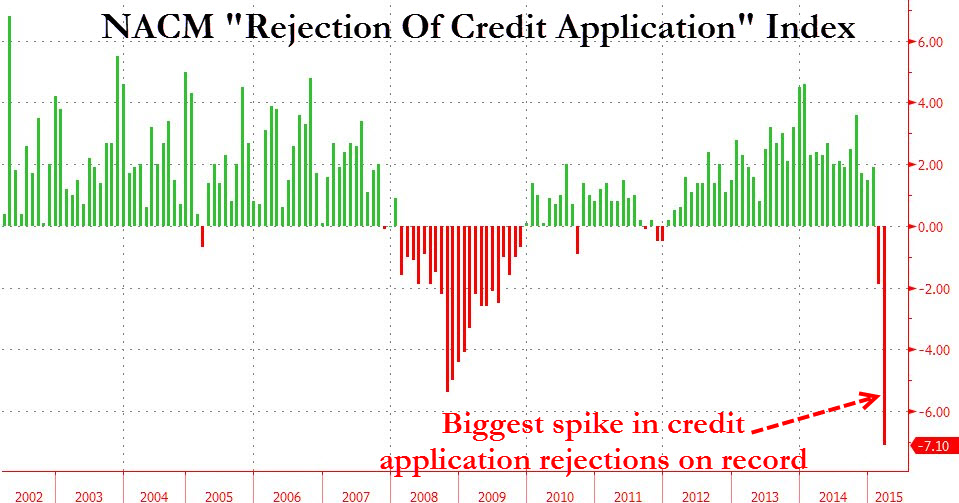
The two charts I thought were the most interesting were the Rejection of Credit Applications (6:42) and the Money Creation & Stock Price chart (13:35).
Source
In March we had the largest rejection of credit EVER! That is just remarkable and very telling of the underlying problems of the job market and the economy. Basically people have too much debt and not enough income. This could be due to the drop in full time work and the emerging part time labor force as Peter Schiff explains in the video.
The second chart I couldn't find online but basically is shows the relation between the stock market price and the creation of money. The two lines are almost on top of each other, indicating that the only reason the stock markets have risen is because of money creation by the Federal Reserve.
Enjoy!
I recently came upon a great video featuring Peter Schiff and Mike Maloney where they discuss the current and future economic situation.
Mike Maloney shows several charts that depict the real state of our economy. The video is 40 minutes long but worth every minute!
For those of you who don't know Peter Schiff was made famous for his forecasting of the 2008 Financial Crisis and being Ron Paul's economic adviser for his presidential runs.
The two charts I thought were the most interesting were the Rejection of Credit Applications (6:42) and the Money Creation & Stock Price chart (13:35).
Source
In March we had the largest rejection of credit EVER! That is just remarkable and very telling of the underlying problems of the job market and the economy. Basically people have too much debt and not enough income. This could be due to the drop in full time work and the emerging part time labor force as Peter Schiff explains in the video.
The second chart I couldn't find online but basically is shows the relation between the stock market price and the creation of money. The two lines are almost on top of each other, indicating that the only reason the stock markets have risen is because of money creation by the Federal Reserve.
Enjoy!
originally posted by: asmall89
Hello Fellow ATSers
I recently came upon a great video featuring Peter Schiff and Mike Maloney where they discuss the current and future economic situation.
Mike Maloney shows several charts that depict the real state of our economy. The video is 40 minutes long but worth every minute!
For those of you who don't know Peter Schiff was made famous for his forecasting of the 2008 Financial Crisis and being Ron Paul's economic adviser for his presidential runs.
The two charts I thought were the most interesting were the Rejection of Credit Applications (6:42) and the Money Creation & Stock Price chart (13:35).
Source
In March we had the largest rejection of credit EVER! That is just remarkable and very telling of the underlying problems of the job market and the economy. Basically people have too much debt and not enough income. This could be due to the drop in full time work and the emerging part time labor force as Peter Schiff explains in the video.
The second chart I couldn't find online but basically is shows the relation between the stock market price and the creation of money. The two lines are almost on top of each other, indicating that the only reason the stock markets have risen is because of money creation by the Federal Reserve.
Enjoy!
There's been a MASSIVE uptick in invitations to apply (ITA) credit card marketing, as financial institutions finally seek to grow their lending portfolios. However, lending and approval criteria are still higher than they were in the freewheeling years running up to the crash. Hence, massive uptick in denials.
This was known to be coming by the 3 major credit days bureaus, as they analyze purchased list demographics to determine the hit they're going to take and the human & server resources needed, in providing free copies of credit reports for those denied, and subsequently processing the uptick in disputes.
Schiff was right once, and he's ridden the coattails of that one-time prediction, spewing uninformed nonsense, either due to his lack of understanding, or purposely to stay in the limelight with his doom prognosticating which always seems to fail.
I'm just glad I started selling my gold near the highs, based on Schiff claiming we were headed to $5,000/oz gold by 2014. I've done well over the past 8 years as a Schiff contrarian.
originally posted by: asmall89
The second chart I couldn't find online but basically is shows the relation between the stock market price and the creation of money. The two lines are almost on top of each other, indicating that the only reason the stock markets have risen is because of money creation by the Federal Reserve.
This shouldn't come as a surprise to anyone who has been paying attention.
Remember the sequence of events of 2008. Congress was informed of the upcoming crash in 2007, but were required to keep it secret. When the public was informed, Bernake wanted a blank check to deal with the crisis, with no questions asked as to what he was going to do with the money. Bush balked at the idea, but supported a bailout when he got his marching orders. A bailout bill was proposed in the House, but was rejected. Another bill was proposed and passed in the Senate, and sent to the House, where it was rejected. Not to be deterred, the house voted on the bailout again and it finally passed. It cleared the Senate and the President signed it. That bailout was supposed to be for $800 billion and was supposed to be repaid.
But that wasn't enough for the Fed. Enter Quantitative Easing. The Fed starting printing money and dumping it into Wall Street to cover their losses, essentially at taxpayer expense. Wall Street "recovered", but the people that lost their homes were still stuck. In the end, things worked out just the way Bernake had originally asked. The Fed had a blank check to use any way they wanted. No governmental approval needed because the Fed is not officially part of the government.
That should give the American people an idea of who really runs this country.
Here is another good chart:

Rigged system, our printed currency has no real value and keeps becoming more worthless.
Rigged system, our printed currency has no real value and keeps becoming more worthless.
originally posted by: dogstar23
originally posted by: asmall89
Hello Fellow ATSers
I recently came upon a great video featuring Peter Schiff and Mike Maloney where they discuss the current and future economic situation.
Mike Maloney shows several charts that depict the real state of our economy. The video is 40 minutes long but worth every minute!
For those of you who don't know Peter Schiff was made famous for his forecasting of the 2008 Financial Crisis and being Ron Paul's economic adviser for his presidential runs.
The two charts I thought were the most interesting were the Rejection of Credit Applications (6:42) and the Money Creation & Stock Price chart (13:35).
Source
In March we had the largest rejection of credit EVER! That is just remarkable and very telling of the underlying problems of the job market and the economy. Basically people have too much debt and not enough income. This could be due to the drop in full time work and the emerging part time labor force as Peter Schiff explains in the video.
The second chart I couldn't find online but basically is shows the relation between the stock market price and the creation of money. The two lines are almost on top of each other, indicating that the only reason the stock markets have risen is because of money creation by the Federal Reserve.
Enjoy!
There's been a MASSIVE uptick in invitations to apply (ITA) credit card marketing, as financial institutions finally seek to grow their lending portfolios. However, lending and approval criteria are still higher than they were in the freewheeling years running up to the crash. Hence, massive uptick in denials.
This was known to be coming by the 3 major credit days bureaus, as they analyze purchased list demographics to determine the hit they're going to take and the human & server resources needed, in providing free copies of credit reports for those denied, and subsequently processing the uptick in disputes.
Schiff was right once, and he's ridden the coattails of that one-time prediction, spewing uninformed nonsense, either due to his lack of understanding, or purposely to stay in the limelight with his doom prognosticating which always seems to fail.
I'm just glad I started selling my gold near the highs, based on Schiff claiming we were headed to $5,000/oz gold by 2014. I've done well over the past 8 years as a Schiff contrarian.
It amazes me sometimes on this site. Clear thinking, honest opinion and simple honest facts are completely ignored by everyone. I More often than not see this on unstarred or barely acknowledged post like yours .
I thank you for bringing sanity and reasoning into any discussion that involves zerohedge .
originally posted by: dogstar23
There's been a MASSIVE uptick in invitations to apply (ITA) credit card marketing, as financial institutions finally seek to grow their lending portfolios. However, lending and approval criteria are still higher than they were in the freewheeling years running up to the crash. Hence, massive uptick in denials.
This was known to be coming by the 3 major credit days bureaus, as they analyze purchased list demographics to determine the hit they're going to take and the human & server resources needed, in providing free copies of credit reports for those denied, and subsequently processing the uptick in disputes.
Even though they knew this was coming doesn't negate the fact that this has been the highest rate of rejection EVER. Even during the crisis of 08 when banks were going under and people couldn't get loans. The loan requirements aren't even that much tighter! I make less than 24K a year and have about 4 lines of credit, I received all of these loans post 2008 crisis, so I don't believe that for one second that the restrictions are tighter. Don't you think that this is more of an issue of people not having full time employment and low wages?
Schiff was right once, and he's ridden the coattails of that one-time prediction, spewing uninformed nonsense, either due to his lack of understanding, or purposely to stay in the limelight with his doom prognosticating which always seems to fail.
I'm just glad I started selling my gold near the highs, based on Schiff claiming we were headed to $5,000/oz gold by 2014. I've done well over the past 8 years as a Schiff contrarian.
Even though Schiff may just be a glorified Gold & Silver salesman I'd trust his input more than CNBC shills like Jim Kramer. Schiff has been consistent with his message and all those indicators that they went over in the video show that the economy is not well. If I were you I'd sell your stocks while they're overpriced and buy into commodities while they're cheap. No country has ever inflated their money supply like this and gotten away without runaway inflation. Pre-Revolutionary France, Pre-Revolutionary Russia, Weimar Republic, Zimbabwe etc.
a reply to: Greathouse
My post is not about the article on Zero Hedge but about the video and they charts they chose to discuss. Zero Hedge just happens to be where I found the chart they showed in the video which by the way was compiled and created not by Zero Hedge but by NACM.
You can interpret the data how you want too. Most people would say what the poster above did, which was it is due to more credit apps being sent out and tighter lending standards. I don't believe this is the case as Peter Schiff and Mike Maloney don't. I believe this is due to the stagnant wages and the populace having too much credit to begin with.
Since 2008 we have been steadily replacing full time jobs with part time and wages have not increased while everything else has. This is not good, why is this so hard for people to understand?
edit on 6-6-2015 by asmall89 because: (no reason given)
a reply to: Bilk22
There's so much manipulation with the price of gold and silver through paper stock. It doesn't reflect the real supply and value of these commodities. Silver in particular is harder to mine than gold and thus should be valued more than it is. The manipulation is meant to keep these commodity prices lower than they actually should be while manipulation in the stock & real estate market is to inflate them as much as possible.
There's so much manipulation with the price of gold and silver through paper stock. It doesn't reflect the real supply and value of these commodities. Silver in particular is harder to mine than gold and thus should be valued more than it is. The manipulation is meant to keep these commodity prices lower than they actually should be while manipulation in the stock & real estate market is to inflate them as much as possible.
When commodity prices collapse and USD rises, its a good sign that investments in futures is stampeding into cash to safeguard against a pending stock
market collapse. Perhaps in Sept, 2015 if those that believe in Shemitah cycle are correct.
new topics
-
Putin, Russia and the Great Architects of the Universe
ATS Skunk Works: 2 hours ago -
A Warning to America: 25 Ways the US is Being Destroyed
New World Order: 7 hours ago
top topics
-
President BIDEN's FBI Raided Donald Trump's Florida Home for OBAMA-NORTH KOREA Documents.
Political Conspiracies: 13 hours ago, 31 flags -
A Warning to America: 25 Ways the US is Being Destroyed
New World Order: 7 hours ago, 13 flags -
Is AI Better Than the Hollywood Elite?
Movies: 14 hours ago, 4 flags -
Maestro Benedetto
Literature: 14 hours ago, 1 flags -
Putin, Russia and the Great Architects of the Universe
ATS Skunk Works: 2 hours ago, 1 flags
active topics
-
Chris Christie Wishes Death Upon Trump and Ramaswamy
Politicians & People • 26 • : FlyersFan -
Sol Et Luna - TIME2024
Short Stories • 11 • : Encia22 -
Gaza Terrorists Attack US Humanitarian Pier During Construction
Middle East Issues • 47 • : FlyersFan -
Any one suspicious of fever promotions events, major investor Goldman Sachs card only.
The Gray Area • 11 • : mysterioustranger -
Ode to Artemis
General Chit Chat • 1 • : Encia22 -
A Warning to America: 25 Ways the US is Being Destroyed
New World Order • 15 • : jidnum2 -
Skinwalker Ranch and the Mystery 1.6GHz Signal
Aliens and UFOs • 145 • : Ophiuchus1 -
University of Texas Instantly Shuts Down Anti Israel Protests
Education and Media • 273 • : HerbertWest -
Krystalnacht on today's most elite Universities?
Social Issues and Civil Unrest • 6 • : FlyersFan -
Hate makes for strange bedfellows
US Political Madness • 50 • : 19Bones79
27