It looks like you're using an Ad Blocker.
Please white-list or disable AboveTopSecret.com in your ad-blocking tool.
Thank you.
Some features of ATS will be disabled while you continue to use an ad-blocker.

NOAA/NASA Caught With Their Pants Down On Global Warming Numbers...
page: 25share:
The excessive quoting needs to stop. It does not prove anything.
Thank you.
Refer to the TOCs or PM a MOD if you have questions about what is excessive quoting.
Thank you.
Refer to the TOCs or PM a MOD if you have questions about what is excessive quoting.
edit on 6-7-2014 by jrod because: why not
a reply to: ElectricUniverse
Do you agree that we have seen a 40% increase in CO2 since the industrial revolution and human population explosion?
We as a species are destroying this planet.
For the record: never have I claimed to have a PHD, I cited Dr. Windsor a PHD who taught an atmospheric chemistry class at Florida Institute of Technology in 2003
Please kindly do not misrepresent what I write, it takes away from your credibility.
edit on 6-7-2014 by jrod because: playing checkers with
the chess pieces
originally posted by: jrod
a reply to: ElectricUniverse
Do you agree that we have seen a 40% increase in CO2 since the industrial revolution and human population explosion?
We as a species are destroying this planet.
For the record: never have i claimed to have a PHD, a cited Dr. Windsor a PHD who taught a atmospheric chemistry class in Florida Institute of Technology in 2003
Please kindly do not misrepresent what I write, it takes away from your credibility.
You didn't cite Dr. Windsor's work anywhere, just name dropped him. Did any of your PhD professors ever write a paper that you can cite?
Anyone can take a class instructed by a PhD, that doesn't give you instant credibility just because you took a class at a college sometime a decade ago from a professor that I have to ask some other professor if he worked there and taught you.
Your credibility is at the mercy of your posts and you are getting ridiculous.
~Namaste
a reply to: SonOfTheLawOfOne
Here we go again.
He is an expert that can back up most if not all my 'claims'.
So can Dr. Lazarus at FIT.
I am not the average armchair expert.....
Here we go again.
He is an expert that can back up most if not all my 'claims'.
So can Dr. Lazarus at FIT.
I am not the average armchair expert.....
originally posted by: charlyv
These are real numbers. Within the last few hundred years, the very rightmost x value on this timescale , CO2 increase in the atmosphere has gone asymptotic. Can anyone really believe that there will be no ramifications to our climate from what you see here? If not, please explain why it is not important.
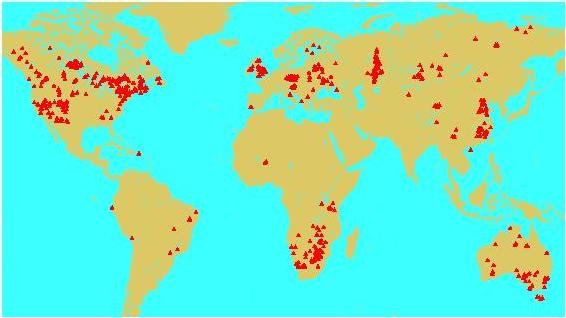
The Earth started to warm at the beginning of the 1600s, over 200 years before the advent of the industrial revolution.
Global borehole temperature data has shown this.
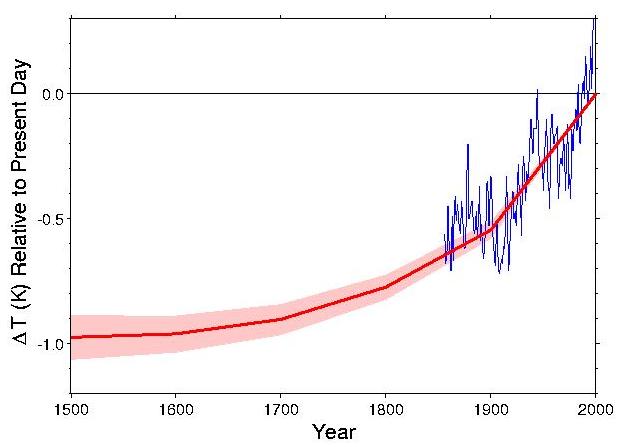
The map above shows the location of borehole sites in the database that we have analyzed to date. The diagram below is a global perspective of surface temperature change over the last five centuries, averaged from 837 individual reconstructions. The thick red line represents the mean surface temperature since 1500 relative to the present-day. The shading represents ± one standard error of the mean. Shown in blue for comparision is the global mean surface air temperature (five year running average) derived from instrumental records by P.D. Jones and colleagues at the University of East Anglia .
www.ncdc.noaa.gov...
Throughout the history of Earth's geology the data shows that temperatures increases lead before CO2 levels increase by an average 800 years. While mankind has released anthropogenic CO2, hence it's term as anthropogenic. There is no real evidence that shows this increased level of CO2 will cause the dramatic warming claimed by the AGW camp. in fact most of the warming attributed to CO2 is caused by water vapor, and not CO2. But since water vapor is 99.999% natural, world leaders can't use the increase in water vapor to control people.
Let's see the surface temperature from borehole stations side by side to the increase in CO2 levels.
Do notice that the CO2 level graph starts in the year 1000, meanwhile the borehole temperature graph starts at the year 1,500, so you have to take that into account.
As to the question posed by charlyv
First of all, just because CO2 is a ghg it doesn't mean it must cause such dramatic changes in temperatures as it is claimed by the AGW camp.
Second, not only does Earth's geological record shows that temperatures lead the changes in CO2 levels, implying that not the entirety of the 40% increase in CO2 over the past almost 200 years was caused by anthropogenic means; but the lag of CO2 behind temperature changes is not always the same. Sometimes temperatures have increased for a couple hundreds years before the increase in CO2 levels, while on other occasions the lag of CO2 behind temperature changes has happened over a thousand years later. The average lag of CO2 changes behind temperature changes is 800 years. This means that there must be other factors that causes the differences in the lag of CO2 behind temperature changes. Some of those factors would include volcanism, including underwater, large seismic events that would release large amounts of ghgs including methane, and CO2, among others.
Not to mention that I have mentioned many times in the past that climate changes are not the only changes happening on Earth. I have mentioned the increase in volcanism, and underwater volcanoes which have been warming ocean masses, and other natural disaster which have been increasing, and of course anthropogenic CO2 is not the cause of these other natural disasters either.
Since 2004, under another name, I have been posting about these changes the Earth is undergoing. Below is an excerpt and threat from 2009 I posted.
Here is one thread I started in 2009 about some of these changes happening on Earth.
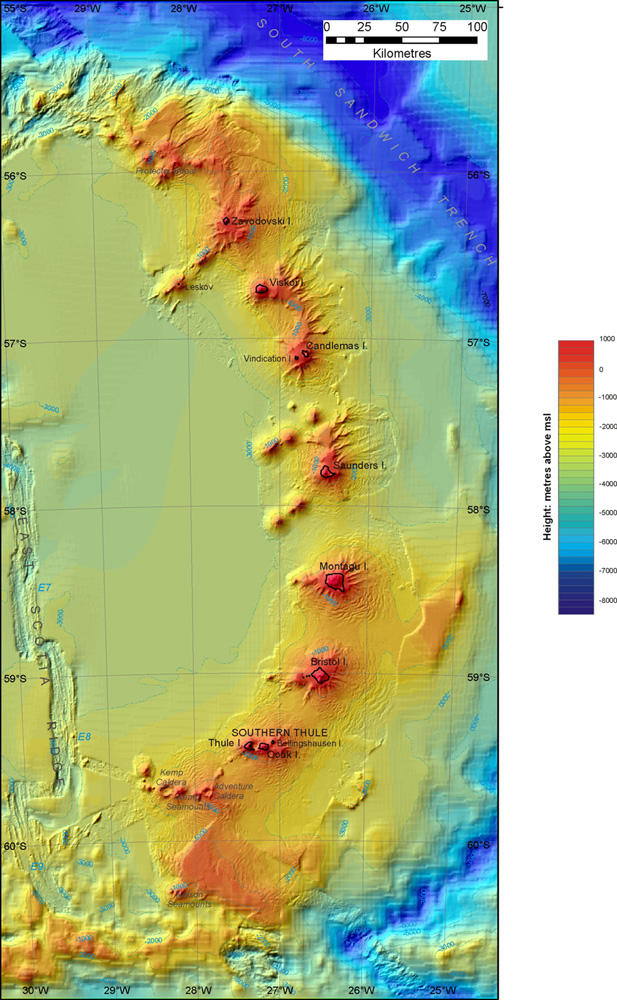
Underwater volcanoes heating Antarctic waters
Newly discovered volcanoes almost two miles tall
11 Jul 2011 - Scientists from the British Antarctic Survey (BAS) have discovered previously unknown volcanoes in the ocean waters around the remote South Sandwich Islands.
Sea-floor mapping technology reveals volcanoes beneath the sea surface
Using ship-borne sea-floor mapping technology during research cruises onboard the RRS James Clark Ross, the scientists found 12 volcanoes beneath the sea surface — some up to 3km (1.86 miles) high. They found 5km (3 mile) diameter craters left by collapsing volcanoes and 7 active volcanoes visible above the sea as a chain of islands.
According to a press release from the Proceedings of the National Academy of Sciences of the United States (PNAS), "this sub-sea landscape, with its waters warmed by volcanic activity creates a rich habitat for many species of wildlife and adds valuable new insight about life on earth." (Italics added)
The research is also important for understanding what happens when volcanoes erupt or collapse underwater and their potential for creating serious hazards such as tsunamis
Speaking at the International Symposium on Antarctic Earth Sciences in Edinburgh Dr Phil Leat from British Antarctic Survey said,
“There is so much that we don’t understand about volcanic activity beneath the sea — it’s likely that volcanoes are erupting or collapsing all the time. The technologies that scientists can now use from ships not only give us an opportunity to piece together the story of the evolution of our earth, but they also help shed new light on the development of natural events that pose hazards for people living in more populated regions on the planet.”
...
www.antarctica.ac.uk...
There are an estimated 3,477,403 underwater volcanoes on Earth. the following map shows some of these underwater volcanoes aka seamounts.
In 2012 ATS member Snarky 412 posted the following video showing this warming from underwater volcanoes around and below the Antarctic.
Here is her thread.
www.abovetopsecret.com...
Here is the video she showed us on that thread.
edit on 6-7-2014 by ElectricUniverse because: add info
Other changes happening on Earth and which other members and myself included have mentioned and posted about many times in the past includes the
weakening in Earth's magnetic field which started around 1840.
news.nationalgeographic.com...
Here is a video explaining what is happening and has been happening since 1840.
So you see, climate changes is not the only thing that has been happening, and is still happening on Earth.
adsabs.harvard.edu...
www.ipgp.fr...
And then we have the anomalies in the Solar System which took another turn with the recently found secular variation of the AU, or distance between the Sun and the planets, which has increased and cannot be explained.
Magnetic Field Weakening in Stages, Old Ships' Logs Suggest
John Roach
for National Geographic News
May 11, 2006
Earth's magnetic field is weakening in staggered steps, a new analysis of centuries-old ships logs suggests.
The finding could help scientists better understand the way Earth's magnetic poles reverse.
The planet's magnetic field flips—north becomes south and vice versa—on average every 300,000 years. However, the actual time between reversals varies widely.
The field last flipped about 800,000 years ago, according to the geologic record.
Since 1840, when accurate measures of the intensity were first made, the field strength has declined by about 5 percent per century.
news.nationalgeographic.com...
Here is a video explaining what is happening and has been happening since 1840.
So you see, climate changes is not the only thing that has been happening, and is still happening on Earth.
Title:
Climate determinism or Geomagnetic determinism?
Authors:
Gallet, Y.; Genevey, A.; Le Goff, M.; Fluteau, F.; Courtillot, V.
Affiliation:
AA(Institut de Physique du Globe de Paris, 4 Place Jussieu, Paris, 75005 France ; [email protected]), AB(Centre de Recherche et de Restauration des Musees de France, Palais du Louvre, Porte des Lions 14 quai Francois Mitterrand, Paris, 75001 France ; [email protected]), AC(Institut de Physique du Globe de Paris, 4 Place Jussieu, Paris, 75005 France ; [email protected]), AD(Institut de Physique du Globe de Paris, 4 Place Jussieu, Paris, 75005 France ; [email protected]), AE(Institut de Physique du Globe de Paris, 4 Place Jussieu, Paris, 75005 France ; [email protected])
Publication:
American Geophysical Union, Fall Meeting 2006, abstract #GP51A-0940
Publication Date:
12/2006
Origin:
AGU
AGU Keywords:
1503 Archeomagnetism, 1521 Paleointensity, 1605 Abrupt/rapid climate change (4901, 8408), 1616 Climate variability (1635, 3305, 3309, 4215, 4513)
Abstract Copyright:
(c) 2006: American Geophysical Union
Bibliographic Code:
2006AGUFMGP51A0940G
Abstract
A number of episodes of sharp geomagnetic field variations (in both intensity and direction), lasting on the order of a century, have been identified in archeomagnetic records from Western Eurasia and have been called "archeomagnetic jerks". These seem to correlate well with multi-decadal cooling episodes detected in the North Atlantic Ocean and Western Europe, suggesting a causal link between both phenomena. A possible mechanism could be a geomagnetic modulation of the cosmic ray flux that would control the nucleation rate of clouds. We wish to underline the remarkable coincidence between archeomagnetic jerks, cooling events in Western Europe and drought periods in tropical and sub-tropical regions of the northern hemisphere. The latter two can be interpreted in terms of global teleconnections among regional climates. It has been suggested that these climatic variations had caused major changes in the history of ancient civilizations, such as in Mesopotamia, which were critically dependent on water supply and particularly vulnerable to lower rainfall amounts. This is one of the foundations of "climate determinism". Our studies, which suggest a geomagnetic origin for at least some of the inferred climatic events, lead us to propose the idea of a geomagnetic determinism in the history of humanity.
adsabs.harvard.edu...
Possible impact of the Earths magnetic field on the history
of ancient civilizations
Yves Gallet a,⁎, Agnès Genevey b, Maxime Le Goff a, Frédéric Fluteau a,c,
Safar Ali Eshraghi d
a Equipe de Paléomagnétisme, Institut de Physique du Globe de Paris, 4 place Jussieu, 75252 Paris cedex 05, France
b Centre de Recherche et de Restauration des Musées de France, UMR CNRS 171, Palais du Louvre, Porte des Lions,
14 quai François Mitterrand, 75001 Paris, France
c UFR des Sciences Physiques de la Terre, Université Denis Diderot Paris 7, 2 Place Jussieu, 75251 Paris cedex 05, France
d Geological Survey of Iran, Azadi sq., Meraj blvd., PO Box 13185-1494 Tehran, Iran
Received 30 November 2005; received in revised form 3 April 2006; accepted 3 April 2006
Available online 19 May 2006
Editor: R.D. van der Hilst
Abstract
We report new archeointensity results from Iranian and Syrian archeological excavations dated from the second millennium BC.
These high-temperature magnetization data were obtained using a laboratory-built triaxial vibrating sample magnetometer.
Together with our previously published archeointensity results from Mesopotamia, we constructed a rather detailed geomagnetic field intensity variation curve for this region from 3000 BC to 0 BC. Four potential geomagnetic events (“archeomagnetic jerks”), marked by strong intensity increases, are observed and appear to be synchronous with cooling episodes in the North Atlantic.
This temporal coincidence strengthens the recent suggestion that the geomagnetic field influences climate change over multi-decadal time scales, possibly through the modulation of cosmic ray flux interacting with the atmosphere. Moreover, the cooling periods in the North Atlantic coincide with episodes of enhanced aridity in the Middle East, when abrupt societal changes occurred in the eastern Mediterranean and Mesopotamia.
Although the coincidences discussed in this paper must be considered with caution, they lead to the possibility that the geomagnetic field impacted the history of ancient civilizations through climatically driven environmental changes, triggering economic, social and political instability.
© 2006 Elsevier B.V. All rights reserved.
www.ipgp.fr...
And then we have the anomalies in the Solar System which took another turn with the recently found secular variation of the AU, or distance between the Sun and the planets, which has increased and cannot be explained.
Since I started frequenting ATS sometime ago there has been talk about our solar system changing. I have even seen claims of temperature rise on Mars
as a result of our space weather/climate. This 'anomaly' may be real. I have yet to see any proof of such an anomaly on our space climate, but I am
certainly open to speculation.
There is a lot we as a species do not understand. Sadly most refuse to even try.
There is a lot we as a species do not understand. Sadly most refuse to even try.
In the following link you will find a graph showing the rapid decay of the Earth's dipole moment from 1900-2000 showing the decay in the strength of
Earth's magnetic field which does have an effect on climate change.
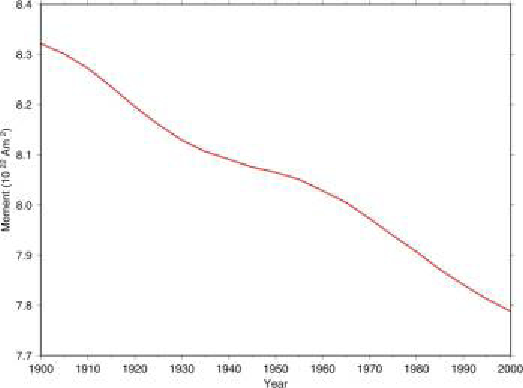
www.phys.ens.fr...
www.phys.ens.fr...
a reply to: SonOfTheLawOfOne
Why would you quote me there?
Answer: because I made a typo
Naughty naughty....
Back to reality, where ever it may be. I do find it interesting that I can not find an up to date location of magnetic north. I can more or less DR it based on NAV charts.....
Pole shift in progress maybe?
Why would you quote me there?
Answer: because I made a typo
Naughty naughty....
Back to reality, where ever it may be. I do find it interesting that I can not find an up to date location of magnetic north. I can more or less DR it based on NAV charts.....
Pole shift in progress maybe?
edit on 7-7-2014 by jrod because: typO gremlins...
originally posted by: jrod
Since I started frequenting ATS sometime ago there has been talk about our solar system changing. I have even seen claims of temperature rise on Mars as a result of our space weather/climate. This 'anomaly' may be real. I have yet to see any proof of such an anomaly on our space climate, but I am certainly open to speculation.
There is a lot we as a species do not understand. Sadly most refuse to even try.
Since at least the end of the 1970s scientists, mainly astrophysicists, were stating that the Solar System was entering a different region of the LIC (Local interstellar Cloud) which could have changes in terrestrial climate.
BTW, yes that research did state our Solar system would encounter such a cloud sometimes in the future extending to maybe 10,000 years. But that was back then, we know now that the solar system would be well within this new region of space within 100 years. I have also posted many times evidence that we have been already encountering parts of that new region of the LIC.
Title:
Is the solar system entering a nearby interstellar cloud
Authors:
Vidal-Madjar, A.; Laurent, C.; Bruston, P.; Audouze, J.
Affiliation:
AA(CNRS, Laboratoire de Physique Stellaire et Planetaire, Verrieres-le-Buisson, Essonne, France), AB(CNRS, Laboratoire de Physique Stellaire et Planetaire, Verrieres-le-Buisson, Essonne, France), AC(CNRS, Laboratoire de Physique Stellaire et Planetaire, Verrieres-le-Buisson, Essonne, France), AD(Meudon Observatoire, Hauts-de-Seine; Paris XI, Universite, Orsay, Essonne, France)
Publication:
Astrophysical Journal, Part 1, vol. 223, July 15, 1978, p. 589-600. (ApJ Homepage)
Publication Date:
07/1978
Category:
Astrophysics
Origin:
STI
NASA/STI Keywords:
....................
Abstract
....................
Observational arguments in favor of such a cloud are presented, and implications of the presence of a nearby cloud are discussed, including possible changes in terrestrial climate. It is suggested that the postulated interstellar cloud should encounter the solar system at some unspecified time in the near future and might have a drastic influence on terrestrial climate in the next 10,000 years.
adsabs.harvard.edu...
ESA sees stardust storms heading for Solar System
PRESS RELEASE
Date Released: Monday, August 18, 2003
Source: Artemis Society
Until ten years ago, most astronomers did not believe stardust could enter our Solar System. Then ESA's Ulysses spaceprobe discovered minute stardust particles leaking through the Sun's magnetic shield, into the realm of Earth and the other planets. Now, the same spaceprobe has shown that a flood of dusty particles is heading our way.
...
What is surprising in this new Ulysses discovery is that the amount of stardust has continued to increase even after the solar activity calmed down and the magnetic field resumed its ordered shape in 2001.
Scientists believe that this is due to the way in which the polarity changed during solar maximum. Instead of reversing completely, flipping north to south, the Sun's magnetic poles have only rotated at halfway and are now more or less lying sideways along the Sun's equator. This weaker configuration of the magnetic shield is letting in two to three times more stardust than at the end of the 1990s. Moreover, this influx could increase by as much as ten times until the end of the current solar cycle in 2012.
www.spaceref.com...
Because the magnetic field of the Sun is weaker, more interstellar dust has been entering the Solar System, but at the same time the region in which the Solar System is moving into has intestellar dust that gets denser, and denser the more the Solar Systm moves into it.
When I reported this information the first time some years back I also stated that if more interstellar dust was entering the Solar System, then more charged particles, plasma, and gases, which particles are much smaller than that of dust, were also entering the Solar System.
At least there was one member who was skeptical, and said there was no proof that more charged particles were entering the Solar System, but now we know that my assertion was true.
Like a wounded Starship Enterprise, our solar system's natural shields are faltering, letting in a flood of cosmic rays. The sun's recent listlessness is resulting in record-high radiation levels that pose a hazard to both human and robotic space missions.
Galactic cosmic rays are speeding charged particles that include protons and heavier atomic nuclei. They come from outside the solar system, though their exact sources are still being debated.
www.newscientist.com...
I posted a lot more information in threads like the following.
www.abovetopsecret.com...
edit on 7-7-2014 by ElectricUniverse because: Correct errors.
Secular increase of the astronomical unit and perihelion precessions as tests of the Dvali–Gabadadze–Porrati multi-dimensional braneworld scenario
Lorenzo Iorio JCAP09(2005)006 doi: 10.1088/1475-7516/2005/09/006
Lorenzo Iorio
Viale Unità di Italia 68, 70125, Bari, Italy
E-mail: [email protected]
Abstract. An unexpected secular increase of the astronomical unit, the length scale of the Solar System, has recently been reported by three different research groups (Krasinsky and Brumberg, Pitjeva, Standish). The latest JPL measurements amount to 7 ± 2 m cy−1. At present, there are no explanations able to accommodate such an observed phenomenon, either in the realm of classical physics or in the usual four-dimensional framework of the Einsteinian general relativity. The Dvali–Gabadadze–Porrati braneworld scenario, which is a multi-dimensional model of gravity aimed at providing an explanation of the observed cosmic acceleration without dark energy, predicts, among other things, a perihelion secular shift, due to Lue and Starkman, of 5 × 10⁻⁴ arcsec cy−1 for all the planets of the Solar System. It yields a variation of about 6 m cy−1 for the Earth–Sun distance which is compatible with the observed rate of change for the astronomical unit. The recently measured corrections to the secular motions of the perihelia of the inner planets of the Solar System are in agreement with the predicted value of the Lue–Starkman effect for Mercury, Mars and, at a slightly worse level, the Earth.
www.iop.org...
Now, that's not the only unexplained phenomenon that has scientists baffled, and which affects, and will affect the dynamics of the Solar System as well as the climate on Earth.
For example, we also know that there is "an unexplained increase of the velocity of a series of spacecraft after Earth gravity assists." Not to mention the pioneer anomalies, which after much investigation has been found to be real, and something seems to be slowing down satellites/space craft when they are that far out.
Title:
Anomalies in the Solar System
Authors:
Dittus, Hansjoerg
Affiliation:
AA(ZARM, University of Bremen)
Publication:
37th COSPAR Scientific Assembly. Held 13-20 July 2008, in Montréal, Canada., p.717
Publication Date:
00/2008
Origin:
ADS
Comment:
Symposium D, session 11 (oral). Paper number: D11-0001-08
Bibliographic Code:
2008cosp...37..717D
Abstract
Several observations show unexplained phenomena in our solar system. These observations are e.g. the Pioneer Anomaly, an unexplained constant acceleration of the Pioneer 10 and 11 spacecraft, the Flyby Anomaly, an unexplained increase of the velocity of a series of spacecraft after Earth gravity assists, the recently reported increase of the Astronomical Unit defined by the distance of the planets from the Sun by approximately 10 m per century, the quadrupole and octupole anomaly which describes the correlation of the low l contributions of the Cosmic Microwave Background to the orientation of the Solar system. Lacking any explanation until now, these phenomena are still investigated intensively. In my talk I will discuss the present status of those investigations and the attempts to find reasonable explantions.
adsabs.harvard.edu...
But this is not all. I also found that even comets are being affected by something out there, and comets are arriving days earlier than they are supposed to.
6 The increase of the Astronomical Unit
6.1 The observation
From the analysis of radiometric measurements of distances between the Earth and the major planets including observations from Martian orbiters and landers from 1961 to 2003 a secular increase of the Astronomical Unit of approximately 10 m/cy has been reported (36) (see also the article (37) and the discussion therein).
...
Cosmic expansion The influence of cosmic expansion by many orders of magnitude too small, see Sec.9.2. Neither the modification of the gravitational field of the Sun nor the drag of the planetary orbits due to the expansion is big enough to explain this drift.
...
The reason for this is totally unclear. One may speculate that an unknown gravitational field within the Solar system slightly redirects the incoming cosmic microwave radiation (in the similar way as a motion with a certain velocity with respect to the rest frame of the cosmological background redirects the cosmic background radiation and leads to modifications of the dipole and quadrupole parts). Such a redirection should be more pronounced for low–l components of the radiation. It should be possible to calculate the gravitational field needed for such a redirection and then to compare that with the observational data of the Solar system and the other observed anomalies.
...
8.2 Other anomalies?
There is one further observation which status is rather unclear bit which perhaps may fit into the other observations. This is the observation of the return time of comets: Comets usually come back a few days before they are expected when applying ordinary equations of motion. The delay usually is assigned to the outgassing of these objects. In fact, the delay is used for an estimate of the strength of this outgassing. On the other hand, it has been calculated in (44) that the assumption that starting with 20 AU there is an additional acceleration of the order of the Pioneer anomaly also leads to the effect that comets come back a few days earlier. It is not clear whether this is a serious indications but a further study of the trajectories of comets certainly is worthwhile.
arxiv.org...
edit on 7-7-2014 by ElectricUniverse because: correct errors.
I know it seems like I am deviating from the topic of the thread, but the fact is something has been causing the weakening of the Earth's magnetic
field, the increase in magmatic, and seismic activity including under the oceans. At the same time that these changes have been occurring on Earth,
similar changes have been happening on other planets and moons with an atmosphere in our solar system. There has to be one major factor that has been
causing all these changes, including the climatic changes on Earth. It is no coincidence that all of this is happening almost simultaneously.
www.sciencedaily.com...
www.sciencedaily.com...
Read this from 1996 when they thought it was much farther away.
www-news.uchicago.edu...
Ribbon at Edge of Our Solar System: Will the Sun Enter a Million-Degree Cloud of Interstellar Gas?
ScienceDaily (May 24, 2010) — Is the Sun going to enter a million-degree galactic cloud of interstellar gas soon?
Scientists from the Space Research Centre of the Polish Academy of Sciences, Los Alamos National Laboratory, Southwest Research Institute, and Boston University suggest that the ribbon of enhanced emissions of energetic neutral atoms, discovered last year by the NASA Small Explorer satellite IBEX, could be explained by a geometric effect coming up because of the approach of the Sun to the boundary between the Local Cloud of interstellar gas and another cloud of a very hot gas called the Local Bubble. If this hypothesis is correct, IBEX is catching matter from a hot neighboring interstellar cloud, which the Sun might enter in a hundred years.
...
www.sciencedaily.com...
[atsimg]http://files.abovetopsecret.com/images/member/63ffeeb144dd.jpg[/atsimg]
The Sun traveling through the Galaxy happens to cross at the present time a blob of gas about ten light-years across, with a temperature of 6-7 thousand degrees kelvin. This so-called Local Interstellar Cloud is immersed in a much larger expanse of a million-degree hot gas, named the Local Bubble. The energetic neutral atoms (ENA) are generated by charge exchange at the interface between the two gaseous media. ENA can be observed provided the Sun is close enough to the interface. The apparent Ribbon of ENA discovered by the IBEX satellite can be explained by a geometric effect: one observes many more ENA by looking along a line-of-sight almost tangent to the interface than by looking in the perpendicular direction. (Credit: SRC/Tentaris,ACh/Maciej Frolow)
www.sciencedaily.com...
Read this from 1996 when they thought it was much farther away.
Our solar system may be headed for an encounter with a dense cloud of interstellar matter
Our solar system may be headed for an encounter with a dense cloud of interstellar matter–gas and dust–that could have substantial implications for our solar systems interplanetary environment, according to University of Chicago astrophysicist Priscilla Frisch. The good news is that it probably won’t happen for 50,000 years. Frisch presented the results of her research Monday, June 10, at the meeting of the American Astronomical Society in Madison, Wisc.
Frisch has been investigating the interstellar gas in the local neighborhood of our solar system, which is called the Local Interstellar Medium (LISM). This interstellar gas is within 100 light years of the Sun. The Sun has a trajectory through space, and for most of the last five million years, said Frisch, it has been moving through a region of space between the spiral arms of the Milky Way galaxy that is almost devoid of matter. Only recently, within the last few thousand years, she estimates, the Sun has been traveling through a relatively low-density interstellar cloud.
“This cloud, although low density on average, has a tremendous amount of structure to it,” Frisch said. “And it is not inconsistent with our data that the Sun may eventually encounter a portion of the cloud that is a million times denser than what we’re in now.”
Frisch believes the interstellar cloud through which we’re traveling is a relatively narrow band of dust and gas that lies in a superbubble shell expanding outward from an active star-formation region called the Scorpius-Centaurus Association. “When this superbubble expanded around these stars, it expanded much farther into the region of our galaxy between the spiral arms, where our sun lies, because the density is very low,” Frisch said. “It didn’t expand very far in the direction parallel to the spiral arms because it ran into very dense molecular clouds.”
...
www-news.uchicago.edu...
a reply to: ElectricUniverse
Doom doom doom, and you accuse me of being an AGW activist who believes anything AGW article I read. I do appreciate the irony.
Why do so many not want to take care of this planet?
As I person who grew up on the beaches and ocean in a tourist destination, I have observed all kinds of people and all kinds of behaviors. Most have no problem picking up their trash when they leave the beach, yet there is always some who think it is okay to leave all their garbage including their baby's diapers when the leave.
Most of us want to clean up this planet. We have allowed those who think there is nothing wrong with leaving their trash behind to gain power. Now those type of people are trying to convince others it is okay to leave there trash behind because 'the tide will wash it way' or it is too timely and expensive to clean-up their mess.....
CO2 is vital to life on this planet. The spike in concentrations that we are experiencing needs to culled. We are causing the spike.
originally posted by: ElectricUniverse
a reply to: Greven
There is no such thing as "imbalance" with regards to atmospheric CO2. The Earth has gone through periods when atmospheric CO2 levels were 4,000 ppm and higher yet the Earth recovered.
What proof do you have that an increase of 100ppm-120ppm or even 500ppm of atmospheric CO2 is catastrophic?... Computer models which have been shown time and again not to account for natural factors that affect climate change?...
How is there not an imbalance? We are emitting enough CO2 that the global CO2 concentration is increasing. Prior to the industrial age, it was roughly the same or slightly declining. Were humans around when CO2 levels were at 4000 ppm?
I don't see why I should offer any proof of that at all. I didn't claim it was catastrophic; the IPCC might, but they can defend themselves. I wrote that one shouldn't assume cold is bad or hot is good.
originally posted by: ElectricUniverse and ElectricUniverse and ElectricUniverse
a reply to: Greven
GRAPH1
The above graphic is from an analisys of sediment from the Wrangell-St. Elias National Park and Preserve of south-central Alaska (USA)
...
The following is a graph from the Sargasso Sea Temperature reconstruction.
GRAPH2
The above data is up to 1999, but do tell me, have global average temperatures increased 1C -3C since 1998?...
Although this article explains that evidence of the RWP in Asi is being disputed, it does say that and I quote:
This bears great relevance because the RWP weather events weren't reported as much as other Climate Change events.
However if you take a look at this graph, which show the Climate Changes in East Asia for the past 1,800 years you can see that at least part of the Medieval Warm Period was warmer even than the present, and they even mention it.
GRAPH 3
www.diva-portal.org...
www-user.uni-bremen.de...
(continued)
In fact, as I have pointed out before with other research, the Earth has been warmer than during the 20th, or the beginning of the 21st century, yet CO2 levels in the atmosphere were much lower than now.
Such dramatic Climate Changes occurred globally, not just in one area, or just in the northern hemisphere.
...
More abrupt climate changes have occurred in the past.
The claim that the warming of the 20th century is "unprecedented" is nothing but a lie.
Global borehole temperature changes have shown that as areas of the world were still undergoing the LIA (Little Ice Age) the Earth was warming and continued to exponentially warm since the early 1600s.
...
That's without mentioning the fact that people like you continue to ignore the real fact that during warming periods, as the atmosphere warms water vapor levels increase naturally.
Sigh... again a wayward click kills my post. Please fix this ATS. Anyway, I noticed in my search that you basically copied a post from 2 years ago, but that's okay - you put in some effort back then.
The CWP begins around 1850 and stretches to today. What is year 0 on CHART1?
Again, what is year 0 on CHART2? Is year 0 1999AD?
CHART3 is not a chart of temperature - not exactly. It charts δO18 as a relation of temperature, Asian monsoons, and dynastic change. This article goes into more detail about it. This is the link to the work itself. Did you perhaps miss the abstract? Because that abstract suggests we are changing the monsoons:
The sign of the correlation between the AM and temperature switches around 1960, suggesting that anthropogenic forcing superseded natural forcing as the major driver of AM changes in the late 20th century.
re: Torneträsk
see: Climate in northern Europe reconstructed for the past 2,000 years: Cooling trend calculated precisely for the first time. Compare it with the Torneträsk study. It shows that Europe was warmest during the Roman Warm period, but that's outside the Torneträsk study's range. It also shows a spike in the mid-20th century in excess of the highest point in the Medieval Warm period, which is quite different from the Torneträsk study. Derived average temperature was slightly higher overall then as well. The difference is in how much - we're talking tenths of a degree Celsius difference, here - a roughly 2/3rds of a degree Celsius decline in average temperature from the highest average of the Roman Warm period to about 1850. Since then (up until 2000 anyway), temperature has increased roughly 1/3rd of a degree Celsius. Compare that to actual recorded measurements show a much larger increase in less time (1880 until 2014):
You must ask yourself - how accurate are the tree ring studies?
I'm not sure what you're trying to show with the African study or Roman/Byzantine Decline study, however.
The obvious critique with regard to the Bivalve study is that oxygen content of the ocean may now be considerably lower than in the past, due to acidification.
That the local temperature can vary by 2-4 degrees Celsius annually is not really surprising to anyone with a brain.
I refer you again to that tree ring study that I mention previously. Europe had been cooling up until recently - not warming. Again, things can be different in different areas.
People like me huh? That's a broad assumption - I long knew that water vapor was a more potent (and more present) greenhouse gas. Here's a question - if you are correct and most temperature increase is caused by an increase in water vapor... what causes an increase in water vapor?
originally posted by: SonOfTheLawOfOne
a reply to: Greven
You didn't answer any of the questions that I asked directly to you...you call me a liar instead of answering the questions.
I have more integrity than to get down to insults with you. But, don't dare accuse me of lying, I know exactly what I wrote and the context I wrote it in... This:
As Ray already pointed out, the percentage of the carbon isotope that represents human emissions is not 40%, so a large part of the increase is from natural sources too.
Was in reference to the 40% increase in CO2 that JRod kept referring to, which Ray pointed out is NOT all 100% human emissions. I was pointing out that part of that 40% was natural emissions as well, and was not purely anthropogenic.
I question your integrity since you flat out accuse me of lying about something that you didn't bother to read and do your homework on. Here was the original comment from raymunduko:
You mean 60 ppm? And I already gave you those articles...
According to the isotopes the other 60 is natural.
...
Amazing double-standard. Of course the past is relevant to today's understanding, what kind of scientist are you? You aren't applying the same standard of "conditions were far different" a few hundred thousand years ago to your data when it is convenient for you.
...
So it was so different in pre-historic times, but NOT so vastly different in the ice cores over the last 800K years that you don't ignore that data? Only the last 800K years of findings apply, right? And not the GEOCARB data or stomata records or anything else?
What a joke. You can use data from sources that are from hundreds of thousands of years ago to support your arguments, but ignore the data conveniently when it doesn't match your mental model.
...
You would know if your paper was printed, but you aren't sure? LOL Impressive. Must be a really big journal. One that I shouldn't be concerned with, because they are a small journal that nobody has ever heard of?
...
Again, double-standards. You can call someone else's journal crap, the same standard can be applied to your work and anything you say.
You don't see the hypocrisy in your comment, that you expect that your paper should be taken seriously because it was peer-reviewed and possibly published, even though we don't know what publication.... yet you scold Beck's work because it's in a journal that YOU think is crap? Geez.
And you are going to bust my chops over a claim I made from something I heard first hand? You discredit everything else he understands about CO2 and the physics of it, simply because I made an off-hand comment?
You also didn't source your graph. That could come from anywhere. Please provide a source before I just take it at face value because it came from you.
You are confusing posts. Accusing me of not answering questions in a reply to a post where I addressed every single question in that post is at worst a lie, and at best an error in which you conflated disparate posts.
It is very amusing that you claim to have integrity to not insult someone, then immediately insult someone in the same post. You for some irrelevant reason asked if I had a peer reviewed paper. I responded that I did. You mocked me for not knowing whether or not it was published yet. Rather ironic. For your information, there have been some issues with the journal; it was supposed to be published back in April, but it keeps getting pushed back. I'm not keeping tabs on it; it is a paper I wrote over an experiment I conducted several years ago, in a field I do not work in currently, done when I was still in college. I don't mean to brag, but getting a paper into a journal as an undergraduate is no small feat. But if you want to proceed to mock and demean, you might as well throw up your publications so that we can judge you, as you have me.
Again, you are inferring that, because one study claims a certain percentage of atmospheric CO2 is of human origin, that the rest must be natural. That was my question. You denied writing it. Granted, I did miss raymunduko had written that the others were natural, so I'll drop it. You are backing him up here, though.
Perhaps I'm having trouble remembering where I reference something hundreds of thousands of years or millions of years ago to support something I claimed, but you'll have to point that out for me.
If I had no upcoming journal publication, what would you then have written - that I have no room to criticize because I had no paper past peer review? Do you also tell people not to critique movies unless they make their own?
Recall that an editor in that journal specifically told a reporter that she promotes Anti-climate change work. That marks it as biased, plain and simple. You don't promote work because its political affiliation matches your own. Full stop. You damn sure don't tell a reporter that. It's an egregious admission. The journal in question also went after a blogger because he criticized it, threatening him with legal action. That is childish. All they have to do is prove him wrong to the scientific community, which should be easy if he is indeed wrong. Stop defending incompetence and sloppiness.
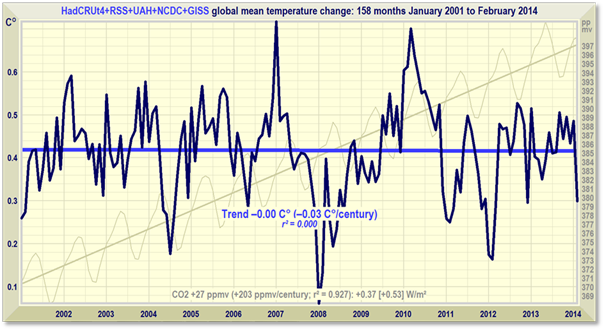
That's rather harsh, I must be so mistrusted. My sources for that chart:
GISS
LASP
Of which, that previous graph is a 17+ year part of this (recall the '17 year pause'):
originally posted by: SonOfTheLawOfOne
a reply to: Greven
You injected yourself into the thread, made a bunch of claims, tried to poke holes in mine and others. When I call you out on them, you avoid them. That's is why you should address them, and they were directed to you as direct questions.
Questions such as:
Q1
Q2
Q3
I would re-phrase the above question to say - can you show me anything, in papers or otherwise, that shows that these factors are accounted for in the same models that predict our doom? If they aren't, and we know they have an impact on CO2, please show how the models aren't wrong and we're all supposed to believe that human emitted CO2 is the cause of current warming and not something else?
You avoided answering this:
Q4
And instead, said it is "irrelevant". It is most certainly relevant.
Q5
I should dismiss a physicist, and all of his work and knowledge, simply because he disagrees with AGW?
And while these weren't posed as direct questions, you completely avoided them as valid points against AGW:
Errata
...
Last but not least, the one question I will ask, is why does temperature increase before CO2 does?
...
Rather than argue the science and the work of the papers that have been published, you are trying to find a reason to discredit me personally and attack me by calling me a liar for something that was clearly a misunderstanding on your part.
I look forward to open discussions and discourse, but not with people the likes of you. You are dishonest. Each of the posts I've written to you, you have done nothing more than try to attack my character, the character and integrity of my references instead of the work that is published.
You should be ashamed to call yourself a scientist, if you do. You are clearly a proponent of AGW and not someone who is open to finding truth, just following the truth others lay at your feet.
I don't think I made a whole lot of claims, to be honest. Do you answer the question of every single AGW proponent in this thread? Do you think it's fair to ask me to do the same to every AGW opponent?
Most of these were in a different post entirely (Q1,Q2,Q3). Complaining about me not answering them in a separate post entirely is conflating how the discussion progresses. Still, I did address each of those questions. Perhaps you forgot in your haste to criticize and insult:
Natural CO2 emissions account for about 96% of annual CO2 emissions. There is no surprise from me that the Amazon or other large carbon-dense areas are emitting a much higher amount of CO2 than humans - it's simple math. Before we started pumping CO2 into the atmosphere, it was was essentially 100%. As I recall, global carbon sink capacity is about 101% of natural emissions. Thus the imbalance, since global CO2 emissions are now at 104.17% or so of natural emissions. There's simply not enough being taken out of the atmosphere annually, and so even the small amount that we contribute adds up.
Those are roughly IPCC estimates, so you'll have to take it up with them if you disagree. This is another source of information on the subject; one concern is that the sinks themselves might start contributing to CO2 emissions. Already, I've spent a great deal of time posting today, and competition for my time is immense, so further examination of this will have to wait.
I will not defend the models and have no reason to do so.
I did not avoid answering Q4, you simply don't like the answer I gave. To ealborate, the Earth was not receiving as much energy from the Sun in the distant past as it does today. Thus, to point at far higher CO2 levels and lower temperatures when the energy input itself was lower, it is disingenuous.
I did not answer Q5, because you completely misinterpreted what I wrote and I didn't want to insult your intelligence. I quoted and explained what I meant in my prior post. You are embarassing yourself at this point to anyone following this topic.
Again, I do not have to defend or support every little thing with AGW. Deal with it as an adult in a discussion on a message board. Oh, look at that, I actually did address all of those questions you accused me of not answering after all!
As for why temperature increased in the past before CO2 levels? That's a good question. Others have their take on it.
edit on 13Mon, 07 Jul 2014 13:59:04
-0500America/ChicagovAmerica/Chicago7 by Greven because: (no reason given)
originally posted by: Greven
How is there not an imbalance? We are emitting enough CO2 that the global CO2 concentration is increasing. Prior to the industrial age, it was roughly the same or slightly declining. Were humans around when CO2 levels were at 4000 ppm?
I don't see why I should offer any proof of that at all. I didn't claim it was catastrophic; the IPCC might, but they can defend themselves. I wrote that one shouldn't assume cold is bad or hot is good.
Because first of all the natural sources of CO2 emissions are not constant from year to year, and any given year the difference in natural CO2 emissions can be higher than the total amount of anthropogenic CO2 emissions.
Second of all, CO2 levels have been higher in the past than now and instead of warming there was a cooling period. Likewise, there have been times during the geological record of Earth's history when CO2 levels were lower than now and temperatures were much higher than now. Such as the Medieval Warming Period, the Roman Warming Period, and the Minoan Warming Period.
The claim that CO2 causes massive warming is false. Like I showed, higher levels of atmospheric CO2 is in fact BENEFITIAL to the Earth. The claim that there is an "imbalance" due to anthropogenic CO2 is nothing more than a romanticized lie.
It is very amusing that you claim to have integrity to not insult someone, then immediately insult someone in the same post. You for some irrelevant reason asked if I had a peer reviewed paper. I responded that I did. You mocked me for not knowing whether or not it was published yet. Rather ironic. For your information, there have been some issues with the journal; it was supposed to be published back in April, but it keeps getting pushed back. I'm not keeping tabs on it; it is a paper I wrote over an experiment I conducted several years ago, in a field I do not work in currently, done when I was still in college. I don't mean to brag, but getting a paper into a journal as an undergraduate is no small feat. But if you want to proceed to mock and demean, you might as well throw up your publications so that we can judge you, as you have me.
I in no way was mocking or demeaning you. I was pointing out the irony in your comments about Beck's work being put in a crappy journal, and yet the journal your tried to publish your work in has had "some issues with the journal" as though your excuse is supposed to be any different than the one you applied to the journal that published Beck's work.
Like you said, rather ironic.
If I had no upcoming journal publication, what would you then have written - that I have no room to criticize because I had no paper past peer review? Do you also tell people not to critique movies unless they make their own?
Your argument here is nothing more than trying to obfuscate things. I only gave my criticism of things that you said which are not supported by empirical evidence, or papers based purely on models and not empirical data or observation.
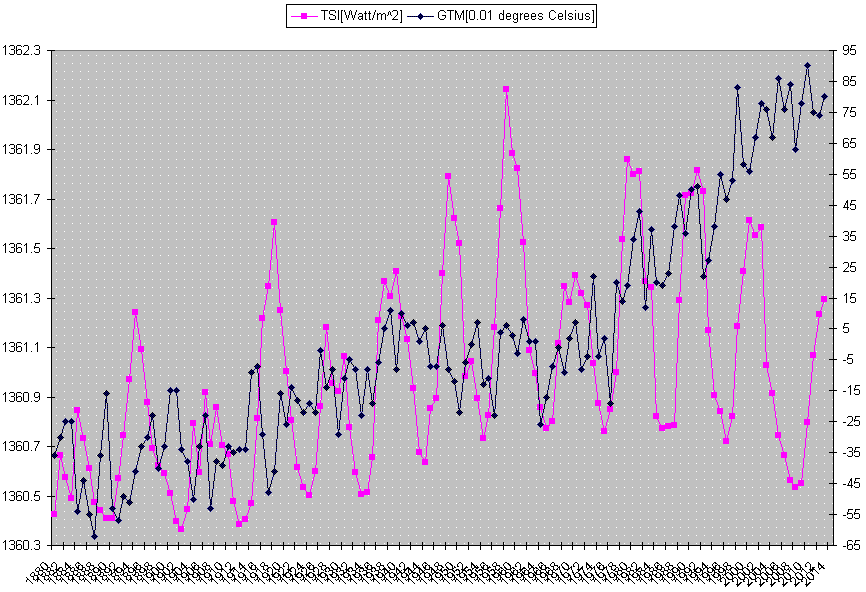
That's rather harsh, I must be so mistrusted. My sources for that chart:
GISS
LASP
Of which, that previous graph is a 17+ year part of this (recall the '17 year pause'):
Bingo!
I don't trust things just because people say it, and your graph and reference prove my point. I asked you for a source, so you had plenty of time to get it right.
Ask yourself, why does your graph look so different from mine if you are using the same GISS as the data source? Did you bother to look at it?
Because your source is (emphasis mine):
GLOBAL Temperature Anomalies in 0.01 degrees Celsius base period: 1951-1980
sources: GHCN-v3 1880-05/2014 (meteorological stations only)
using elimination of outliers and homogeneity adjustment
data.giss.nasa.gov...
(see graph above)
My source:
GLOBAL Land-Ocean Temperature Index in 0.01 degrees Celsius base period: 1951-1980
sources: GHCN-v3 1880-05/2014 + SST: ERSST 1880-05/2014
using elimination of outliers and homogeneity adjustment
data.giss.nasa.gov...
And this is EXACTLY what us "deniers" get pissed about is when data is incorrectly represented.
You are now guilty of it too, regardless if your graph is wrong or your source reference is, it's a reflection of this entire post and everything I've been saying.
Now, maybe you should go model some climate from that graph and tell everyone that the rise in temperature is going to kill everyone if we don't do something to stop it.
Thank you for elegantly illustrating my point.
~Namaste
edit on 7-7-2014 by SonOfTheLawOfOne because: (no reason given)
edit on 7-7-2014 by SonOfTheLawOfOne because: added
graph
edit on 7-7-2014 by SonOfTheLawOfOne because: (no reason given)
originally posted by: Greven
you basically copied a post from 2 years ago[/url], but that's okay - you put in some effort back then.
Yes I did, and this fact does not refute the evidence. Not to mention that people such as yourself often times just post your own opinions without referring to any research or facts. I will prove my point in other responses to you below.
originally posted by: Greven
The CWP begins around 1850 and stretches to today. What is year 0 on CHART1?
That research extends to the year 2010, or 4 years ago.
www.co2science.org...
originally posted by: Greven
Again, what is year 0 on CHART2? Is year 0 1999AD?
Yes the Sargasso Sea temperature graph was researched on that particular paper until 1999. CWP always refers to the AD period... I made the question how different were global temperatures in 1998, a year of global record temperatures, to the present? Is the difference in temperatures from 1998 1C -3C higher than now? The answer is no. Hence the Sargasso Sea temperatures until 1999 does show that the CWP is not warmer than it was during the Medieval or the Roman warming periods.
originally posted by: Greven
...
Did you perhaps miss the abstract? Because that abstract suggests we are changing the monsoons:
The sign of the correlation between the AM and temperature switches around 1960, suggesting that anthropogenic forcing superseded natural forcing as the major driver of AM changes in the late 20th century.
It is a "suggestion" because rice farming releases methane, which is a more potent ghg than CO2. But, despite the increase in rice production, as well as an increase in ruminant livestock since 1999, since rumminat livestock also release methane, methane levels have leveled off.
...
On November 17, 2003 National Oceanic and Atmospheric Administration reported that the concentration of the potent greenhouse gas methane in the atmosphere was leveling off and it appears to have remained at this 1999 level (Figure 1). The Intergovernmental Panel on Climate Change in 2007 acknowledged that methane concentrations have plateaued, with emissions being equivalent to removals. These changes in methane atmospheric dynamics have raised questions about the relative importance of ruminant livestock in global methane accounting and the value of pursuing means of further suppressing methane production from ruminants. At this time there is no relationship between increasing ruminant numbers and changes in atmospheric methane concentrations changes, a break from previously assumed role of ruminants in greenhouse gases (Figure 1).
...
Despite this lack of success in reducing ruminant methane production, since 1999, the link between atmospheric methane and ruminant population growth seems to have broken down. This has occurred despite accelerated increases in ruminant numbers without an equivalent increase on global methane concentrations within the current time frame.
...
Copyright 2003-2014, International Atomic Energy Agency, P.O. Box 100, Wagramer Strasse 5, A-1400 Vienna, Austria
Telephone (+431) 2600-0; Facsimilie (+431) 2600-7; E-mail: [email protected]
www-naweb.iaea.org...
originally posted by: Greven
...
Compare it with the Torneträsk study. It shows that Europe was warmest during the Roman Warm period, but that's outside the Torneträsk study's range. It also shows a spike in the mid-20th century in excess of the highest point in the Medieval Warm period, which is quite different from the Torneträsk study. Derived average temperature was slightly higher overall then as well. The difference is in how much...
Now you are taking the research completely out of context and making your own conclusions which are wrong. First, that spike could have been caused by climate mechanisms such as El Niño (giving an example) which is why it is a "spike", and not an average for that period of warming.
originally posted by: Greven
...
You must ask yourself - how accurate are the tree ring studies?
A lot more accurate than your out of context conclusions.
originally posted by: Greven
I'm not sure what you're trying to show with the African study or Roman/Byzantine Decline study, however.
Well, the fact that there was a WARMING period during the timeframe of the Medieval Warming period, as well as other research that shows there was WARMING in other continents as well within the same timeframe shows that the Medieval Warming Period, and the Roman Warming Period were "global occurrences", and they were not local, as even you have tried to imply.
originally posted by: Greven
...
The obvious critique with regard to the Bivalve study is that oxygen content of the ocean may now be considerably lower than in the past, due to acidification.
Err, first of all the temperatures during the CURRENT Warming Period were not taken from reconstructions of oxygen content in the ocean... Temperatures for the Current Warming Period have been taken directly from the atmosphere... So when you are implying that the present acidification of the oceans now should make this research invalid is either dishonest on your part, if you knew what you were talking about, or it once again shows you just don't know what you are talking about at all.
edit on 7-7-2014 by ElectricUniverse because: add comments.
new topics
-
What is the white pill?
Philosophy and Metaphysics: 38 minutes ago -
Mike Pinder The Moody Blues R.I.P.
Music: 1 hours ago -
Putin, Russia and the Great Architects of the Universe
ATS Skunk Works: 4 hours ago -
A Warning to America: 25 Ways the US is Being Destroyed
New World Order: 8 hours ago
top topics
-
President BIDEN's FBI Raided Donald Trump's Florida Home for OBAMA-NORTH KOREA Documents.
Political Conspiracies: 14 hours ago, 33 flags -
A Warning to America: 25 Ways the US is Being Destroyed
New World Order: 8 hours ago, 17 flags -
Is AI Better Than the Hollywood Elite?
Movies: 16 hours ago, 4 flags -
Mike Pinder The Moody Blues R.I.P.
Music: 1 hours ago, 3 flags -
What is the white pill?
Philosophy and Metaphysics: 38 minutes ago, 2 flags -
Maestro Benedetto
Literature: 16 hours ago, 1 flags -
Putin, Russia and the Great Architects of the Universe
ATS Skunk Works: 4 hours ago, 1 flags
active topics
-
Gaza Terrorists Attack US Humanitarian Pier During Construction
Middle East Issues • 63 • : ToneD -
Truth Social goes public, be careful not to lose your money
Mainstream News • 133 • : Astyanax -
New whistleblower Jason Sands speaks on Twitter Spaces last night.
Aliens and UFOs • 70 • : baablacksheep1 -
Meadows, Giuliani Among 11 Indicted in Arizona in Latest 2020 Election Subversion Case
Mainstream News • 19 • : Threadbarer -
President BIDEN's FBI Raided Donald Trump's Florida Home for OBAMA-NORTH KOREA Documents.
Political Conspiracies • 27 • : Threadbarer -
A Warning to America: 25 Ways the US is Being Destroyed
New World Order • 20 • : jidnum2 -
Putin, Russia and the Great Architects of the Universe
ATS Skunk Works • 16 • : CristianVictoria -
Alternate Electors vs Fake Electors - What is the Difference.
2024 Elections • 123 • : frogs453 -
Massachusetts Drag Queen Leads Young Kids in Free Palestine Chant
Social Issues and Civil Unrest • 17 • : ToneD -
Hate makes for strange bedfellows
US Political Madness • 51 • : network dude