It looks like you're using an Ad Blocker.
Please white-list or disable AboveTopSecret.com in your ad-blocking tool.
Thank you.
Some features of ATS will be disabled while you continue to use an ad-blocker.

Real Numbers for Gobal Warming - Some Surprises!
page: 5share:
a reply to: TheRedneck
Excellent data. Cue the crazy lefties claiming "you're not a climate scientist so what you found is irrelevant!"
The only thing that one has to know in order to completely and utterly disprove CAGW (or even AGW) is the numbers.
The observed greenhouse gas effect of CO2 is ~1.5C for every doubling of CO2 in the atmosphere. In 1800 we were at 282ppm. So when we reach 564 we will have raised earths temperature by ~1.5C. We are currently at 408ppm, so in 220 years we have added 126ppm, we still have 156 to go. It will take us another 150-200 years to add that, and that's if we don't transition away from fossil fuels like we already are doing.
Furthermore, we wouldn't see another 1.5C increase until we hit 1128ppm of CO2 in the atmosphere. When would that happen? About a millennia from now.
All of this, of course, assumes that people are responsible for 100% of the increase of CO2 in the atmosphere. Which they are not. Probably more along the lines of 50% give or take.
edit on 2-12-2018 by Dfairlite because: (no reason given)
originally posted by: Dfairlite
a reply to: TheRedneck
Excellent data. Cue the crazy lefties claiming "you're not a climate scientist so what you found is irrelevant!"
The only thing that one has to know in order to completely and utterly disprove CAGW (or even AGW) is the numbers.
The observed greenhouse gas effect of CO2 is ~1.5C for every doubling of CO2 in the atmosphere. In 1800 we were at 282ppm. So when we reach 564 we will have raised earths temperature by ~1.5C. We are currently at 408ppm, so in 220 years we have added 126ppm, we still have 156 to go. It will take us another 150-200 years to add that, and that's if we don't transition away from fossil fuels like we already are doing.
Furthermore, we wouldn't see another 1.5C increase until we hit 1128ppm of CO2 in the atmosphere. When would that happen? About a millennia from now.
All of this, of course, assumes that people are responsible for 100% of the increase of CO2 in the atmosphere. Which they are not. Probably more along the lines of 50% give or take.
chemtrails are being used to geoengineer, and even with them there are issues.
edit on 2-12-2018 by Xenogears because: clarify
This is a great thread. Of course, the data will have to be "adjusted" to make warming appear, as NASA had to do with the satellite data when it
didn't show what they wanted. Because, that's science...
originally posted by: Dfairlite
a reply to: TheRedneck
All of this, of course, assumes that people are responsible for 100% of the increase of CO2 in the atmosphere. Which they are not. Probably more along the lines of 50% give or take.
This is the key part of the issue actually. No one knows how much we're responsible for.
OK, so you conducted your own independent research effort and now you are publishing the results. First of all, kudos for investing your time and
energy.
However, I assume you are putting this out there for critical comment—basically peer review. So, I will respond in that spirit.
I don’t know what your education level or what your field(s) of expertise might be, but for the record, I have a BS in Physics and MS and Doctorate level degrees in Aerospace Engineering. My major fields of study in graduate school included a lot of classes and experience in topics like optimal estimation theory.
I don’t have any strong criticism of your data acquisition methods; the missing data might have been handled a little better, but I don't think it affected the outcome materially. I won't quibble with that.
What I do criticize, however is your process of fitting curves to the data set and the implications that you then draw from those curves.
When you fit a straight line to the data set from 1950 to the present you showed almost a two degree F increase over that time span (about 1.8 F, as best I can make out). (Parenthetically, that’s just about what the Intergovernmental Panel on Climate Change (IPCC) says is the current average global temperature increase since pre-industrial times. So, it looks like you are in agreement with their finding.) You didn’t say what method you used to generate that curve fit, but I assume you probably used the standard minimization of least-squares error criterion.
You mention that you were surprised to see this linear relationship between increasing time and increasing temperature even though (or perhaps because) it agrees with what such groups as the IPCC have been saying for some time. I’m sure you realized that if you simply extended this linear relationship into the future it would continue to predict what the IPCC predicts—about a 4 degree F average rise by the end of the century. So, I guess you looked around for a different answer, and settled on fitting a fourth degree polynomial. And sure enough, when you project that polynomial into the future, you see average temperature going down at some point.
So here are the problems with that. First, you give no physical basis whatever for choosing a higher order polynomial other than your hunch that a linear process shouldn’t continue into the future. You made the statement, “ Nature rarely follows linear anything—4th degree polynomial trends are typically more accurate.” This statement is totally unsupported by any facts and therefore represents nothing more than your confirmation bias. In fact, your statement is contradicted by a lot of known physical phenomena: Gravitational and electric forces, for example, obey an inverse-square relationship. Most solid materials obey a linear relationship between stress and strain. Radioactive materials decay exponentially, and so on. What you seem to be saying here is that somehow, Nature prefers 4th degree polynomial trends as a general principle and therefore you chose that for your model. That is just nonsense, Nature does not have any such preference.
Now it is true, that when confronted with a complex data set such as the temperature history of Huntsville, it is common for scientists to attempt to fit the data to various kinds of curves in order to try to deduce the underlying physical laws. When this is done however, it is important to be unbiased and accurate in the curve fitting, otherwise you can end up falsely confirming a pre-existing belief. For example, if you carefully measured the gravitational attraction force between two objects over a wide range of separation distances and attempted to fit various curves to the force data with no prior belief bias, you would find that a single inverse square term would fit the data perfectly, with essentially no error. Knowing this, you could infer Newton’s law of gravitation. But suppose you had the prior belief that gravity should obey a fourth degree polynomial relationship and you tried to fit the data to that polynomial, using a least squares error algorithm. The algorithm would probably return a series of polynomial coefficients for the curve fit. Does that mean that gravitational attraction is actually a 4th degree polynomial? No. It means that you chose the wrong mathematical model and got a curve fit, but a really crappy one.
Which brings me to the last point. When doing a least squares curve fit to a data set, standard algorithms attempt to minimize the sum of the differences squared between the proposed function and the empirical data (the residuals). Standard least-squares algorithms usually output this number to the user as an indicator of how good the fit is between the proposed function and the actual data. In the example I gave above of curve fitting gravitational data, if you chose an inverse square relationship, the sum of the residuals would be zero, and you would know you hit on the correct mathematical relationship. If you chose a 4th degree polynomial you would get a large residual error. I don’t know if you used this approach; if you did, you did not present or discuss what the error residuals were. For that reason, we have no idea whether a linear relationship or a 4th degree polynomial is actually a better fit.
Or, for that matter, whether some other curve entirely is a better fit. You point out that when you include only the data from 1960 to the present you get a steeper linear relationship than when you include the data from 1950 to the present. To the unbiased observer, that would suggest that whatever the actual curve is, it is getting steeper with time. In other words, the actual curve may be concave upward. That would suggest that a power curve of the form T = T0 ^k or an exponential curve of the form T = T0 exp(t/) would be a much better fit.
Try fitting curves other than those that reflect your confirmation bias and see which ones produce the smallest residual errors.
a reply to: TheRedneck
originally posted by: 1947boomer
OK, so you conducted your own independent research effort and now you are publishing the results. First of all, kudos for investing your time and energy.
However, I assume you are putting this out there for critical comment—basically peer review. So, I will respond in that spirit.
I don’t know what your education level or what your field(s) of expertise might be, but for the record, I have a BS in Physics and MS and Doctorate level degrees in Aerospace Engineering. My major fields of study in graduate school included a lot of classes and experience in topics like optimal estimation theory.
I don’t have any strong criticism of your data acquisition methods; the missing data might have been handled a little better, but I don't think it affected the outcome materially. I won't quibble with that.
What I do criticize, however is your process of fitting curves to the data set and the implications that you then draw from those curves.
When you fit a straight line to the data set from 1950 to the present you showed almost a two degree F increase over that time span (about 1.8 F, as best I can make out). (Parenthetically, that’s just about what the Intergovernmental Panel on Climate Change (IPCC) says is the current average global temperature increase since pre-industrial times. So, it looks like you are in agreement with their finding.) You didn’t say what method you used to generate that curve fit, but I assume you probably used the standard minimization of least-squares error criterion.
You mention that you were surprised to see this linear relationship between increasing time and increasing temperature even though (or perhaps because) it agrees with what such groups as the IPCC have been saying for some time. I’m sure you realized that if you simply extended this linear relationship into the future it would continue to predict what the IPCC predicts—about a 4 degree F average rise by the end of the century. So, I guess you looked around for a different answer, and settled on fitting a fourth degree polynomial. And sure enough, when you project that polynomial into the future, you see average temperature going down at some point.
So here are the problems with that. First, you give no physical basis whatever for choosing a higher order polynomial other than your hunch that a linear process shouldn’t continue into the future. You made the statement, “ Nature rarely follows linear anything—4th degree polynomial trends are typically more accurate.” This statement is totally unsupported by any facts and therefore represents nothing more than your confirmation bias. In fact, your statement is contradicted by a lot of known physical phenomena: Gravitational and electric forces, for example, obey an inverse-square relationship. Most solid materials obey a linear relationship between stress and strain. Radioactive materials decay exponentially, and so on. What you seem to be saying here is that somehow, Nature prefers 4th degree polynomial trends as a general principle and therefore you chose that for your model. That is just nonsense, Nature does not have any such preference.
Now it is true, that when confronted with a complex data set such as the temperature history of Huntsville, it is common for scientists to attempt to fit the data to various kinds of curves in order to try to deduce the underlying physical laws. When this is done however, it is important to be unbiased and accurate in the curve fitting, otherwise you can end up falsely confirming a pre-existing belief. For example, if you carefully measured the gravitational attraction force between two objects over a wide range of separation distances and attempted to fit various curves to the force data with no prior belief bias, you would find that a single inverse square term would fit the data perfectly, with essentially no error. Knowing this, you could infer Newton’s law of gravitation. But suppose you had the prior belief that gravity should obey a fourth degree polynomial relationship and you tried to fit the data to that polynomial, using a least squares error algorithm. The algorithm would probably return a series of polynomial coefficients for the curve fit. Does that mean that gravitational attraction is actually a 4th degree polynomial? No. It means that you chose the wrong mathematical model and got a curve fit, but a really crappy one.
Which brings me to the last point. When doing a least squares curve fit to a data set, standard algorithms attempt to minimize the sum of the differences squared between the proposed function and the empirical data (the residuals). Standard least-squares algorithms usually output this number to the user as an indicator of how good the fit is between the proposed function and the actual data. In the example I gave above of curve fitting gravitational data, if you chose an inverse square relationship, the sum of the residuals would be zero, and you would know you hit on the correct mathematical relationship. If you chose a 4th degree polynomial you would get a large residual error. I don’t know if you used this approach; if you did, you did not present or discuss what the error residuals were. For that reason, we have no idea whether a linear relationship or a 4th degree polynomial is actually a better fit.
Or, for that matter, whether some other curve entirely is a better fit. You point out that when you include only the data from 1960 to the present you get a steeper linear relationship than when you include the data from 1950 to the present. To the unbiased observer, that would suggest that whatever the actual curve is, it is getting steeper with time. In other words, the actual curve may be concave upward. That would suggest that a power curve of the form T = T0 ^k or an exponential curve of the form T = T0 exp(t/) would be a much better fit.
Try fitting curves other than those that reflect your confirmation bias and see which ones produce the smallest residual errors.
a reply to: TheRedneck
One needs a roadmap to navigate through this post.
Thanks for this great investigation you did. Here you see that its not us who caused global warming. Great investigation.
a reply to: 1947boomer
Actually, to the unbiased observer that wouldn't indicate much, it would require further explanation. Being familiar with much of the climate data, I can tell you it is the result of a step up in temperature which happened in the 70's. Therefore the more data you add before the 70's the less steep the curve becomes. Also, when you start after the step up, the curve is much less pronounced. There have been a few studies done on the step up and the most convincing articles I've read examine the correlation between it and clean air laws. It also helps explain "the pause".
To the unbiased observer, that would suggest that whatever the actual curve is, it is getting steeper with time.
Actually, to the unbiased observer that wouldn't indicate much, it would require further explanation. Being familiar with much of the climate data, I can tell you it is the result of a step up in temperature which happened in the 70's. Therefore the more data you add before the 70's the less steep the curve becomes. Also, when you start after the step up, the curve is much less pronounced. There have been a few studies done on the step up and the most convincing articles I've read examine the correlation between it and clean air laws. It also helps explain "the pause".
a reply to: eManym
I've noticed precisely this in my area-- the seasons seem to have shifted a bit over my lifetime. Interesting to see my perception backed by someone's data.
@ TheRedneck--I can't promise I'll ever git-r-done, but I'd love to give your templates a shot. How do I get my hands on them?
I've noticed precisely this in my area-- the seasons seem to have shifted a bit over my lifetime. Interesting to see my perception backed by someone's data.
@ TheRedneck--I can't promise I'll ever git-r-done, but I'd love to give your templates a shot. How do I get my hands on them?
Redneck, a very interesting analysis, thank you for taking the time to do it. I have to say that I disagree with 1947
boomer's use of forces as a comparison for your analysis. Forces a governed by set laws and mathematical theorms. Weather is a predictive model and there is no comparison between the two. Your data review does have some limitations but I think it is a fair evaluation of what we all want to know. None of us has the time or ability to gather the amount of data that a government can so your work is very good and at the very least raises questions that we should all be asking.
Me personally, I think your evaluation shows some serious considerations. The biggest question that I have always had with climate data, is the precession of the earth axis considered? There is a 26,000 year precession cycle to the axis and the last ice age was about 13,000 years ago. If the precession of the earth axis does come into play with weather then it would seem to me that we could be heading back into colder temperatures.
In my humble opinion, any type of linear fit to the data is not a good idea simply because there is too much unpredictability associated with weather forecasting.... the key word here is forecasting.
Nice work, thanks for the effort and the information.
a reply to: TheRedneck
You certainly did a stellar job compared to what our government agencies have been able to explain concerning warming trends. This is real data that is bankable and further supports that there are most likely long term cycles emerging that we really had no clue about.
Congratulations on being able to present this so logically and scientifically. Very hard to argue with solid statistics.
a reply to: TheRedneck
You know, I think I'm just going to sit back and learn as this progresses and others post. Thanks and I'm with it all so far.
You know, I think I'm just going to sit back and learn as this progresses and others post. Thanks and I'm with it all so far.
originally posted by: OccamsRazor04
a reply to: TheRedneck
I think this detailed post highlights the exact problem we have. Things are changing, but why? Our data set is so limited it's impossible to ascribe changes to any one particular reason. If it is cyclical we have not gone long enough to see the cycle.
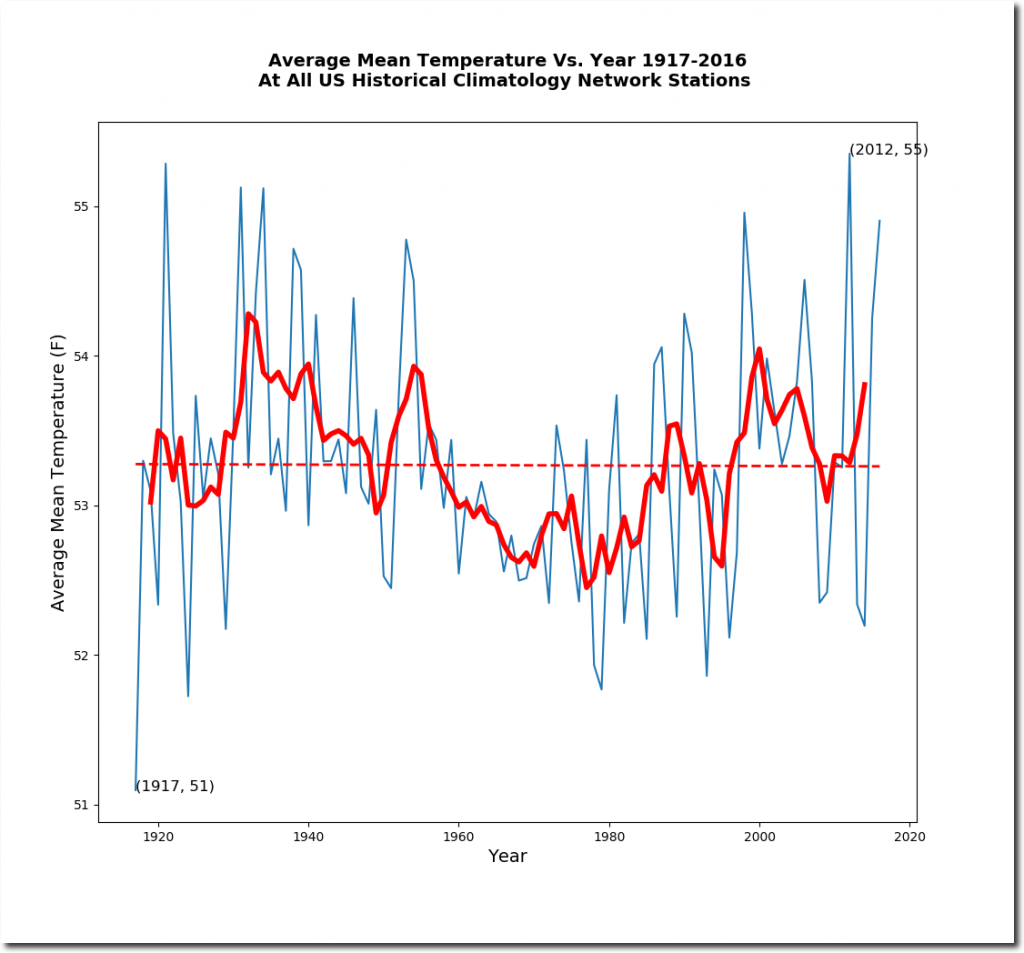
Wouldn't matter if we had solid data showing land temps have remained stable, it's the oceans warming which they use to show how global warming is occurring. It's very hard to show any warming if using land temps alone, and there does seem to be a cycle when you look at the long term data. Here are two interesting charts I came across during a recent debate with Phage, both seem to show the same long term pattern:
originally posted by: ChaoticOrder
This chart shows Texas temps going back to 1900:

This shows the avg mean temp measured by all USHCN stations:
edit on 3/12/2018 by ChaoticOrder because: (no reason given)
a reply to: 1947boomer
Thank you, and yes, you are correct. I am looking for peer review, and I do expect my assumptions to be challenged. I also intend to defend my work. I am responding in that spirit.
What you are not seeing is that I did not simply choose to use a 4th degree curve to fit the data. I did simplify my results in the OP, however, so allow me to correct that:
As stated in the Methodology section, I took 'snapshots' at every decade. As I entered data, I was able to observe the track that the different curves took as time progressed. What I did not mention, as it seemed irrelevant at the time, is that more than two trend curves were fitted. I also included both the 2nd degree and 3rd degree polynomials. Here are the graphs from those saved files, along with a final showing all trend curves. Excel does not like specifying degree in the legend, so bear in mind that the polynomial curves are, in order, 2nd, 3rd, and 4th degree.
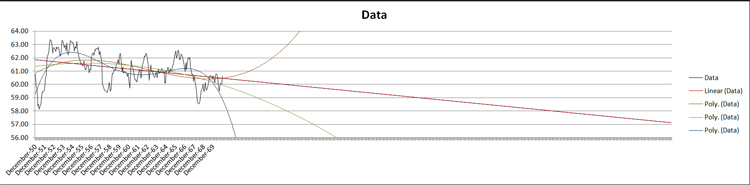
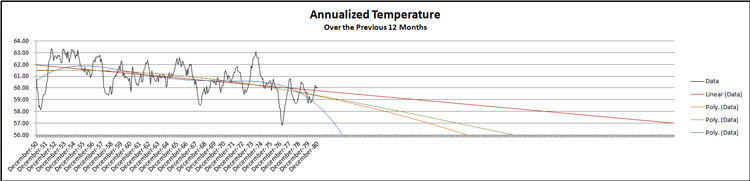
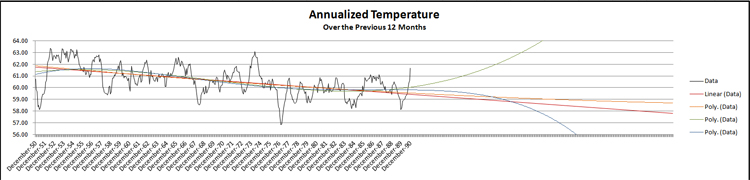
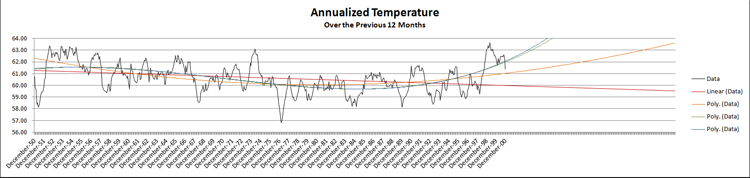
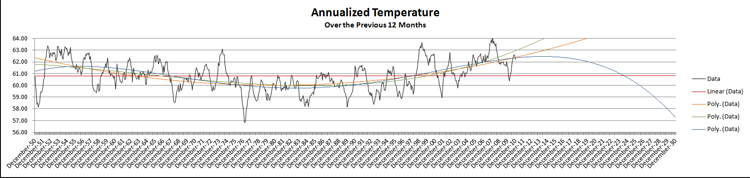
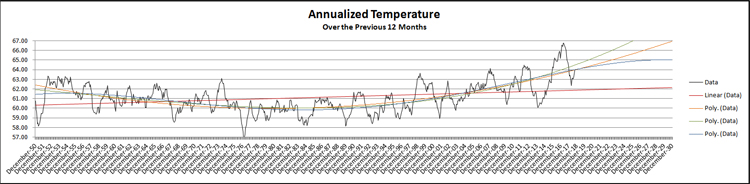
Notice the linear curve as time progresses: it remains decreasing until the 2010 save, and even then is almost flat. Only in the 2018 final graph does it show appreciable warming. The 2nd and 3rd degree polynomial both consistently indicate a runaway system throughout, except for 1990 when the 2nd degree polynomial remains flat.
I would expect any applicable trend line to improve accuracy as the number of samples is increased, so what I was looking for was which trend line stabilized as I approached 2018. That trend line was the 4th degree polynomial, as all of the others (except for linear of course) showed a runaway system.
To answer an earlier question, I hold a BSEE from UAH as well as an AS in computer information systems and quite a few non-degree-seekiing studies into physics. I have also completed all coursework toward an MSEE in Control Theory and Communications. While that seems somewhat trivial compared to Doctorates, I might point out that the climate of the Earth is a control system... a massively MIMO non-linear control system which is still not understood well... and therefore lends itself to such analysis. What we do know is that it is an inherently stable system with a wide tolerance range. The fact that we are still here after billions of years attests to that. So while I will not assume in an analysis that the system cannot be overloaded, I can and do assume that such overloading will not be easily obtained. Thus, I look for the more stable trend lines with the most data.
The fact that the 4th degree polynomial seemed to fit this requirement is not surprising. In a MIMO control, the order of the equation is based on the number of separate, distinct inputs. Since we know that the climate is inherently chaotic (translating to multiple inputs to the system), a higher-order polynomial is indicated. Lower order equations are applicable to simpler systems, such as a SISO motor controller. In such a case, I would develop the controls to maintain a perfectly flat operation; the characteristics of a lower order polynomial lend themselves to a narrow tolerance range and a tighter needed control, because the system is inherently unstable due to the lower order describing equations.
If one really wants a tight trend curve, one would need an nth order polynomial. Alas, that is a bit beyond how far I am willing to go with this analysis at this time.
I am willing, however, to attempt an exponential trend curve. That is simple enough. I will let you know when that is completed and publish the results here. Thank you for the constructive criticism.
TheRedneck
OK, so you conducted your own independent research effort and now you are publishing the results. First of all, kudos for investing your time and energy.
However, I assume you are putting this out there for critical comment—basically peer review. So, I will respond in that spirit.
Thank you, and yes, you are correct. I am looking for peer review, and I do expect my assumptions to be challenged. I also intend to defend my work. I am responding in that spirit.
I don’t have any strong criticism of your data acquisition methods; the missing data might have been handled a little better, but I don't think it affected the outcome materially. I won't quibble with that.
What I do criticize, however is your process of fitting curves to the data set and the implications that you then draw from those curves.
What you are not seeing is that I did not simply choose to use a 4th degree curve to fit the data. I did simplify my results in the OP, however, so allow me to correct that:
As stated in the Methodology section, I took 'snapshots' at every decade. As I entered data, I was able to observe the track that the different curves took as time progressed. What I did not mention, as it seemed irrelevant at the time, is that more than two trend curves were fitted. I also included both the 2nd degree and 3rd degree polynomials. Here are the graphs from those saved files, along with a final showing all trend curves. Excel does not like specifying degree in the legend, so bear in mind that the polynomial curves are, in order, 2nd, 3rd, and 4th degree.
Notice the linear curve as time progresses: it remains decreasing until the 2010 save, and even then is almost flat. Only in the 2018 final graph does it show appreciable warming. The 2nd and 3rd degree polynomial both consistently indicate a runaway system throughout, except for 1990 when the 2nd degree polynomial remains flat.
I would expect any applicable trend line to improve accuracy as the number of samples is increased, so what I was looking for was which trend line stabilized as I approached 2018. That trend line was the 4th degree polynomial, as all of the others (except for linear of course) showed a runaway system.
To answer an earlier question, I hold a BSEE from UAH as well as an AS in computer information systems and quite a few non-degree-seekiing studies into physics. I have also completed all coursework toward an MSEE in Control Theory and Communications. While that seems somewhat trivial compared to Doctorates, I might point out that the climate of the Earth is a control system... a massively MIMO non-linear control system which is still not understood well... and therefore lends itself to such analysis. What we do know is that it is an inherently stable system with a wide tolerance range. The fact that we are still here after billions of years attests to that. So while I will not assume in an analysis that the system cannot be overloaded, I can and do assume that such overloading will not be easily obtained. Thus, I look for the more stable trend lines with the most data.
The fact that the 4th degree polynomial seemed to fit this requirement is not surprising. In a MIMO control, the order of the equation is based on the number of separate, distinct inputs. Since we know that the climate is inherently chaotic (translating to multiple inputs to the system), a higher-order polynomial is indicated. Lower order equations are applicable to simpler systems, such as a SISO motor controller. In such a case, I would develop the controls to maintain a perfectly flat operation; the characteristics of a lower order polynomial lend themselves to a narrow tolerance range and a tighter needed control, because the system is inherently unstable due to the lower order describing equations.
If one really wants a tight trend curve, one would need an nth order polynomial. Alas, that is a bit beyond how far I am willing to go with this analysis at this time.
I am willing, however, to attempt an exponential trend curve. That is simple enough. I will let you know when that is completed and publish the results here. Thank you for the constructive criticism.
TheRedneck
a reply to: riiver
Ask.
The Excel spreadsheet is a hair under 10 MB in size, so I might have to upload it to an upload service. Since this is not a project I expect to profit from, I have no issue with doing that if need be. Send me a PM and we'll work out the details on getting a copy in your hands.
TheRedneck
@ TheRedneck--I can't promise I'll ever git-r-done, but I'd love to give your templates a shot. How do I get my hands on them?
Ask.
The Excel spreadsheet is a hair under 10 MB in size, so I might have to upload it to an upload service. Since this is not a project I expect to profit from, I have no issue with doing that if need be. Send me a PM and we'll work out the details on getting a copy in your hands.
TheRedneck
a reply to: AlFeynman
Thank you, but I am actually going to disagree with your disagreement.
Well, a little anyway...
A force is simply an input to a system. There is really no difference, from an analysis standpoint, between mechanical forces and radiative forcing... both are simply inputs. Where the difference come in is that there is also a stability factor to consider. Let me see if I can put this in layman's terms.
If I have a rocket ship with a booster at the bottom, pointing straight up, that system is stable if and only if the rocket maintains a perfectly vertical direction, and no outside forces act on it (as in wind force). Any deviation from vertical, however, no matter how slight, will cause the rocket to become unstable and start flipping as the instability grows. It has a very narrow range of stability and any control system must maintain a tight tolerance to keep the rocket stable.
Now consider a rocket that (for some unknown reason) is pointed downward with the booster now at the top. Regardless of outside forces, that rocket will try to right itself to a downward trajectory, as long as the outside forces do not overpower it. In this case, it has a very wide range of stability and requires little assistance to maintain stability.
Mathematically, the only difference is the sign of one of the terms in the describing differential equation. But that sign makes all the difference in the world.
Now, would the forces involved be different if they came from wind, from an impact, from a density differential, or from any other source? No. The effect would be the same, as the control itself, which in this case would be adjustment of the angle of the booster, could also be considered a force.
1947boomer does bring up some vital points. I simply disagree that lower order equations are more accurate in this case, due to the complexity of the system and the number of inputs applied to it.
TheRedneck
Redneck, a very interesting analysis, thank you for taking the time to do it. I have to say that I disagree with 1947
boomer's use of forces as a comparison for your analysis. Forces a governed by set laws and mathematical theorms.
Thank you, but I am actually going to disagree with your disagreement.
Well, a little anyway...
A force is simply an input to a system. There is really no difference, from an analysis standpoint, between mechanical forces and radiative forcing... both are simply inputs. Where the difference come in is that there is also a stability factor to consider. Let me see if I can put this in layman's terms.
If I have a rocket ship with a booster at the bottom, pointing straight up, that system is stable if and only if the rocket maintains a perfectly vertical direction, and no outside forces act on it (as in wind force). Any deviation from vertical, however, no matter how slight, will cause the rocket to become unstable and start flipping as the instability grows. It has a very narrow range of stability and any control system must maintain a tight tolerance to keep the rocket stable.
Now consider a rocket that (for some unknown reason) is pointed downward with the booster now at the top. Regardless of outside forces, that rocket will try to right itself to a downward trajectory, as long as the outside forces do not overpower it. In this case, it has a very wide range of stability and requires little assistance to maintain stability.
Mathematically, the only difference is the sign of one of the terms in the describing differential equation. But that sign makes all the difference in the world.
Now, would the forces involved be different if they came from wind, from an impact, from a density differential, or from any other source? No. The effect would be the same, as the control itself, which in this case would be adjustment of the angle of the booster, could also be considered a force.
1947boomer does bring up some vital points. I simply disagree that lower order equations are more accurate in this case, due to the complexity of the system and the number of inputs applied to it.
TheRedneck
originally posted by: DBCowboy
a reply to: TheRedneck
*applause*
This has spurred me to conduct a study of my own. We often hear about water levels rising and since I live on a coastal area, I can look at water levels here.
Thanks for making me think!
i have no doubt that the oceans are rising at least a little bit. after all, all that freshwater from the continents has to be going somewhere. my grandfather paid attention to the water levels in a lake directly connected to Lake Ontario, and Lake Ontario for years, since he was a kid. he often noted how the levels had gone down by feet. i know the levels have dropped about 2 feet since i was a kid. since i can see where i remember the water levels once were when i was a kid on different landmarks and dock areas, against where they are now. in fact one boat ramp that we used, is now barely even in the water at the end of it. a pier we used to jump off of into the water, now has barely a foot of water to jump into. areas that were once the very edge of the lake, are now high and dry small cliffs.
there are even lakes in northern Canada that have almost completely dried up, and no longer there. once mighty rivers have become streams. this was rather noticeable on two canoe trips i was on. ne we followed the trip taken by my dad's boy scout troop when he was a kid. he noticed much lower water levels from that time. and as you see all over the north old logging installations like chutes that at one time were in the water are now sitting high and dry and not even on the beach anymore. on another trip i did with a camp i went to we took a river system that had not been done in over 40 years. the reason they had stopped using that route was that they blew up a log jam with no warning as that trip had come around a bend. as well as with all the logs being floated down river, it made for a lot of issues navigating. we had copies of the original trip journals from that last trip as well as others before. we found it hard going due to the drop of water levels being so drastic from that 40 year timespan. what was once a big, wide river. that was used to float logs down was now very much reduced. in fact there were many spots where canoes barely even had enough water to float, and in many cases we had to portage around areas that did not even have enough water to be able to go through. in one case what was once a minor rapids set, had become a small falls. that whole trip you could see where water levels had been, and that was several feet higher. in fact this was one trip that was great for firewood with all the old dead heads high and dry away from the riverbanks. along with old forgotten log jams that were actually pretty far away on both sides of the river. the river having gone from 30-40 feet wide, to barely 10 feet wide in many areas. the fact is that North America has been steadily draining and loosing much of it's fresh water for hundreds of years. and all that water has ended up in the oceans.
Thank you TheRedneck. good post.
To any one!
There is a Lot more that effects the temperature than people realize.
people just down't know how much Heat comes from Inside the earth.
found this,
100 to 1,000 feet deep, increase 1 degree 'F in 29 feet.
100 to 1,800 feet deep, increase 1 degree 'F in 30.5 feet.
100 to 2,300 feet deep, increase 1 degree 'F in 32.3 feet.
but the internet seems to be hiding just how hot it gets?
" Two miles down, the rock is about 130 degrees Fahrenheit"
TauTona Mine
is any one in the world keeping a record of the deep earth temperature?
a reply to: TheRedneck
Wow Redneck, what a post. S N F.
I look at similar data and make a point to double even triple check that we have used a null code where the data is questionable or lost. I can't just use some 'missing' general code either. I must be as specific as I can and the codes are extensive enough. I need EPA to change a couple but I am nitpicking as we have a way to make good changes mixed in with the over reach ones I fight.
a reply to: TheRedneck
# 2 try.
(Oh well. It took using a quote when I just wanted a "reply".)
Data has to be Quality Controlled is the big picture and that shows some nice work IMO.
# 2 try.
(Oh well. It took using a quote when I just wanted a "reply".)
Data has to be Quality Controlled is the big picture and that shows some nice work IMO.
edit on 3-12-2018 by Justoneman because: (no reason given)
new topics
-
Official denial
Diseases and Pandemics: 1 hours ago -
MEGA - Let's Make Europe Great Again
Other Current Events: 1 hours ago -
Hamas and Other Islamist Terrorist Groups Announce Support of US Campus Anti-Israel Protests
Education and Media: 2 hours ago -
Psychotronic Operation Rwanda Who Wants To Be A Refugee?
ATS Skunk Works: 3 hours ago -
AI phrenology
Science & Technology: 10 hours ago
top topics
-
4/27/24 New Jersey Earthquake
Fragile Earth: 15 hours ago, 8 flags -
AI phrenology
Science & Technology: 10 hours ago, 4 flags -
Hamas and Other Islamist Terrorist Groups Announce Support of US Campus Anti-Israel Protests
Education and Media: 2 hours ago, 3 flags -
Fun with extreme paints
Interesting Websites: 17 hours ago, 2 flags -
Psychotronic Operation Rwanda Who Wants To Be A Refugee?
ATS Skunk Works: 3 hours ago, 2 flags -
MEGA - Let's Make Europe Great Again
Other Current Events: 1 hours ago, 1 flags -
Official denial
Diseases and Pandemics: 1 hours ago, 0 flags
active topics
-
MEGA - Let's Make Europe Great Again
Other Current Events • 8 • : watchitburn -
Psychotronic Operation Rwanda Who Wants To Be A Refugee?
ATS Skunk Works • 2 • : gortex -
Official denial
Diseases and Pandemics • 4 • : Lochid -
-@TH3WH17ERABB17- -Q- ---TIME TO SHOW THE WORLD--- -Part- --44--
Dissecting Disinformation • 714 • : Justoneman -
Killings of Palestinian children are soaring in the West Bank.
World War Three • 163 • : Terpene -
AI phrenology
Science & Technology • 13 • : BeyondKnowledge3 -
Hamas and Other Islamist Terrorist Groups Announce Support of US Campus Anti-Israel Protests
Education and Media • 5 • : FlyersFan -
Senator Ron Johnson Interview - PART 1: Mishandling Pandemic To What Ends?
Diseases and Pandemics • 5 • : PrivateAngel -
Why Files Our Alien Overlords | How We Secretly Serve The Tall Whites
Aliens and UFOs • 18 • : TheValeyard -
Supreme Court Oral Arguments 4.25.2024 - Are PRESIDENTS IMMUNE From Later Being Prosecuted.
Above Politics • 123 • : xuenchen