It looks like you're using an Ad Blocker.
Please white-list or disable AboveTopSecret.com in your ad-blocking tool.
Thank you.
Some features of ATS will be disabled while you continue to use an ad-blocker.

Volcano Watch 2014
page: 56share:
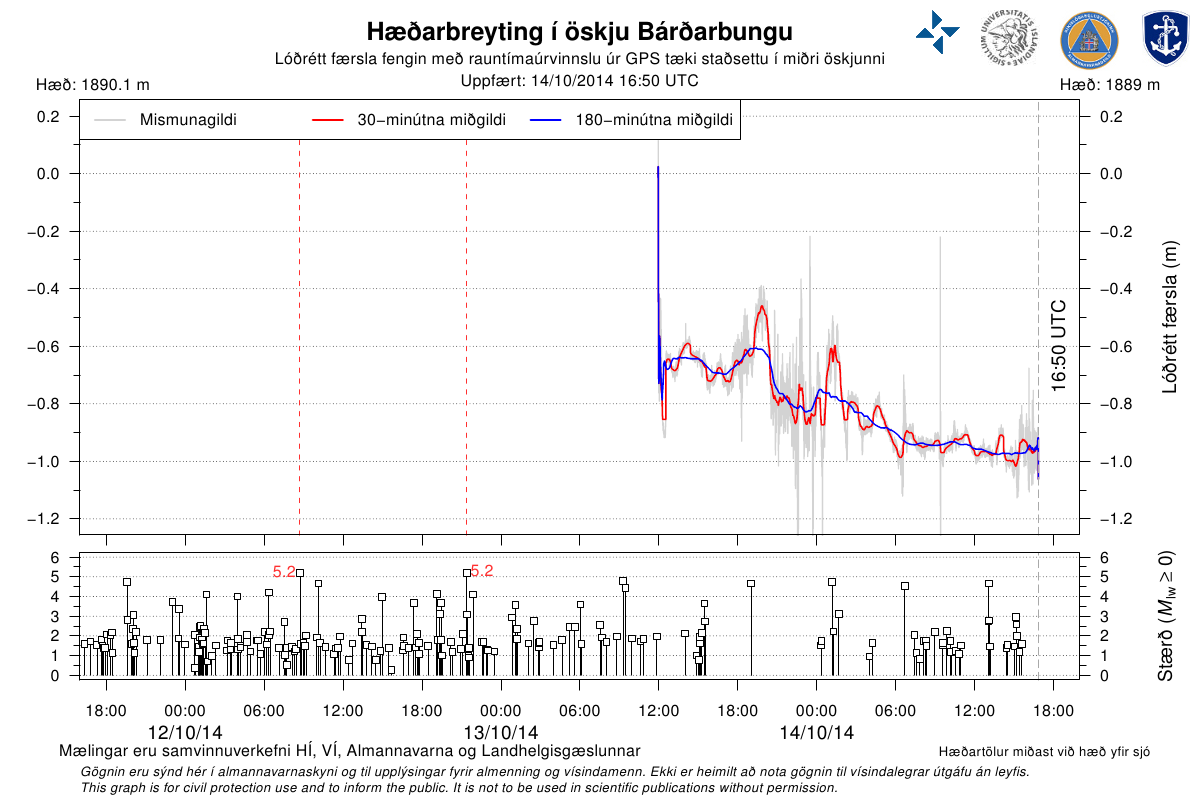
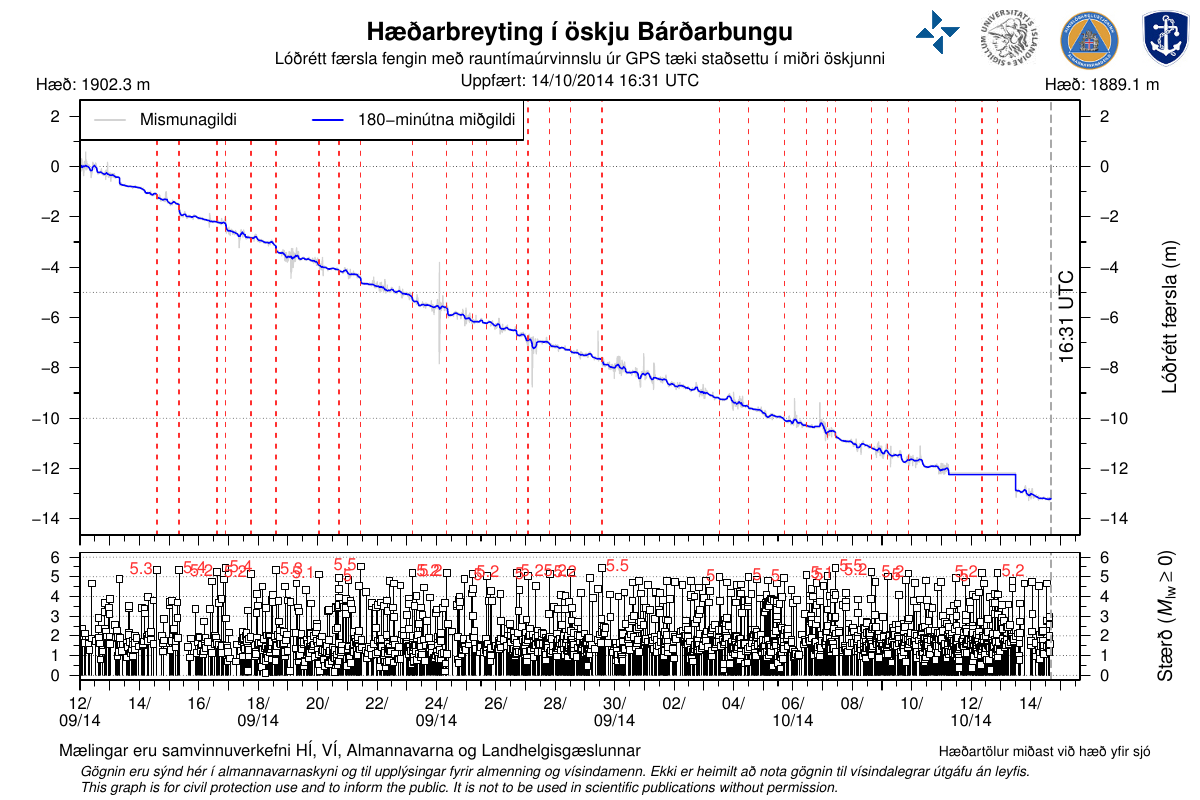
The GPS station in the center of Bardarbunga is currently inactive so no data has been received over the last three days. Repair is on the way.
earthice.hi.is...
must have fixed it, can see the gap in the first image and the flat line in the second image where it wasn't working
en.vedur.is...
 right click "view image" for full size
Bardarbunga-Holuhraun-Tungnafellsjokull-Herdubreidartogl 13.10.2014
mag les than1= 22 , mag1= 43 , mag2= 10 , mag3= 1 , mag4= 3 , mag5= 0
total= 79 , total energy released= 473.1131 TTNT
map and graphs
pretty active at Tungnafellsjokull
not much at the Vatnajokull glacier-Holuhraun dike string, nothing on the lava field at all!
maybe there were more, I deleted another 79 from the list because they were below 90.01% quality, will have a look again next rainy day, its too much work to revise everything over and over.
earthice.hi.is...
must have fixed it, can see the gap in the first image and the flat line in the second image where it wasn't working
en.vedur.is...
edit on 1000000028628614 by muzzy because: (no reason given)
Bardarbunga-Holuhraun-Tungnafellsjokull-Herdubreidartogl 13.10.2014
mag les than1= 22 , mag1= 43 , mag2= 10 , mag3= 1 , mag4= 3 , mag5= 0
total= 79 , total energy released= 473.1131 TTNT
map and graphs
pretty active at Tungnafellsjokull
not much at the Vatnajokull glacier-Holuhraun dike string, nothing on the lava field at all!
maybe there were more, I deleted another 79 from the list because they were below 90.01% quality, will have a look again next rainy day, its too much work to revise everything over and over.
edit on 1000000028628614 by muzzy because: (no reason given)
61 days since the earthquakes took off at Bardar-Dyngj-Holuh
Latitude Cross Section-Bardar-Dyngj-Holuh Animated Gif 11/08/2014-15/10/2014
go here for a slower full size animation (2MB)
animation may stall if your ISP is slow (like mine)
Latitude Cross Section-Bardar-Dyngj-Holuh Animated Gif 11/08/2014-15/10/2014
go here for a slower full size animation (2MB)
animation may stall if your ISP is slow (like mine)
edit on 10u28828814 by muzzy because: many edits, trying to get the animation to work on
ATS
Got home early from work today and thought great I'll get on the IMO and download the data and get a early look at the 16th
doh, only 56 events with above 90.01% quality, 33 below that
guess its better to wait until mid morning Iceland time to get the reviewed data.
I wonder how many scientists are working on this data? nightshift?
Here in NZ they have a scientist/geologist on call, they get a text to hit the computer if something big happens, otherwise its 9-5 work day stuff.
a reply to: muzzy
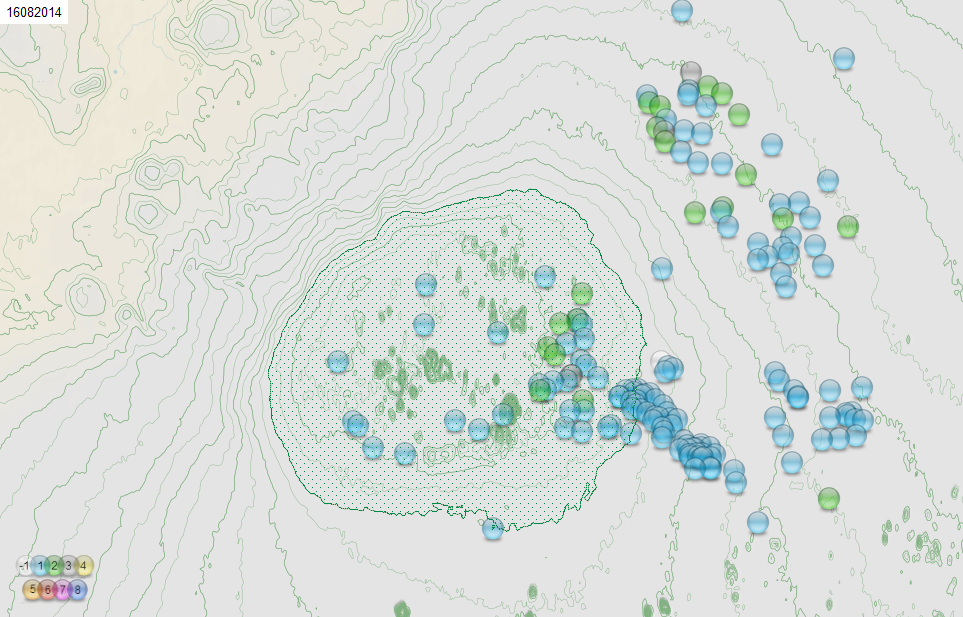
had another look 3 hours later, no change
no events at Vatnajokull glacier, Holuhraun, Askja or Herdubreid, which is unusual
its all happening at Bardarbunga and Tungnafellsjokull
either the data will change on review when the Icelanders drag themselves out of bed, or
we been looking in the wrong direction for the next phase ........
could it be Tungnafellsjokull?
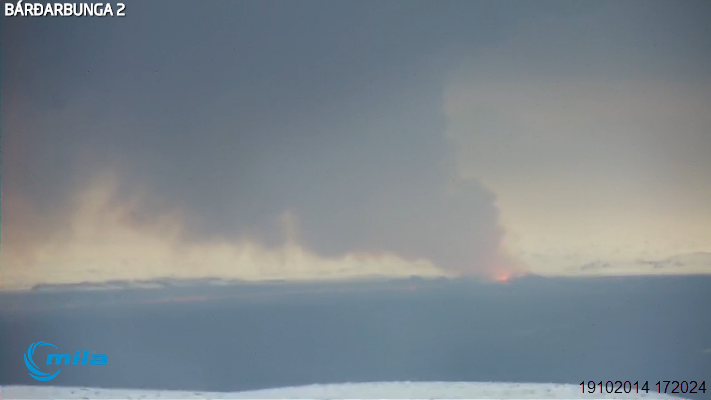
Bardarbunga 16.10.2014
enzo is showing similar results, so its not necessarily just the missing 33 events below 90.01% quality
17th showing similar trend too
had another look 3 hours later, no change
no events at Vatnajokull glacier, Holuhraun, Askja or Herdubreid, which is unusual
its all happening at Bardarbunga and Tungnafellsjokull
either the data will change on review when the Icelanders drag themselves out of bed, or
we been looking in the wrong direction for the next phase ........
could it be Tungnafellsjokull?
Bardarbunga 16.10.2014
enzo is showing similar results, so its not necessarily just the missing 33 events below 90.01% quality
17th showing similar trend too
edit on 1000000028928914 by muzzy because: (no reason given)
a reply to: muzzy
so did it run OK? As the creator you never know if the public see the same as what you see, as the file is on the same computer as the web connection, so it may work different.
heres another animation, same data, but looking down on the area.
slower speed version available here
ths one started out at 5.39MB, but I used ezigif to reduce it to 4.41MB
runs through to the end of 17th October
I have posted the slower vesrion on Volcanic Tremors too, along with the static images that made up the animation here
I like the fast one the early part of the sequence reminds me of the Sandworm in Dune (the book was better than the film IMO)
edit on 10u29029014 by muzzy because: (no reason given)
ALERT
(not scaremongering, but hey take a look)
We could be right on the cusp of Bardarbunga doing something dramatic,
the earthquakes have pulled back from Holuhraun to Bardarbunga for the last 3 days and dropped off in numbers significantly
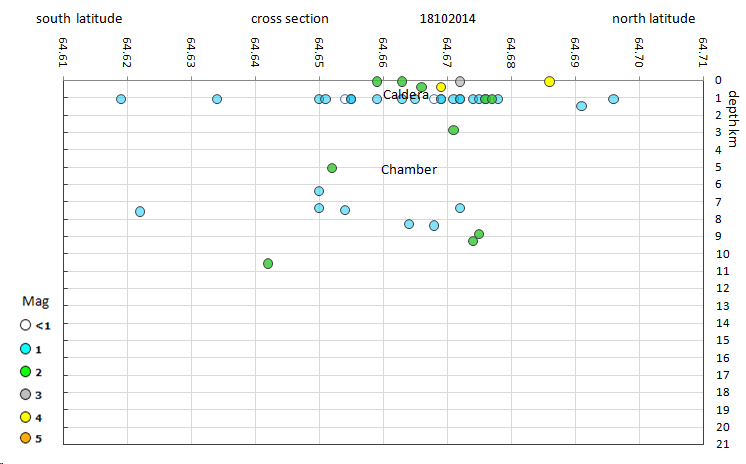
what caought my eye was the depths of the quakes at Bardarbunga yesterday
many at 100 metres, which would put them right at ground level inside the caldera
and many more at 1.1km which wouuld be half way up/down the cone ( is 2km high)
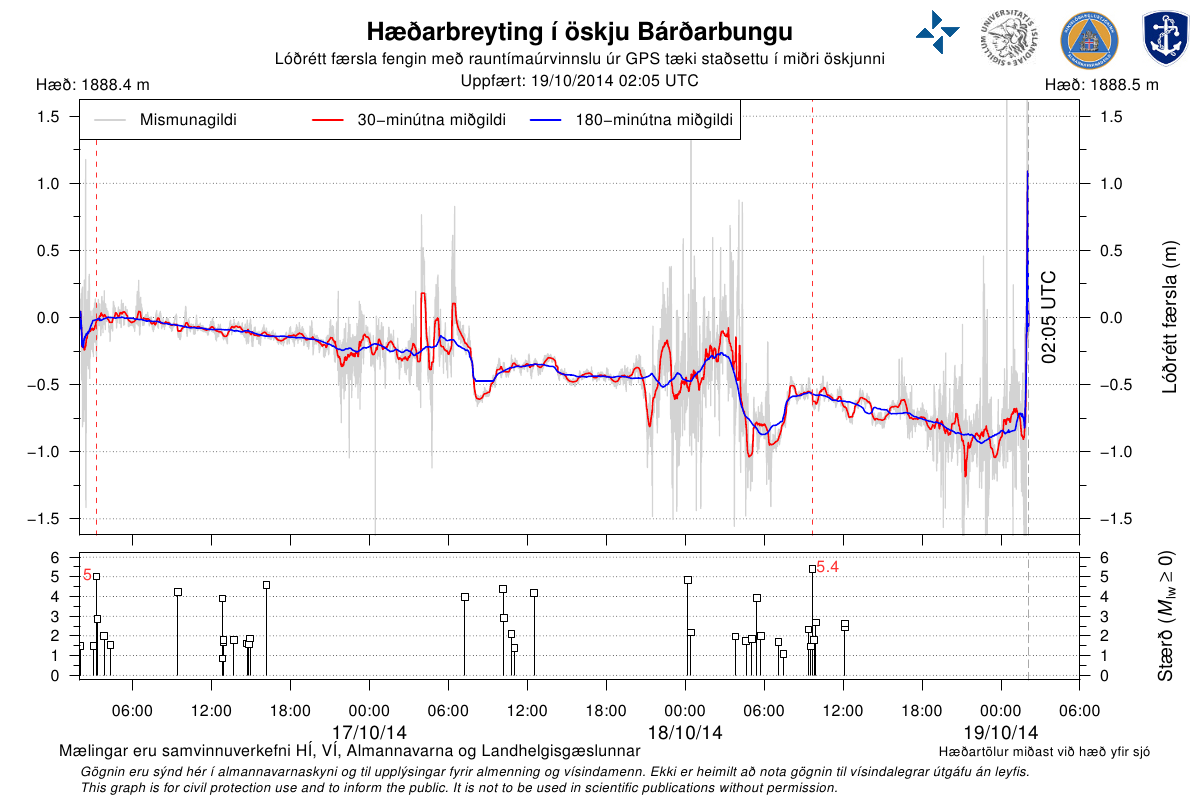
then look at the GPS for today holy cow its going up!
bulging
like its going to burst!
has the dike become blocked and the magma backing up inside the Bardarbunga chamber I wonder?.
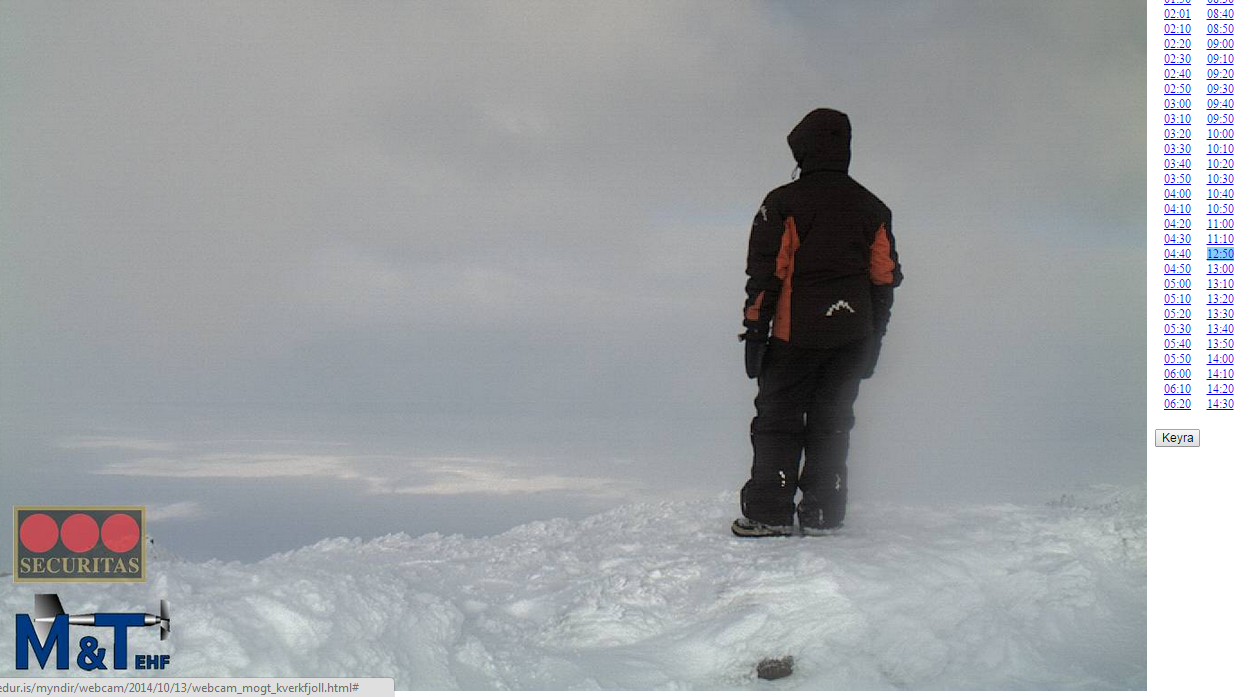
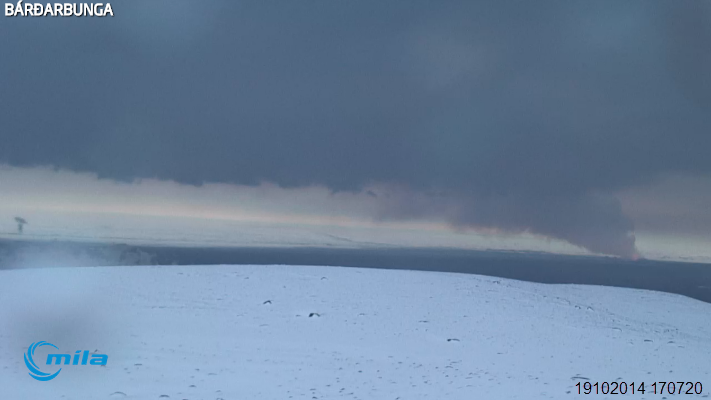
Can't see anything on the web cams so don't know whats happening at the fissure, has it stopped maybe?
going to cut the lawns now
(not scaremongering, but hey take a look)
We could be right on the cusp of Bardarbunga doing something dramatic,
the earthquakes have pulled back from Holuhraun to Bardarbunga for the last 3 days and dropped off in numbers significantly
what caought my eye was the depths of the quakes at Bardarbunga yesterday
many at 100 metres, which would put them right at ground level inside the caldera
and many more at 1.1km which wouuld be half way up/down the cone ( is 2km high)
then look at the GPS for today holy cow its going up!
bulging
like its going to burst!
has the dike become blocked and the magma backing up inside the Bardarbunga chamber I wonder?.
Can't see anything on the web cams so don't know whats happening at the fissure, has it stopped maybe?
going to cut the lawns now
www.youtube.com...
(couldnt get youtube link to play here)
Holuhraun. Trip with NASA pilot.
Look at how the lava has carved a deeper lane to run through.
(couldnt get youtube link to play here)
Holuhraun. Trip with NASA pilot.
Look at how the lava has carved a deeper lane to run through.
edit on Sundayam191431Sun, 19 Oct 2014 06:26:07
-0500262014-10-19T06:26:07-05:00k by LadyTrick because: (no reason given)
edit on Sundayam191431Sun, 19 Oct 2014 06:27:33
-0500272014-10-19T06:27:33-05:00k by LadyTrick because: (no reason given)
a reply to: crappiekat
this was posted by Olivine on Oct 15th
www.mbl.is...
and I think the crew has more balls than the NASA flyover, getting a lot closer
I haven't seen anything more recent
It has been snowing since the 15th, so not good flying weather, or web cam weather
this morning is the first time in 5 days I have seen the eruption in any sense of it being "clear"
edit on 1000000029129114 by muzzy because: (no reason given)
A lot of activity yesterday 20th at the Bardarbunga caldera (with over 90.01% quality)
mag less than1= 3 , mag1= 34 , mag2= 7 , mag3= 12 , mag4= 7 , mag5= 1
total= 64 , total energy released= 1,314.3135 TTNT
Which brings me to something I have been trying to get my head around since this started
What is the shape of the caldera? where is the Rim?
I'm seeing two shapes on the web that are similar
the IMO one
which I don't get the numbers along the borders, they are weird, they are not "northing" type numbers although they do look that style
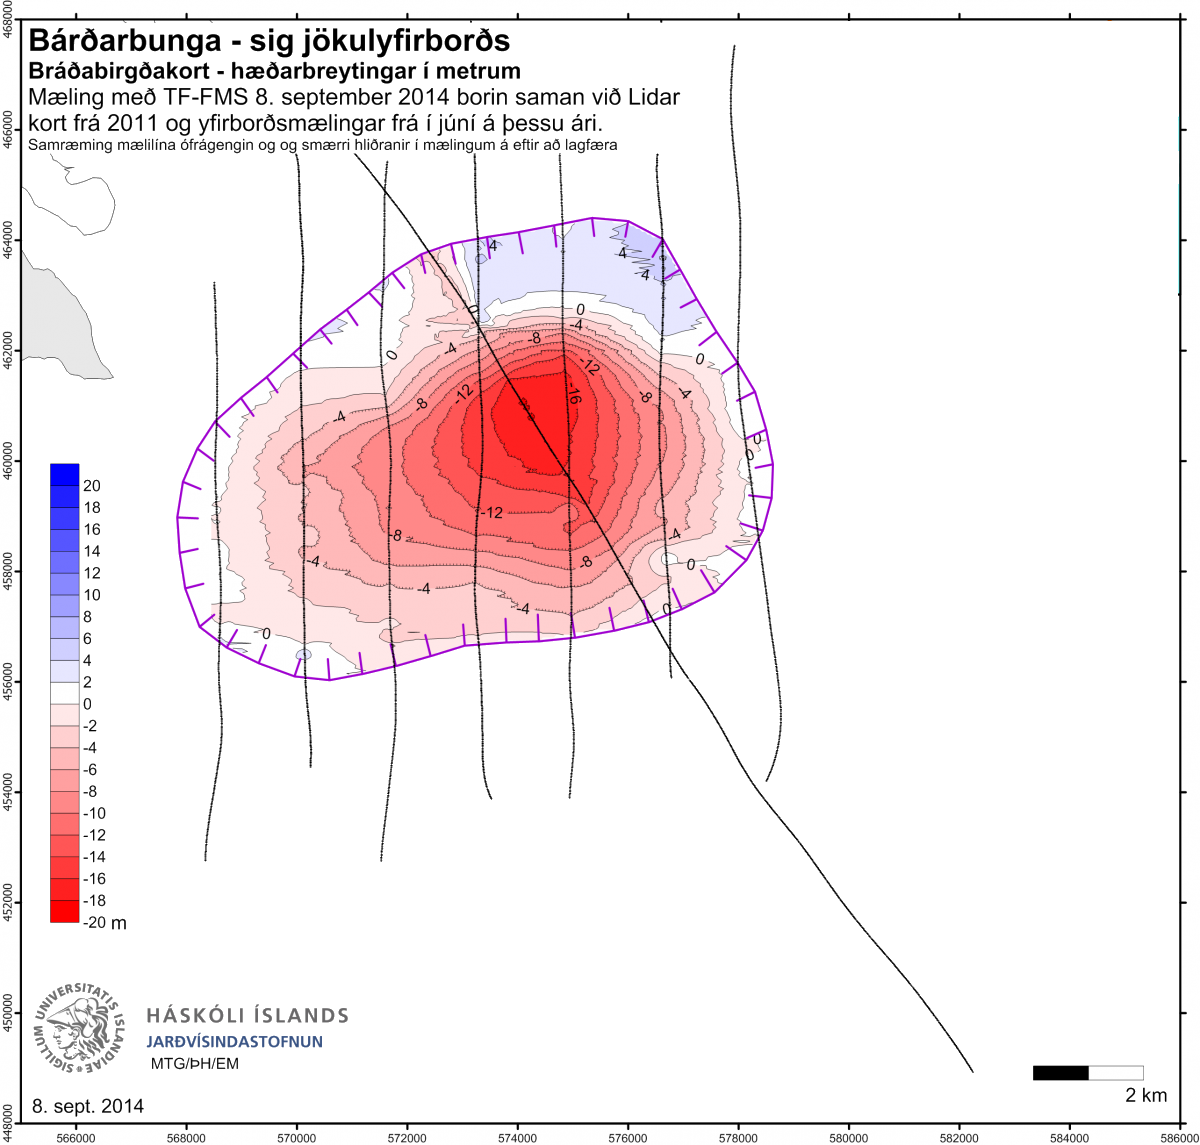
a topographical GE overlay that popped up on volcano cafe, which looks similar, and has a 3D effect to it
then there is the topographical map from OpenCycleMap, which shows something else altogether, basically a flat top cone. I have read the height of Bardarbunga is 2000 metres, Open Cycle map shows only a few smaller cones inside the caldera at 2000m, the main top is at 1900, then there is a plateau on the left side ( green outline line marked "a" on my image below is at 1950m, and a the cones also on the left at 2000m (marked "b")
The closest topo match to the first two caldera images above is the 1900m level !!??!
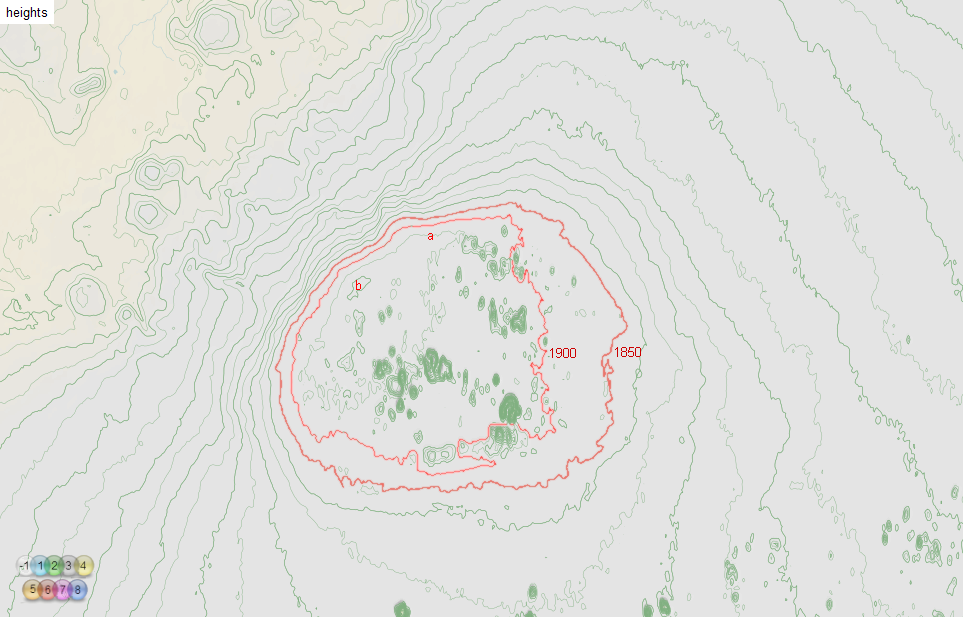
WTH?
anyone have any idea?
larger size of above images available by right clicking and "view image"
unless the OpenCycleMap is just showing Snow/Ice level, not the actual rock level
I want to get the Rim height right, to make another animation based on the first image style
edit: actually the next line out from the red one at 1800m looks even more like the IMO and volcanocafe ones, it shows the lower curve inwards, like a rounded Australia south coast shape
If this is the case then Open Cycle Map is showing that there is (was?) 200 metres of snow/ice piled on top of the caldera floor + whatever depth the caldera is/was as well. Does this stack up (pun) to information regarding the ice cap on top?
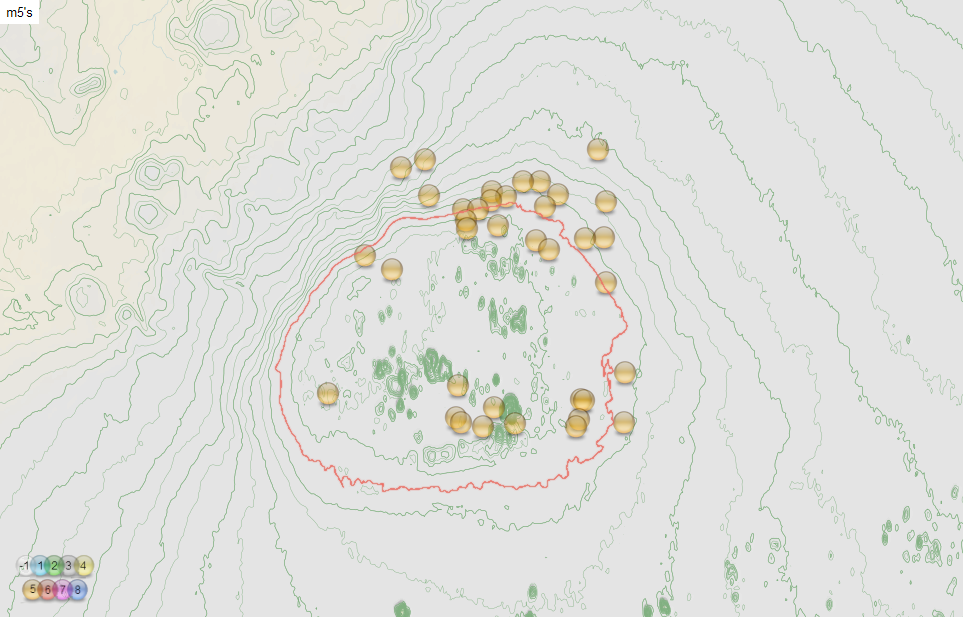
if it is the next line out from the red one (1900m) that would just about match image 3 (3D) in regards the M5's mostly being inside the Rim
mag less than1= 3 , mag1= 34 , mag2= 7 , mag3= 12 , mag4= 7 , mag5= 1
total= 64 , total energy released= 1,314.3135 TTNT
Which brings me to something I have been trying to get my head around since this started
What is the shape of the caldera? where is the Rim?
I'm seeing two shapes on the web that are similar
the IMO one
which I don't get the numbers along the borders, they are weird, they are not "northing" type numbers although they do look that style
a topographical GE overlay that popped up on volcano cafe, which looks similar, and has a 3D effect to it
then there is the topographical map from OpenCycleMap, which shows something else altogether, basically a flat top cone. I have read the height of Bardarbunga is 2000 metres, Open Cycle map shows only a few smaller cones inside the caldera at 2000m, the main top is at 1900, then there is a plateau on the left side ( green outline line marked "a" on my image below is at 1950m, and a the cones also on the left at 2000m (marked "b")
The closest topo match to the first two caldera images above is the 1900m level !!??!
WTH?
anyone have any idea?
larger size of above images available by right clicking and "view image"
unless the OpenCycleMap is just showing Snow/Ice level, not the actual rock level
I want to get the Rim height right, to make another animation based on the first image style
edit on 1000000029329314 by muzzy because: (no reason given)
edit: actually the next line out from the red one at 1800m looks even more like the IMO and volcanocafe ones, it shows the lower curve inwards, like a rounded Australia south coast shape
If this is the case then Open Cycle Map is showing that there is (was?) 200 metres of snow/ice piled on top of the caldera floor + whatever depth the caldera is/was as well. Does this stack up (pun) to information regarding the ice cap on top?
edit on 1000000029329314 by muzzy because: (no
reason given)
if it is the next line out from the red one (1900m) that would just about match image 3 (3D) in regards the M5's mostly being inside the Rim
edit on 1000000029329314 by muzzy because: (no reason given)
Bardarbunga-Holuhraun 2014
looks like most of the posters who were on here in the early part of this have lost interest?
Despite what Institute of Earth Sciences say in their reports' which are pretty lame lately (same old, same old) except for the odd new photo, things are happening.
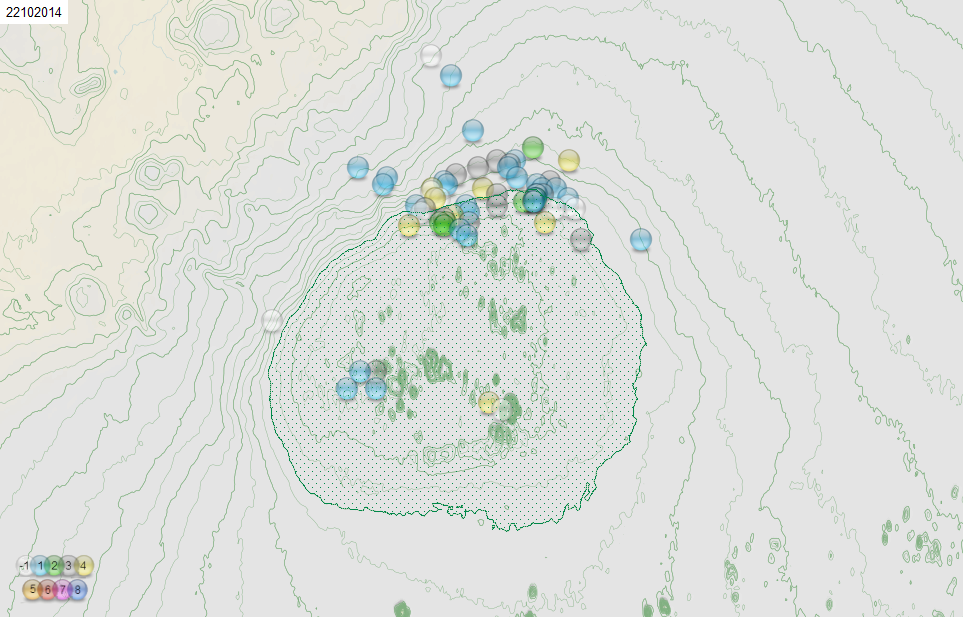
Take 22nd Oct for example.
I was about to spend some time on the Caldera mapping events there (see post above), when boom, Herdubreid-Herdubreidartogl drops a near vertical shaft (within 1.5km radius) of 31 earthquakes in 24 hours from 2.9-12km deep, over the same time period as a similar vertical shaft of quakes at Bardarbunga's caldera's north Rim. Previously 15th-19th there were no recordedearthquake events at all at Herdubreid-Herdubreidartogl
What does this mean?
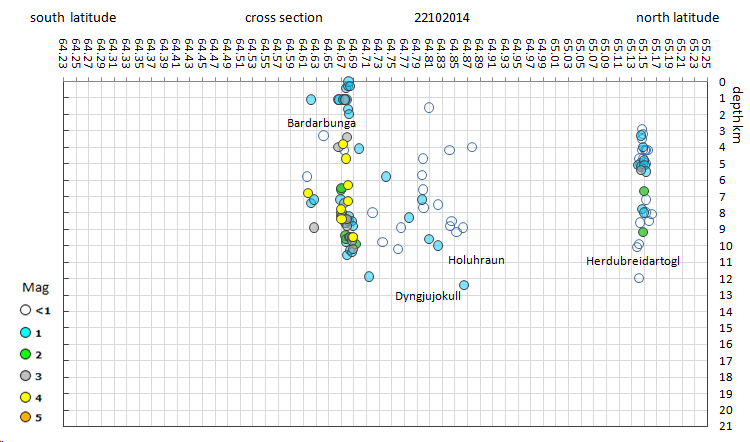
right click, "view image" for full size
looks like most of the posters who were on here in the early part of this have lost interest?
Despite what Institute of Earth Sciences say in their reports' which are pretty lame lately (same old, same old) except for the odd new photo, things are happening.
Take 22nd Oct for example.
I was about to spend some time on the Caldera mapping events there (see post above), when boom, Herdubreid-Herdubreidartogl drops a near vertical shaft (within 1.5km radius) of 31 earthquakes in 24 hours from 2.9-12km deep, over the same time period as a similar vertical shaft of quakes at Bardarbunga's caldera's north Rim. Previously 15th-19th there were no recordedearthquake events at all at Herdubreid-Herdubreidartogl
What does this mean?
right click, "view image" for full size
Long Holiday Weekend here (Labour Day) and its raining now (Friday) so extra long one for me
Will do something with the Caldera mapping
the real shallow quakes seemed to pick up at the north Rim on the 13th Oct
Bardarbunga-Holuhraun depth graphs
Will do something with the Caldera mapping
the real shallow quakes seemed to pick up at the north Rim on the 13th Oct
Bardarbunga-Holuhraun depth graphs
edit on 1000000029529514 by muzzy because: (no reason given)
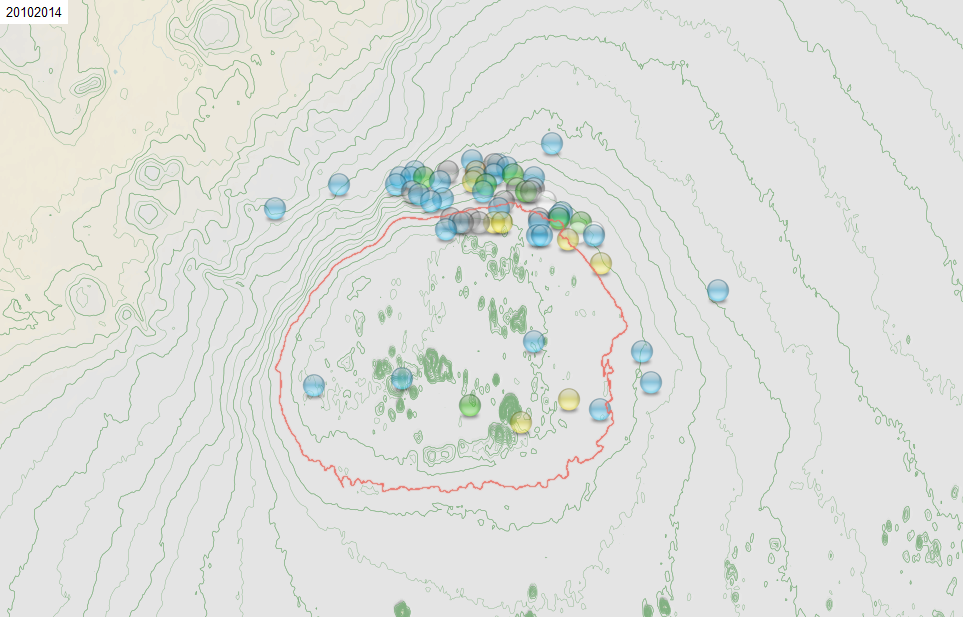
finally settled on a shape for the caldera rim
and here it is on the daily earthquake events map (22nd Oct)
I had to make it so it wasn't too obtrusive over the icons, but still enough to see the outline
 rightclick"viewimage"for fullsize
well that killed an hour and a half trying different things out
and one of that fateful day the volcano spilled its marbles, starting the whole thing off
and here it is on the daily earthquake events map (22nd Oct)
I had to make it so it wasn't too obtrusive over the icons, but still enough to see the outline
well that killed an hour and a half trying different things out
edit on 1000000029529514 by muzzy because: (no reason given)
and one of that fateful day the volcano spilled its marbles, starting the whole thing off
edit on 10u29529514 by muzzy because: (no reason given)
a reply to: muzzy
Although I do not post frequently, I am sure there are numerous posters, like myself, which come here daily for your educated and insightful posts of wisdom. (EIPW's?)
In any case, keep up the good work. It is appreciated.
So long . . . and thanks for all the fish!
Bishop
Although I do not post frequently, I am sure there are numerous posters, like myself, which come here daily for your educated and insightful posts of wisdom. (EIPW's?)
In any case, keep up the good work. It is appreciated.
So long . . . and thanks for all the fish!
Bishop
Thanks Bishop. there are a lot of people covering this, so I just do it my style
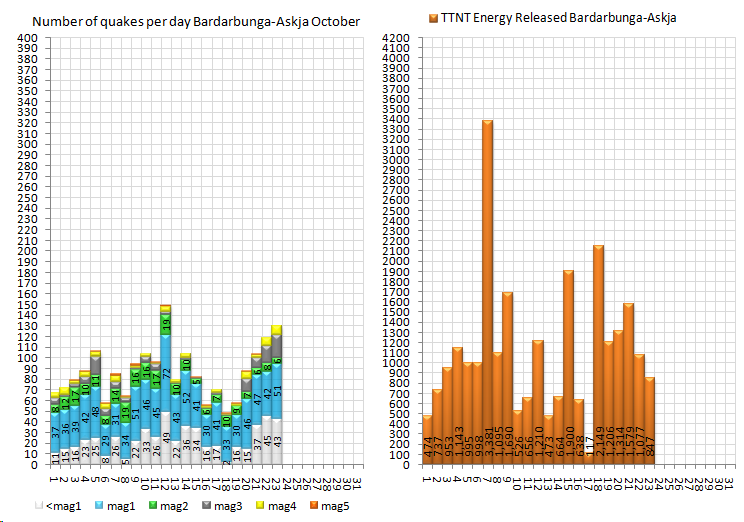
23rd October 2014
more quakes, less energy released (no M5)
mag less than1= 43 , mag1= 51 , mag2= 6 , mag3= 21 , mag4= 9 , mag5= 0
total= 130 , total energy released= 846.5085 TTNT
 rightclick"viewimage"forfullsize
broken down into areas of interest;
Tungnafellsjokull =1
Bardarbunga =78
Dyngjujokull glacier =10
Holuhraun =11
Herdubreid-Herdubreidartogl = 29
Hlaupfell (to the east of Herdubreidartogl) =1
page
caldera animation not far away.
23rd October 2014
more quakes, less energy released (no M5)
mag less than1= 43 , mag1= 51 , mag2= 6 , mag3= 21 , mag4= 9 , mag5= 0
total= 130 , total energy released= 846.5085 TTNT
broken down into areas of interest;
Tungnafellsjokull =1
Bardarbunga =78
Dyngjujokull glacier =10
Holuhraun =11
Herdubreid-Herdubreidartogl = 29
Hlaupfell (to the east of Herdubreidartogl) =1
page
caldera animation not far away.
edit on 10u29629614 by muzzy because: (no reason given)
Here is the latest Bardarbunga Caldera Animation
Note this is only the Cone of Bardarbunga, with the Caldera marked on it, the quakes that veered off to the Holuhraun lava field are not shown, except near the start.
The file is too big (14.4MB) to load to ATS directly, its even too big to optimize and reduce the size on ezgif!
so here it is, I hope it works for you
Some quality has been lost in the conversion from .PNG to .GIF, but I will put the individual daily images on my blog like I did for the last animation.
The North Rim definitely taking the brunt of the activity, right from the start.
Plenty of room left on Google Drive yet, if this goes on into next year, I have only used 0.22GB of 15GB so far
So whats next?
perhaps an animation of the M5's, it might show where the total failure may occur ...............
edit on 1000000029629614 by muzzy because: (no reason given)
originally posted by: muzzy
So whats next?
perhaps an animation of the M5's, it might show where the total failure may occur ...............
seems the little dots within the Caldera border reduce the quality of the whole image when converted to GIF type.
Oh well, I'm not doing it all over again
managed to get the size down on this one 6.75MB
direct link here
Mag 5's in sequence, 43 of them, last one on the 24th.
Likely locations will change over time, I uploaded October this morning and the last M5 of Sept was in the data group, it had changed from 5.12 to 5.45 and location was a bit different too.
edit on 1000000029629614 by muzzy because: (no reason given)
Data by IMO by the way
edit on 1000000029629614 by muzzy because: (no reason given)
new topics
-
BIDEN Admin Begins Planning For January 2025 Transition to a New President - Today is 4.26.2024.
2024 Elections: 4 hours ago -
Big Storms
Fragile Earth: 5 hours ago -
Where should Trump hold his next rally
2024 Elections: 8 hours ago -
Shocking Number of Voters are Open to Committing Election Fraud
US Political Madness: 9 hours ago -
Gov Kristi Noem Shot and Killed "Less Than Worthless Dog" and a 'Smelly Goat
2024 Elections: 10 hours ago -
Falkville Robot-Man
Aliens and UFOs: 10 hours ago -
James O’Keefe: I have evidence that exposes the CIA, and it’s on camera.
Whistle Blowers and Leaked Documents: 10 hours ago -
Australian PM says the quiet part out loud - "free speech is a threat to democratic dicourse"...?!
New World Order: 11 hours ago
top topics
-
James O’Keefe: I have evidence that exposes the CIA, and it’s on camera.
Whistle Blowers and Leaked Documents: 10 hours ago, 17 flags -
Australian PM says the quiet part out loud - "free speech is a threat to democratic dicourse"...?!
New World Order: 11 hours ago, 15 flags -
Blast from the past: ATS Review Podcast, 2006: With All Three Amigos
Member PODcasts: 15 hours ago, 14 flags -
Biden "Happy To Debate Trump"
2024 Elections: 12 hours ago, 13 flags -
Ireland VS Globalists
Social Issues and Civil Unrest: 12 hours ago, 11 flags -
Mike Pinder The Moody Blues R.I.P.
Music: 15 hours ago, 9 flags -
BIDEN Admin Begins Planning For January 2025 Transition to a New President - Today is 4.26.2024.
2024 Elections: 4 hours ago, 8 flags -
What is the white pill?
Philosophy and Metaphysics: 14 hours ago, 6 flags -
Shocking Number of Voters are Open to Committing Election Fraud
US Political Madness: 9 hours ago, 6 flags -
Big Storms
Fragile Earth: 5 hours ago, 6 flags
active topics
-
Falkville Robot-Man
Aliens and UFOs • 10 • : billxam1 -
Gov Kristi Noem Shot and Killed "Less Than Worthless Dog" and a 'Smelly Goat
2024 Elections • 64 • : cherokeetroy -
What is the white pill?
Philosophy and Metaphysics • 23 • : TheDiscoKing -
BIDEN Admin Begins Planning For January 2025 Transition to a New President - Today is 4.26.2024.
2024 Elections • 21 • : worldstarcountry -
University of Texas Instantly Shuts Down Anti Israel Protests
Education and Media • 317 • : CriticalStinker -
Ditching physical money
History • 23 • : worldstarcountry -
Australian PM says the quiet part out loud - "free speech is a threat to democratic dicourse"...?!
New World Order • 9 • : ScarletDarkness -
-@TH3WH17ERABB17- -Q- ---TIME TO SHOW THE WORLD--- -Part- --44--
Dissecting Disinformation • 704 • : 777Vader -
Mood Music Part VI
Music • 3113 • : MRTrismegistus -
One Flame Throwing Robot Dog for Christmas Please!
Weaponry • 12 • : worldstarcountry