It looks like you're using an Ad Blocker.
Please white-list or disable AboveTopSecret.com in your ad-blocking tool.
Thank you.
Some features of ATS will be disabled while you continue to use an ad-blocker.

Volcano Watch 2014
page: 17share:
ok cool. Was waiting to hear whether that lake had risen from the melt water, and apparently it has, so that explains that.
Yeah, those "tremor" plots at the IMO are confusing. The actual webicorder plots show nothing of the sort so far. No tremor or even long period events have occurred that I have seen. And that's why I don't believe an eruption is imminent yet. But that can change in an instant among so much seismic activity.
The only station I have access to for raw seismic data out of Iceland is II.BORG. And it's too far away to really see much other than the largest quakes. If there is low level tremor happening, I don't think BORG would show it (it's too far from the activity). I have written to the IMO twice now for potential access to data from more of their own stations, and haven't even received a response. I can't say I am happy with that, considering I was asking for some specific information that only very experienced people with my type of rig would even know to ask for. Grrr....
Of course if I had access to data from closer stations, I would be able to report on the character of the seismicity- and/or if there were any long period events or real tremor happening...
edit on Thu Aug 28th 2014 by TrueAmerican because: (no reason given)
I can help with your graph frequencies doodle,
The red is 0.5-1.0 Hz
The green is 1-2 Hz
And the blue is 2-4 Hz
The graphs show average vertical movement per minute for each seismometer, in three frequency ranges (Hz)
hraun.vedur.is...
The red is 0.5-1.0 Hz
The green is 1-2 Hz
And the blue is 2-4 Hz
The graphs show average vertical movement per minute for each seismometer, in three frequency ranges (Hz)
hraun.vedur.is...
edit on 28-8-2014 by DAZ21 because: (no reason given)
a reply to: TrueAmerican
Don't feel too badly about not getting access to the Icelandic SIL network. A few days back, I read I twitter comment by a seismology PhD student that the Icelandic data is incredible difficult to get a hold of.
source (on the 26th of August)
Someone else commented that it wasn't just Iceland, but many networks aren't fond of sharing their data.
Don't feel too badly about not getting access to the Icelandic SIL network. A few days back, I read I twitter comment by a seismology PhD student that the Icelandic data is incredible difficult to get a hold of.
Stephen Hicks @seismo_steve · Aug 26
.@pabloj_gonzalez @rudigerescobar @CPPGeophysics But Icelandic seismic data isnt open and is apparently notoriously difficult to get hold of
source (on the 26th of August)
Someone else commented that it wasn't just Iceland, but many networks aren't fond of sharing their data.
a reply to: Olivine
Interesting, and so far I must concur.
But that might explain why magnitudes, and locations, of the larger quakes are so all over the place between emsc, usgs, and IMO. I have a hunch that the usgs and emsc both are only operating at a distance much like we are- using primarily II.BORG. And that's what, some 260 km from the activity?
originally posted by: TrueAmerican
a reply to: Olivine
. I have a hunch that the usgs and emsc both are only operating at a distance much like we are- using primarily II.BORG. And that's what, some 260 km from the activity?
Agreed. For example, the most recent Mag 5.0 in Iceland, USGS gives the value in "mb": teleseismic body wave magnitude.
ETA: I don't know when you started monitoring BORG, but just for reference, when the Mag 5.7 epicentered near Bardarbunga on the 26th, in GEE, it was pushing 600 microns/ sec.
edit on 8/28/2014 by Olivine because: add a reference
vedur2.mogt.is...
I'm watching this slowly update, hitting f5 every 10-20min. It seems like it is melting faster, but that may be me.
The left side is the crater / lagoon, the right looks towards Bardarbung.
I've saved a snapshot and will look at a fresh one in an hour or two to see if it has really changed.
(It is at least emitting steam from the side of it.)
M.
edit on 28-8-2014 by Moshpet because: (no reason given)
a reply to: Olivine
well, my hunch appears to be correct, seeing as going to the scientific portion of the last 5.0 quake at usgs shows that the minimum distance (distance to closest station) is some 195km!
earthquake.usgs.gov...
That right there CONFIRMS that usgs (and probably emsc as well) do not have access to the stations on the SIL network. And if usgs or emsc don't have access, it will be a cold day in hell before anyone like you or me would get it.
It's clear that IMO do not want or need anyone else's help.
I was going to wait longer, but...
This is from Webcams in Kverkfjoll showing the Aska volcano lagoon.
11:18 MST

11:34 MST

ETA: I'm not sure how much of the change of visual appearance is due to shifting daylight, I'll get a dozen of so shots over the next few hours.
This is from Webcams in Kverkfjoll showing the Aska volcano lagoon.
11:18 MST

11:34 MST

ETA: I'm not sure how much of the change of visual appearance is due to shifting daylight, I'll get a dozen of so shots over the next few hours.
edit on 28-8-2014 by Moshpet because: (no reason given)
a reply to: BobAthome
You're funny. It was "approximately" 603.4587 in amplitude, if I recall correctly.
FWIW, Nasa has finally updated their Global Sulfur Dioxide Monitoring pages--they had been stuck on 18 August for many days. No obvious emissions of that particular gas from Iceland, yet.
You're funny. It was "approximately" 603.4587 in amplitude, if I recall correctly.
FWIW, Nasa has finally updated their Global Sulfur Dioxide Monitoring pages--they had been stuck on 18 August for many days. No obvious emissions of that particular gas from Iceland, yet.
edit on
8/28/2014 by Olivine because: del button on this laptop is in the wrong place. My apologies for the continuous goofs.
edit on
8/28/2014 by Olivine because: spelling
a reply to: Doodle19815
Interesting Link RE: Where the water is going--- Lake Grímsvötn
answersingenesis.org...
“As surrounding ice melts, Lake Grímsvötn gradually enlarges over a few years. Ultimately it melts through an ice dam at a low point in the confining landform and drains into a subglacial tunnel. The water usually flows southwards beneath the 8.6-km (5.4 mile)-wide Skeidarár Glacier, discharging at its margin some 50 km (30 miles) away as a mega-flood. The cycle starts again as the lake begins to refill.”
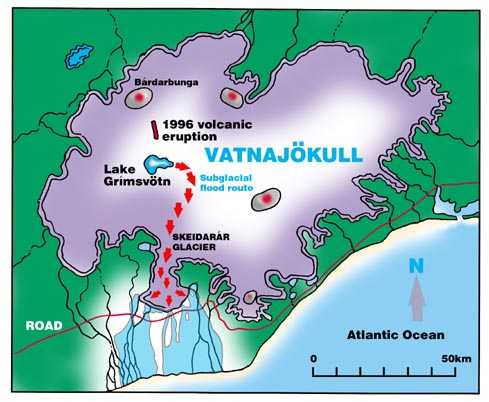
“Icelandic history records about 60 such cataclysms since the Vikings arrived in the ninth century. However, scientists were skeptical of the previous awesome descriptions of fantastic floods. Now that this mega-flood has been observed, many times larger than previously measured, it is considered that these stories are probably true.17
At 55,000 cubic meters (two million cubic feet) per second, Iceland’s deluge was of apocalyptic proportions. It destroyed reinforced-concrete bridges, swept along 1000-tonne blocks of ice, eroded 3-km-wide canyons and dumped 9 meters of sediment over 500 square km. Mercifully, it lasted only two days.”
Here is another link (can’t translate anyone from Iceland help) vmkerfi.vedur.is...
It shows a map which I put to satellite and then focused on the Gígja_800 station.
I put it to graph and it shows an increase in something temp maybe??
Interesting Link RE: Where the water is going--- Lake Grímsvötn
answersingenesis.org...
“As surrounding ice melts, Lake Grímsvötn gradually enlarges over a few years. Ultimately it melts through an ice dam at a low point in the confining landform and drains into a subglacial tunnel. The water usually flows southwards beneath the 8.6-km (5.4 mile)-wide Skeidarár Glacier, discharging at its margin some 50 km (30 miles) away as a mega-flood. The cycle starts again as the lake begins to refill.”
“Icelandic history records about 60 such cataclysms since the Vikings arrived in the ninth century. However, scientists were skeptical of the previous awesome descriptions of fantastic floods. Now that this mega-flood has been observed, many times larger than previously measured, it is considered that these stories are probably true.17
At 55,000 cubic meters (two million cubic feet) per second, Iceland’s deluge was of apocalyptic proportions. It destroyed reinforced-concrete bridges, swept along 1000-tonne blocks of ice, eroded 3-km-wide canyons and dumped 9 meters of sediment over 500 square km. Mercifully, it lasted only two days.”
Here is another link (can’t translate anyone from Iceland help) vmkerfi.vedur.is...
It shows a map which I put to satellite and then focused on the Gígja_800 station.
I put it to graph and it shows an increase in something temp maybe??
a reply to: SeekingDepth
wow built in pressure relief valve,, amazing,,and self plugging,, or fail safe,,
wow built in pressure relief valve,, amazing,,and self plugging,, or fail safe,,
a reply to: Moshpet
No it is not Askja cam !
The cption reads " webcam near Kverkfjöll" and that is on the glacier near Bardarbunga , very far away from Askja. Askja is not ice covered.
Cam is from here Vefmyndavélar í Kverkfjöllum.
No it is not Askja cam !
The cption reads " webcam near Kverkfjöll" and that is on the glacier near Bardarbunga , very far away from Askja. Askja is not ice covered.
edit on 28-8-2014 by egoli because: (no reason given)
Cam is from here Vefmyndavélar í Kverkfjöllum.
edit on 28-8-2014 by egoli
because: (no reason given)
edit on 28-8-2014 by egoli because: (no reason given)
a reply to: SeekingDepth
an increase in something temp maybe,, i would hope that the increase in temperature is going too be compensated for in a controlable manner,, if not only two possibilities exist.
an increase in something temp maybe,, i would hope that the increase in temperature is going too be compensated for in a controlable manner,, if not only two possibilities exist.
hmm, well look at what the pariahs have dragged in:
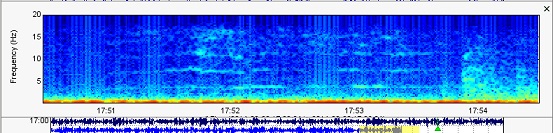
I just picked that up on BORG. Now that could, and probably is noise, but it could also be some of the first signs of real harmonic tremor, as viewed from a station 200 km away. Only the ringing harmonics, and you can see the even order bands, would probably be visible at that distance. So if all of a sudden the IMO makes an alert level change to either volcano, now you might know why.
I just picked that up on BORG. Now that could, and probably is noise, but it could also be some of the first signs of real harmonic tremor, as viewed from a station 200 km away. Only the ringing harmonics, and you can see the even order bands, would probably be visible at that distance. So if all of a sudden the IMO makes an alert level change to either volcano, now you might know why.
Anyone up for some heavy reading?
en.vedur.is...
It is a PDF apparently released today. It has some possibly scenarios and some history info in it.
To everyone - thank you for allowing me to educate myself here at the school of ATS. If I don't respond back to a reply, it is because I don't want to post and clutter up the thread with my few words I would have to offer. I do appreciate all of the responses to my questions.
new topics
-
President BIDEN's FBI Raided Donald Trump's Florida Home for OBAMA-NORTH KOREA Documents.
Political Conspiracies: 11 minutes ago -
Maestro Benedetto
Literature: 1 hours ago -
Is AI Better Than the Hollywood Elite?
Movies: 1 hours ago -
Las Vegas UFO Spotting Teen Traumatized by Demon Creature in Backyard
Aliens and UFOs: 5 hours ago -
2024 Pigeon Forge Rod Run - On the Strip (Video made for you)
Automotive Discussion: 6 hours ago -
Gaza Terrorists Attack US Humanitarian Pier During Construction
Middle East Issues: 6 hours ago -
The functionality of boldening and italics is clunky and no post char limit warning?
ATS Freshman's Forum: 7 hours ago -
Meadows, Giuliani Among 11 Indicted in Arizona in Latest 2020 Election Subversion Case
Mainstream News: 8 hours ago -
Massachusetts Drag Queen Leads Young Kids in Free Palestine Chant
Social Issues and Civil Unrest: 8 hours ago -
Weinstein's conviction overturned
Mainstream News: 9 hours ago
top topics
-
Krystalnacht on today's most elite Universities?
Social Issues and Civil Unrest: 11 hours ago, 9 flags -
Supreme Court Oral Arguments 4.25.2024 - Are PRESIDENTS IMMUNE From Later Being Prosecuted.
Above Politics: 11 hours ago, 8 flags -
University of Texas Instantly Shuts Down Anti Israel Protests
Education and Media: 14 hours ago, 7 flags -
Weinstein's conviction overturned
Mainstream News: 9 hours ago, 7 flags -
Gaza Terrorists Attack US Humanitarian Pier During Construction
Middle East Issues: 6 hours ago, 7 flags -
Massachusetts Drag Queen Leads Young Kids in Free Palestine Chant
Social Issues and Civil Unrest: 8 hours ago, 6 flags -
Meadows, Giuliani Among 11 Indicted in Arizona in Latest 2020 Election Subversion Case
Mainstream News: 8 hours ago, 5 flags -
Las Vegas UFO Spotting Teen Traumatized by Demon Creature in Backyard
Aliens and UFOs: 5 hours ago, 4 flags -
President BIDEN's FBI Raided Donald Trump's Florida Home for OBAMA-NORTH KOREA Documents.
Political Conspiracies: 11 minutes ago, 3 flags -
2024 Pigeon Forge Rod Run - On the Strip (Video made for you)
Automotive Discussion: 6 hours ago, 2 flags
active topics
-
Meadows, Giuliani Among 11 Indicted in Arizona in Latest 2020 Election Subversion Case
Mainstream News • 14 • : WeMustCare -
HORRIBLE !! Russian Soldier Drinking Own Urine To Survive In Battle
World War Three • 44 • : theshadowknows -
University of Texas Instantly Shuts Down Anti Israel Protests
Education and Media • 233 • : DBCowboy -
President BIDEN's FBI Raided Donald Trump's Florida Home for OBAMA-NORTH KOREA Documents.
Political Conspiracies • 0 • : WeMustCare -
God's Righteousness is Greater than Our Wrath
Religion, Faith, And Theology • 31 • : glend -
Post A Funny (T&C Friendly) Pic Part IV: The LOL awakens!
General Chit Chat • 7135 • : underpass61 -
Nearly 70% Of Americans Want Talks To End War In Ukraine
Political Issues • 94 • : Scratchpost -
VP's Secret Service agent brawls with other agents at Andrews
Mainstream News • 62 • : ByeByeAmericanPie -
SETI chief says US has no evidence for alien technology. 'And we never have'
Aliens and UFOs • 72 • : yuppa -
My Poor Avocado Plant.
General Chit Chat • 77 • : JonnyC555