It looks like you're using an Ad Blocker.
Please white-list or disable AboveTopSecret.com in your ad-blocking tool.
Thank you.
Some features of ATS will be disabled while you continue to use an ad-blocker.

Gigantic Sonic Anomaly in South Atlantic and 5.2 Earthquake nearby Ascension Island....
page: 2share:
Let's have a closer look at the mysterious "arrays", shall we ?
So first of all there are 8 sensor arrays from the INFRASOUND project to monitor if some sneaky bastard sets off a nuke some place. CLICK
Then there is the ESA and their terrifying Ariane project. Actually they track the Ariane from Ascension Island. Dude they got some huge arrays, I tell ya.
Then how about the BBC who has huge transmitters there to sling their propaganda half way around the globe, uber huge transmitter arrays for short wave radio and such.
And then there's a dozen military installations, mostly from the Brits, including a military airfield including radar towers, listening posts, microwave communication rtansmitters etc pp.
And the moment the Lady in the video started babbling about a "tower that is miles and miles wide and footballfields high" ( Which is in fact nowhere to be seen on the island ) I knew she had one glass too much moonshine.
Anyways. Was fun checking the island out, but I'm afraid there's neither HAARP transmitters here nor any other huge mystery.
Thanks but are you sure it's all Brits? That's a LOT of military money for the Brits to have financed and I doubt the BBC has the money to sling
their propaganda that particular way, what with the intertubes and all.
And yeah, announcer lady lost me at 'those tracks on the ocean floor' and reciting bible verses. She should know sonar tracings if she's spent any time on Google Earth, and 2000 year old fantasies don't cut it in the conspiracy field.
Interesting that that island is sitting right smack in the middle of both the Atlantic and a fault zone.
Edited to add, after reading the Wiki, the US government indeed has a base there.
And yup, the BBC has an antenna there. Also the 'worst golf course in the world'.
And yeah, announcer lady lost me at 'those tracks on the ocean floor' and reciting bible verses. She should know sonar tracings if she's spent any time on Google Earth, and 2000 year old fantasies don't cut it in the conspiracy field.
Interesting that that island is sitting right smack in the middle of both the Atlantic and a fault zone.
Edited to add, after reading the Wiki, the US government indeed has a base there.
edit on 3-1-2013 by signalfire because: addendum
And yup, the BBC has an antenna there. Also the 'worst golf course in the world'.
edit on 3-1-2013 by signalfire because: (no reason
given)
the screen grab pic in the op is from the 23rd not the 26th.
so the anomaly does not match the earthquake
the lady in the video is clutching at straws
so the anomaly does not match the earthquake
the lady in the video is clutching at straws
Straws indeed, but there are a multiplicity of arrays on a small island for sure....
The South Atlanic anomaly comes to mid...that big hole in the sky?
perhaps theyve added a few research facilities there?
I saw the huge towers alright, but the scale may be exAGGERATED BY THE NARRATOR......
Three in a row oriented Nto S i think.....
Worth a further dig Arken lets keep our eyes peeled for more detail.....
The "Obscurements" are "Clouds". Funny she says in the video when "we" see these obscurements we know they are trying to hide something.
Deny ignorance. Admit this video is full of wrong information.
Deny ignorance. Admit this video is full of wrong information.
reply to post by Mike.Ockizard
This lady is bonkers.
*finally the HAARP word? No, emergency brake in last second to not sound lunatic
Choose your truth:
-MASSIVE STRUCTURE
-sONic wAVes
-frequency
-sonic anomaly
Almost got to my smiley limit this month just because of her.
This lady is bonkers.
...snip...
Why? There was no weather associated with it
-believe it or not-
there wasn´t even clouds getting out of the way of this MASSIVE structure
that was created with ...uh*...
sONic wAVes
this is frequency
this is a sonic anomaly
-all knowing silence-
Here is a stillpicture of it as you see it begins [why not end]
...snip...
*finally the HAARP word? No, emergency brake in last second to not sound lunatic
Choose your truth:
-MASSIVE STRUCTURE
-sONic wAVes
-frequency
-sonic anomaly
Almost got to my smiley limit this month just because of her.
Regarding earlier post - Flight 447 stalled and hit the water. It's pretty conclusive evidence, especially when you read the leaked CVR, that nothing
particularly bizarre happened, just an unfortunate set of events. It's a co-incidence that it's in the same area (very, very roughly though) so why
shouldn't it just be a co-incidence and remind us of the sad fact of Flight 447. But I don't think it goes beyond that personally. If it weren't for
the storms, there might be something more viable...
That said, it (the anomaly) could still be a diamond UFO triggering earthquakes along large fault lines for #s and giggles. Stranger things have happened...
That said, it (the anomaly) could still be a diamond UFO triggering earthquakes along large fault lines for #s and giggles. Stranger things have happened...
edit on 3-1-2013 by markymint because: I wanted to change something
Interesting find OP
I agree that the youtube lady is a little strung out....too much coffee and conspiracy sites.
Anyways I look forward for more info on this, my first thought off the bat was it's a weapon of some kind, it's just habit to think that these days
I agree that the youtube lady is a little strung out....too much coffee and conspiracy sites.
Anyways I look forward for more info on this, my first thought off the bat was it's a weapon of some kind, it's just habit to think that these days
So can someone confirm if I'm reading the site correctly...?
The 'anomaly' is on a map that shows total precipitable water... in other words.... clouds that are potentially going to become rain... or something along those lines.
Now.. given that.. and given that the 'edges' (left and right) of the anomaly seem to meet up with the correct sections of the map.. im guessing its some kind of distortion/glitch.
reply to post by signalfire
There was a bit off a deal done in "81" When the task force was going south to liberate the Falklands,
If i remember correctly,
We let the states take control off the ascension islands in exchange for some fuel and missiles (aledged), As NASA had a large sonar array already there. (and bunkers).
Where the ascension islands used by Nasa as an emergency landing strip for the shuttles ?
If i remember correctly,
We let the states take control off the ascension islands in exchange for some fuel and missiles (aledged), As NASA had a large sonar array already there. (and bunkers).
Where the ascension islands used by Nasa as an emergency landing strip for the shuttles ?
edit on 4-1-2013 by foxhoundone because: spell
reply to post by markymint
Off Topic BUT............................. BOB........!!
He's in your Avatar.....i miss BOB.....
PDUK
Off Topic BUT............................. BOB........!!
He's in your Avatar.....i miss BOB.....
PDUK
The location is one to be watched because (as I have written before) this is the location where the event will happen. Mid Atlantic Ridge off Brazil
first then Africa.
Originally posted by observe50
The location is one to be watched because (as I have written before) this is the location where the event will happen. Mid Atlantic Ridge off Brazil first then Africa.
What event?
2nd
Originally posted by Arken
The "Sonic" Anomaly
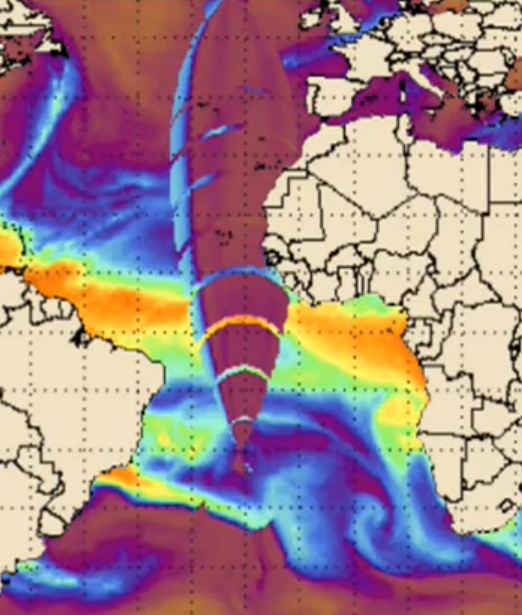
Arken where did this image originate? And what exactly am I looking at? Obviously whatever phenomenon it is, it is globally massive and directed. But without more information I cannot make a good decision on what I am seeing.
reply to post by abeverage
Hi abeverage.
This diagram seem to be the water vapour with different scale of heat.
The image is taken from the YouTube video.
You can find the link of CIMSS in the Opening Post.
Hi abeverage.
This diagram seem to be the water vapour with different scale of heat.
The image is taken from the YouTube video.
You can find the link of CIMSS in the Opening Post.
edit on 4-1-2013 by Arken because: (no reason given)
Originally posted by Arken
reply to post by abeverage
Hi abeverage.
This diagram seem to be the water vapour with different scale of heat.
The image is taken from the YouTube video.
You can find the link of CIMSS in the Opening Post.
edit on 4-1-2013 by Arken because: (no reason given)
I see I want the original LOL
reply to post by Arken
The anomaly in the weather data looks more like an obstruction in just one point of a multiple source system's signal path to me. Most small boat owners will recognize a related effect with their own radar. ...Someone put their hand in front of the faucet by analogy. Could be a plane, a bird or simply the station handling that sector went off line for a while - computers crash. (Global data is a patchwork quilt of signals digitally stitched together, so obstruct one source and you get some funky patterns in the remaining receivers... or the receiver that is lacking its transmitter). Also, note that once data is added to a big picture map the data on these maps does not necessarily originate from the point of origin of the scanning signal... all depends what the main patchwork system is set up to do with the various sources it knits together.
Ascension has been an important British base for a very, very long time. It was the hub of an over-the-horizon-communications system when the British still had an Empire and ruled the seas. It probably remains so today. ...Also how the World Service spoke to that side of the world via relays - I believe the BBC still does that for S America and the S Atlantic.
The World service am broadcast antennas were the most powerful in the world - truly huge - at least they were in the 1970's when I studied them. (Back then if you lived near those transmitters they used to keep your copper central heating pipes warm without turning the heat on).
Many RAF pilots have undertaken the long, unpleasant trip to ascension - as did more than a few British fighting men during the Falklands war. (Pilots invariably end up peeing into bottles on that flight).
If you go on science vacation at one of the Antarctic research bases you often end up with a layover in the Ascensions as one stop on the long way there - bottle emptying stations provided.
Ditto that Brazilian and Portuguese pilots on trips to their own mystery island - which is Trinidade toolserver.org...
Linear patterns on the sea floor in Google maps are more likely to be to do with the GPS grid pattern taken by the vessel making the plot than they are features on the bottom. Similar to a jpeg slowly loading, the more an area is scanned the more information you get - first depth, then seabed detail. Here you are seeing a diamond partial of the latter.
JC
Just read this no connect as yet to it but you never know
US Military Tested 'Tsunami Bomb' As Alternative To Nuclear Weapons
The United States once tried to build a "tsunami bomb" designed to wipe out coastal cities by triggering huge underwater explosions.
The tests were carried out shortly before the end of the second world war off the coast of New Zealand, near to Auckland.
Code-named "Project Seal", the tests reportedly demonstrated that it was possible to create waves 33 feet high with a series of ten explosions.
According to the Telegraph, the operation was intended to create a possible alternative to the nuclear bomb.
In all about 3,700 bombs were set off during the tests, the paper said.
New Zealand author Ray Waru discovered the plans after searching through the country's national archives.
He told the Telegraph that the project was launched in June 1944 after a US naval officer E A Gibson noticed that blasts on coral reefs sometimes created large waves.
While America and New Zealand conducted several tests, the plans were eventually shelved in 1945.
Even so, experiments by the New Zealand government apparently continued until the 1950s - even as experts said that more than 2 million kilograms of explosives would be needed for a successful bomb.
"If you put it in a James Bond movie it would be viewed as fantasy but it was a real thing," Waru told the paper.
And if it sounds far-fetched, remember the US also planned to blow up the Moon. So in comparison, the ocean is nothing major.
Maybe they have started again in the atlantic this time
reply to post by Arken
The same features occur when a Volcano goes off in the air:
One can fathom an earthquake doing the same under the sea.
Nothing peculiar to me.
The same features occur when a Volcano goes off in the air:
One can fathom an earthquake doing the same under the sea.
Nothing peculiar to me.
new topics
-
BIDEN Admin Begins Planning For January 2025 Transition to a New President - Today is 4.26.2024.
2024 Elections: 1 hours ago -
Big Storms
Fragile Earth: 3 hours ago -
Where should Trump hold his next rally
2024 Elections: 6 hours ago -
Shocking Number of Voters are Open to Committing Election Fraud
US Political Madness: 6 hours ago -
Gov Kristi Noem Shot and Killed "Less Than Worthless Dog" and a 'Smelly Goat
2024 Elections: 7 hours ago -
Falkville Robot-Man
Aliens and UFOs: 7 hours ago -
James O’Keefe: I have evidence that exposes the CIA, and it’s on camera.
Whistle Blowers and Leaked Documents: 8 hours ago -
Australian PM says the quiet part out loud - "free speech is a threat to democratic dicourse"...?!
New World Order: 9 hours ago -
Ireland VS Globalists
Social Issues and Civil Unrest: 9 hours ago -
Biden "Happy To Debate Trump"
2024 Elections: 10 hours ago
top topics
-
James O’Keefe: I have evidence that exposes the CIA, and it’s on camera.
Whistle Blowers and Leaked Documents: 8 hours ago, 16 flags -
Australian PM says the quiet part out loud - "free speech is a threat to democratic dicourse"...?!
New World Order: 9 hours ago, 14 flags -
Blast from the past: ATS Review Podcast, 2006: With All Three Amigos
Member PODcasts: 12 hours ago, 13 flags -
Biden "Happy To Debate Trump"
2024 Elections: 10 hours ago, 12 flags -
Mike Pinder The Moody Blues R.I.P.
Music: 12 hours ago, 8 flags -
Ireland VS Globalists
Social Issues and Civil Unrest: 9 hours ago, 6 flags -
What is the white pill?
Philosophy and Metaphysics: 12 hours ago, 6 flags -
Shocking Number of Voters are Open to Committing Election Fraud
US Political Madness: 6 hours ago, 6 flags -
RAAF airbase in Roswell, New Mexico is on fire
Aliens and UFOs: 10 hours ago, 5 flags -
Where should Trump hold his next rally
2024 Elections: 6 hours ago, 5 flags
active topics
-
University of Texas Instantly Shuts Down Anti Israel Protests
Education and Media • 314 • : Schmoe3755 -
BIDEN Admin Begins Planning For January 2025 Transition to a New President - Today is 4.26.2024.
2024 Elections • 10 • : BingoMcGoof -
President BIDEN's FBI Raided Donald Trump's Florida Home for OBAMA-NORTH KOREA Documents.
Political Conspiracies • 39 • : AwakeNotWoke -
Gov Kristi Noem Shot and Killed "Less Than Worthless Dog" and a 'Smelly Goat
2024 Elections • 55 • : AwakeNotWoke -
RAAF airbase in Roswell, New Mexico is on fire
Aliens and UFOs • 10 • : Ophiuchus1 -
Big Storms
Fragile Earth • 13 • : AwakeNotWoke -
SHORT STORY WRITERS CONTEST -- April 2024 -- TIME -- TIME2024
Short Stories • 26 • : Encia22 -
Biden "Happy To Debate Trump"
2024 Elections • 50 • : Lumenari -
Falkville Robot-Man
Aliens and UFOs • 9 • : CosmicFocus -
ALERT - U.S. President JOE BIDEN Examined and Found NOT OF SOUND MIND.
2024 Elections • 65 • : SchrodingersRat