It looks like you're using an Ad Blocker.
Please white-list or disable AboveTopSecret.com in your ad-blocking tool.
Thank you.
Some features of ATS will be disabled while you continue to use an ad-blocker.

Gigantic Sonic Anomaly in South Atlantic and 5.2 Earthquake nearby Ascension Island....
page: 1share:
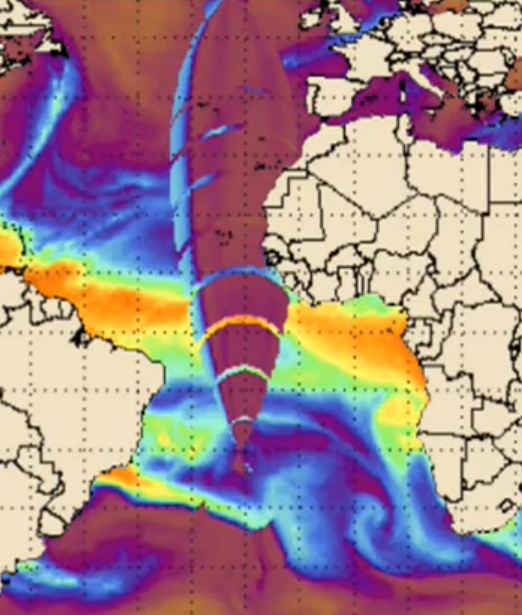
On 26 December 2012 CIMMS "Cooperative Institute for Meteorological Satellite Studies" has detected this
amazing gigantic "sonic" (?) anomaly in South Atlantic Region. What is it, I don't know, but suddenly a 5.2 Earthquake has shaked the South
Atlantic Region, nearby the misterious and heavily militarized... Ascension Island...www.emsc-csem.org...
The "Sonic" Anomaly
Ascension Island Earthquake 5.2
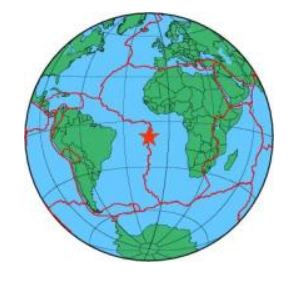
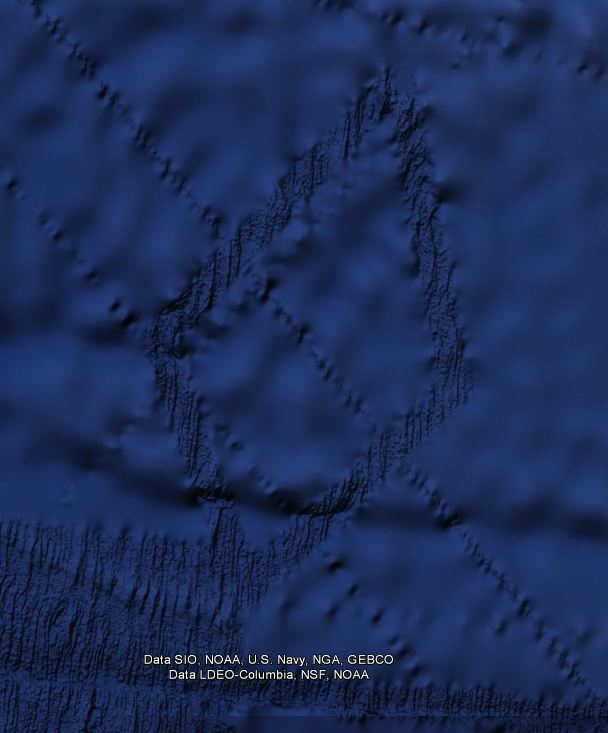
And the source of the anomaly seem located at the bottom of the Atlantic Ocean, in this location.....
A coincidence?
Disclaimer: I do not subscribe all the theories in the YouTube video, however, very interesting.
The "Sonic" Anomaly
Ascension Island Earthquake 5.2
And the source of the anomaly seem located at the bottom of the Atlantic Ocean, in this location.....
A coincidence?
Disclaimer: I do not subscribe all the theories in the YouTube video, however, very interesting.
The island has no name.... besides "Trindade Island".
edit on 3-1-2013 by FraternitasSaturni because: (no reason given)
Originally posted by FraternitasSaturni
The island has no name.... besides "Trindade Island".edit on 3-1-2013 by FraternitasSaturni because: (no reason given)
Exact. The "no name island" in the video is Trinidade.
But the 5.2 Earthquake is near Ascension Island.
edit on 3-1-2013 by Arken because: (no reason given)
It ok
There just practicing target acquisitioning and testing
Just refining it.
There just practicing target acquisitioning and testing
Just refining it.

Originally posted by FraternitasSaturni
The island has no name.... besides "Trindade Island".edit on 3-1-2013 by FraternitasSaturni because: (no reason given)
Trindade island (aka island with no name) is around 800 miles off the South American continent, Brazil and no where near Acension island in relative terms........ Acension island is off towards the African continent around 1250 miles away approx......
the sonic image Arken put up was actually from Acension Island in a very definite direction - interesting...
PDUK
reply to post by PurpleDog UK
ACTUALLY......... i retract my post above.........!!
The sonic image is from the island Trinidade.............. having re-examined maps and locations etc the image emminats alot closer to Trinidade than Acension Island....
sorry
PDUK
ACTUALLY......... i retract my post above.........!!
The sonic image is from the island Trinidade.............. having re-examined maps and locations etc the image emminats alot closer to Trinidade than Acension Island....
sorry
PDUK
The lines on the seafloor are high resolution images of sonar data, propably taken by scientific expeditions for mapping of faultlines or undersea
volcanos etc.
They are not "manmade structures". You can find them anywhere on the Google oceanfloor, and in most cases you can see they follow faultlines, mountain ridges or places with interesting sealife.
They are not "manmade structures". You can find them anywhere on the Google oceanfloor, and in most cases you can see they follow faultlines, mountain ridges or places with interesting sealife.

edit on 3-1-2013 by Mianeye because: (no reason given)
Is that a footprint of some sort of massive "beacon" in the video?
I'm no meteorologist but it seems projection at where hurricanes are born! Northward and all.. as in opposed to being beamed southward.
Reminds me of the Puerto Rico HAARP beam into some hurricane a year or two ago, Irene was it?
SF
I'm no meteorologist but it seems projection at where hurricanes are born! Northward and all.. as in opposed to being beamed southward.
Reminds me of the Puerto Rico HAARP beam into some hurricane a year or two ago, Irene was it?
SF
crakennnn has awake....hehe.. Okay i get serious theread here..this my opinion, please listen....ASK MR.PHAGE
I thing I have read reports some time of UFO sightings by Brazilian air force pilots in the island of Trindade...
Will do some research to see if I can find something...
Will do some research to see if I can find something...
This is quite a catch, both the mystery island and the "sonic anomaly", which can't be debunked outright.
All i can think is "norway spiral" ... but this kind of technology is frightening, more so since we don't know if there were any negative effects?
All i can think is "norway spiral" ... but this kind of technology is frightening, more so since we don't know if there were any negative effects?
I wander if there is any link with this Anomaly in South Atlantic and the disappearance of the Airbus flight 447 Air France...right above Trinidade
Island, off coas of the Brazil.....The Airbus A330 vanished en-route from Rio de Janeiro to Paris on 1 June 2009.
news.bbc.co.uk...
SAME LOCATION
South Atlantic Anomaly
SAME LOCATION
South Atlantic Anomaly
edit on 3-1-2013 by Arken
because: (no reason given)
Could it simply have been a meteorite flashing through the atmosphere? If a fast bullet produces ripples why not a meteorite.
i cant find anywhere on that website that states thats a "sonic" anomaly.
if its anything its an animation anomaly. there are a few in their gif.'s
actually, after looking at the animations, when you click on the 26th it shows a morphed composite for the 22nd, 23rd and 24th.
the anomaly occured on the 23rd not the 26th.
the animation for the 26th is in the animation dated 28th.
so all the animations are for 3 days previous, not the date its filed under
so the earthquake happened 3 days after the "sonic" anomaly
Before we start speculating about the nature of this "anomaly" ( Which looks to be exactly that, a data anomaly ), we may consider finding out what
this coloured map is which is posted in the OP, and which the Lady in the YT video is talking about.
What has it got to do with sonic waves ? It looks like a computer generated simulation of a streaming pattern with temperature levels, yet the OP speaks about "sonic anomaly" and the YT Lady even about an "object".
I don't get this post, can someone enlighten me as to what it is precisely we are looking at here ?
EDIT: I've just watched most of the video and frankly, this Lady has not the slightest idea what she is talking about. Array here array there, doesn't know if the island is US or not .. well maybe she would if she just TURNED ON the darn Labels and Photo Layers in her Google Earth, maybe she would like to check out the Pictures of the mysterious "camp" and all of that stuff. I just did at least. Reading the Wikipedia entry about Ascension island might help, too. Especially when it comes to finding out why there are so many "arrays" ( Some people call them antennas ) on this island. It's blatantly obvious.
edit on 3-1-2013 by H1ght3chHippie because: (no reason given)
Hmmm...
After all, I'm not sure of "sonic"... but maybe..... elecromagnetic......anomaly.
After all, I'm not sure of "sonic"... but maybe..... elecromagnetic......anomaly.
ASCENSION ISLAND????
www.emsc-csem.org...
Doncha just love US government code names?
It's the first time I've noticed, but USGS is in Denver...
www.emsc-csem.org...
Doncha just love US government code names?
It's the first time I've noticed, but USGS is in Denver...
new topics
-
Mike Pinder The Moody Blues R.I.P.
Music: 9 minutes ago -
Putin, Russia and the Great Architects of the Universe
ATS Skunk Works: 3 hours ago -
A Warning to America: 25 Ways the US is Being Destroyed
New World Order: 7 hours ago
top topics
-
President BIDEN's FBI Raided Donald Trump's Florida Home for OBAMA-NORTH KOREA Documents.
Political Conspiracies: 13 hours ago, 31 flags -
A Warning to America: 25 Ways the US is Being Destroyed
New World Order: 7 hours ago, 13 flags -
Is AI Better Than the Hollywood Elite?
Movies: 15 hours ago, 4 flags -
Maestro Benedetto
Literature: 14 hours ago, 1 flags -
Putin, Russia and the Great Architects of the Universe
ATS Skunk Works: 3 hours ago, 1 flags -
Mike Pinder The Moody Blues R.I.P.
Music: 9 minutes ago, 1 flags
active topics
-
Putin, Russia and the Great Architects of the Universe
ATS Skunk Works • 9 • : alldaylong -
Gaza Terrorists Attack US Humanitarian Pier During Construction
Middle East Issues • 52 • : ToneD -
University of Texas Instantly Shuts Down Anti Israel Protests
Education and Media • 274 • : NorthOS -
A Warning to America: 25 Ways the US is Being Destroyed
New World Order • 17 • : TzarChasm -
Mike Pinder The Moody Blues R.I.P.
Music • 0 • : alldaylong -
Nearly 70% Of Americans Want Talks To End War In Ukraine
Political Issues • 97 • : SchrodingersRat -
Chris Christie Wishes Death Upon Trump and Ramaswamy
Politicians & People • 26 • : FlyersFan -
Sol Et Luna - TIME2024
Short Stories • 11 • : Encia22 -
Any one suspicious of fever promotions events, major investor Goldman Sachs card only.
The Gray Area • 11 • : mysterioustranger -
Ode to Artemis
General Chit Chat • 1 • : Encia22