It looks like you're using an Ad Blocker.
Please white-list or disable AboveTopSecret.com in your ad-blocking tool.
Thank you.
Some features of ATS will be disabled while you continue to use an ad-blocker.

Quake Watch 2013
page: 97share:
reply to post by whatnext21
Why would they have it? It is an insignificant quake in an area where there be dragons. They are not interested in the Atlantic, only the Specific which they own.
It appears it was detected in France
Why would they have it? It is an insignificant quake in an area where there be dragons. They are not interested in the Atlantic, only the Specific which they own.
It appears it was detected in France
edit on 31/5/2013 by PuterMan because: (no reason
given)
Where exactly does the figure 496 come from? As far as I can see since the 5.3 there have been 19 events recorded by USGS at the time of writing. I know they do miss a few, but not that many!
If you had read my explanation, then you will see that the 496 should be the number of events (from all regions, all magnitudes) which have occurred within 36 hours of any event designated with the region "South Pacific Ocean" I dont think that is an unreasonable figure do you?
In explaining again, I found a bug so ignore these - they are wrong- I was taking the events prior to the target events not after them ! I will go back and fix and play a little more with this.
So, explaining what I have done in this program again. What I will start by saying is that my database is not complete but it is large enough to give fairly good idea of trends. (USGS events downloaded each day from the 7-day cvs file since about the end of Jan 2009 with some gaps in it after July 2012. Thats quite a bit of data and enough to show any trends. So it is not an official source - OK?
I searched for events with the region "South Pacific Ocean" in my database.
There are two - June 2011 & Jan 2012 both around a M5.2/5.3
2011-06-10 15:32 USGS ref c0004466 (36 hours ends at 2011-06-12 03:32) (180 items selected)
2012-01-25 16:04 USGS ref c0007rer (36 hours ends at 2012-01-27 04:04) (280 items seleted)
Taking the time of the initial South Pacific Ocean(SPO) item, I calculated the offset in time and wrote a record with the region and the time offset to the original SPO record for each event which occurred within that 36 hour window after the SPO event. Then I took the next SPO event and did the same for that. That should give us a total of 180+280=460 records representing a 36-hour window around each of the SPO events
Now we have a list of regions and time offsets from the two SPO events.
I next whip through the file and slice the 36-hours into convenient time slots of arbitarily 43 minutes each slice and count how many records fall into this time slot.
I may have other errors too, it was done without too much planning, so it is a WIP.
edit on 31 May 2013 by qmantoo because: (no reason
given)
Originally posted by muzzy
Technical Fault? or Mag 9.0 Karori, NZ
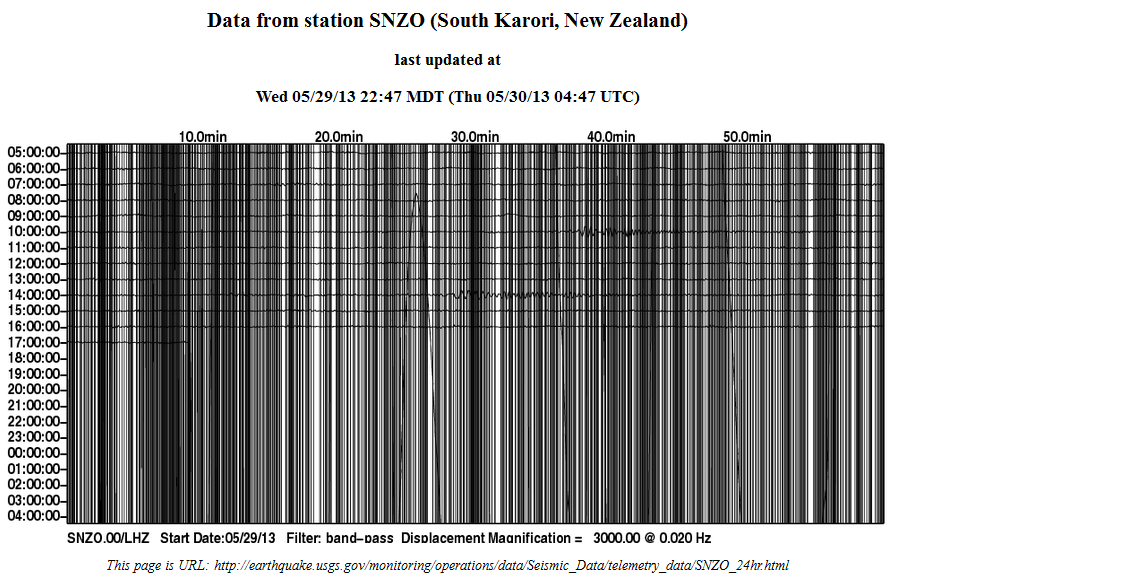
This reminded me of those bar code thingys
maybe it was aliens trying to communicate with us
so I bar coded "muzzy"
www.barcodesinc.com...
this is the result

to check if it was legit I used the online
www.onlinebarcodereader.com...
cool
I am not a free man, I am a barcode
FTNITK: reference is to the TV show The Prisoner where he said "I am not a number, I am a free man"
edit on 31-5-2013 by muzzy because: I feel
a new avatar coming on
edit on 31-5-2013 by muzzy because: done!!
The Mummies are stirring
www.emsc-csem.org...
Don't see those so often.
www.emsc-csem.org...
Magnitude M 4.9
Region EGYPT
Date time 2013-06-01 11:49:33.0 UTC
Location 28.61 N ; 33.82 E
Depth 2 km
Distances 297 km SE of Cairo, Egypt / pop: 7,734,614 / local time: 14:49:33.0 2013-06-01
45 km NE of Tor, Egypt / pop: 14,972 / local time: 14:49:33.0 2013-06-01
Don't see those so often.
reply to post by qmantoo
Unlike some on ATS I DO read the posts before responding, and as to whether it is a reasonable figure or not I can't say as I don't understand what you are doing. All I am trying to do is to reproduce your data so I understand your theory.
OK. We have established the source. (BTW if you tell me your CSV import format - i.e. what fields you end up with - I can replace your missing data for you. I would also add that if you were to use the QVSData program with the service running then you would have no gaps provided you log on to your computer at least once every 6 days.)
OK maybe this is where my confusion came in. I thought we were talking about the recent one.
This was why I could not understand how you got so many events, when I counted only 19. So now that I understand which event(s) we are discussing I can reproduce the data if I get time.
Please correct me if I am wrong but what I am assuming here is that you are looking for ever decreasing numbers of earthquakes back to 'normal' as the 'resonance' subsides in the time following the event. Given that in any period of 36 hours there is likely to be 5 or 6 magnitude 5 or greater earthquakes how do you distinguish resonance from each earthquake, in other words let us say an event occurs at 2013-05-31 13:34:23 which is ~28 minutes after earthquake A, and ~9 minutes after earthquake B to which does the resonance belong? Both fall within your initial time slice.
Event: 2013-05-31 13:34:23, 33.470, -116.475, 1.4, 2.6, 20Km Ese Of Anza. California
The distance to the minor resonant event is ~9,885 km from Vanuatu and ~9,469 km from Raoul making it marginally closer to the later quake. Should one then discount it from the data of the earlier quake?
Given the attenuation of the seismic signals, and in particular we are I am assuming looking at surface waves here (?), do you consider that a Magnitude 5.2 earthquake would have any motion effect on an area nearly 10,000 kilometres away? I accept that the surface waves from a great earthquake (8+) will indeed cause motion in virtually all areas of the world, so what I am trying to establish is do you have a distance parameter in addition to the time, the distance parameter being conditional on the energy release of the earthquake?
Just a point for you to consider is that it is accepted that earthquakes can trigger up to 600km distant. Whether I give credence to the suggestion that great earthquakes have any effect greater than the daily Earth tides I have not decided yet.
I do think that you need to give careful consideration to distance before proceeding too far down this route.
Just my observations.
If you had read my explanation, then you will see that the 496 should be the number of events (from all regions, all magnitudes) which have occurred within 36 hours of any event designated with the region "South Pacific Ocean" I dont think that is an unreasonable figure do you?
Unlike some on ATS I DO read the posts before responding, and as to whether it is a reasonable figure or not I can't say as I don't understand what you are doing. All I am trying to do is to reproduce your data so I understand your theory.
So, explaining what I have done in this program again. What I will start by saying is that my database is not complete but it is large enough to give fairly good idea of trends. (USGS events downloaded each day from the 7-day cvs file since about the end of Jan 2009 with some gaps in it after July 2012. Thats quite a bit of data and enough to show any trends. So it is not an official source - OK?
OK. We have established the source. (BTW if you tell me your CSV import format - i.e. what fields you end up with - I can replace your missing data for you. I would also add that if you were to use the QVSData program with the service running then you would have no gaps provided you log on to your computer at least once every 6 days.)
I searched for events with the region "South Pacific Ocean" in my database.
There are two - June 2011 & Jan 2012 both around a M5.2/5.3
2011-06-10 15:32 USGS ref c0004466 (36 hours ends at 2011-06-12 03:32) (180 items selected)
2012-01-25 16:04 USGS ref c0007rer (36 hours ends at 2012-01-27 04:04) (280 items seleted)
OK maybe this is where my confusion came in. I thought we were talking about the recent one.
Prov,Date/Time UTC,Latitude,Longitude,Magnitude,Depth(Km),Location
emsc,2013-05-31 11:11:11, -6.707, -122.246, 5.3, 33.0, South Pacific Ocean
usgs,2013-05-31 11:11:09, -6.474, -122.120, 5.3, 10.0, South Pacific Ocean
gfzp,2013-05-31 11:11:09, -6.560, -122.110, 5.0, 10.0, South Pacific Ocean
This was why I could not understand how you got so many events, when I counted only 19. So now that I understand which event(s) we are discussing I can reproduce the data if I get time.
Please correct me if I am wrong but what I am assuming here is that you are looking for ever decreasing numbers of earthquakes back to 'normal' as the 'resonance' subsides in the time following the event. Given that in any period of 36 hours there is likely to be 5 or 6 magnitude 5 or greater earthquakes how do you distinguish resonance from each earthquake, in other words let us say an event occurs at 2013-05-31 13:34:23 which is ~28 minutes after earthquake A, and ~9 minutes after earthquake B to which does the resonance belong? Both fall within your initial time slice.
Event: 2013-05-31 13:34:23, 33.470, -116.475, 1.4, 2.6, 20Km Ese Of Anza. California
Prov,Date/Time UTC,Latitude,Longitude,Magnitude,Depth(Km),Location
A. usgs,2013-05-31 13:06:50, -20.307, 169.024, 5.1, 34.0, 87Km Ssw Of Isangel. Vanuatu
B. usgs,2013-05-31 13:25:55, -28.275, -178.602, 5.2, 262.9, 129Km Nnw Of Raoul Island. Nz
The distance to the minor resonant event is ~9,885 km from Vanuatu and ~9,469 km from Raoul making it marginally closer to the later quake. Should one then discount it from the data of the earlier quake?
Given the attenuation of the seismic signals, and in particular we are I am assuming looking at surface waves here (?), do you consider that a Magnitude 5.2 earthquake would have any motion effect on an area nearly 10,000 kilometres away? I accept that the surface waves from a great earthquake (8+) will indeed cause motion in virtually all areas of the world, so what I am trying to establish is do you have a distance parameter in addition to the time, the distance parameter being conditional on the energy release of the earthquake?
Just a point for you to consider is that it is accepted that earthquakes can trigger up to 600km distant. Whether I give credence to the suggestion that great earthquakes have any effect greater than the daily Earth tides I have not decided yet.
I do think that you need to give careful consideration to distance before proceeding too far down this route.
Just my observations.
edit on 1/6/2013 by PuterMan because: Green decoration was required.
Originally posted by PuterMan
The Mummies are stirring
www.emsc-csem.org...
Magnitude M 4.9
Region EGYPT
Date time 2013-06-01 11:49:33.0 UTC
Location 28.61 N ; 33.82 E
Depth 2 km
Distances 297 km SE of Cairo, Egypt / pop: 7,734,614 / local time: 14:49:33.0 2013-06-01
45 km NE of Tor, Egypt / pop: 14,972 / local time: 14:49:33.0 2013-06-01
Don't see those so often.
Indeed you don't .
has changed location and been downgraded a decimal point (or changed mag. type), now on the eastern Gulf of Suez
Magnitude mb 4.8
Region EGYPT
Date time 2013-06-01 11:49:28.0 UTC
Location 28.40 N ; 33.39 E
Heres a map of Egypt 2012 events, there are so few earthquakes there I did the whole year rather than the normal monthly feature on my eqarchives blog.
The National Research Institute of Astronomy and Geophysics (NRIAG) earthquake page went offline early this year so I stopped at Dec 31st 2012, I see they are now back on.
They have it at 5.2ML offshore Ras Ghareb
www.nriag.sci.eg...
historically back near the original location that emsc had near St Catherine
Date Time: 1312/5/1
Lat/Long: 28.5, 34
Depth: 10
Mag: 6.7
Utsu's Egypt 92BC-1996AD
love the area, I spent a month in Hurghada 154km to the south in 1981, long before it became a tourist spot, desert meets clear blue sea, went through one of those massive sand storms when I was heading back to Cairo was a dark as night in the middle of the day.
edit on 1-6-2013 by muzzy because: add Utsu's historical data link
Magnitude 6+ earthquakes downgraded: 2
Magnitude 5 or 6+ earthquakes upgraded: 0
------------------------------------------------------------------
Downgraded quake
mag=5.7|place=122km SE of Petropavlovsk-Kamchatskiy. Russia
|time=1369112377400|updated=1369827253103
|tz=660|url=http://earthquake.usgs.gov/earthquakes/eventpage/usb000h0hd
|felt=0|cdi=1|mmi=4.41|alert=green|status=REVIEWED|tsunami=null|sig=500
|net=us|code=b000h0hd|ids=.usb000h0hd.|sources=.us.
Collected by the QVSData program
In English the times above are:
UNIX time 1369112377 is 05/21/2013 4:59am GMT.
UNIX time 1369827253 is 05/29/2013 11:34am GMT.
Downgraded quake
mag=6.4|place=Off the coast of Aisen. Chile
|time=1369043344300|updated=1369740406968
|tz=-300|url=http://earthquake.usgs.gov/earthquakes/eventpage/usb000gzlm
|felt=0|cdi=1|mmi=6.63|alert=green|status=REVIEWED|tsunami=1|sig=630|net=us
|code=b000gzlm|ids=.pt13140000.at00mn3clq.usb000gzlm.|sources=.pt.at.us.
Log closed 214313
The ones above this in English are:
UNIX time 1369043344 is 05/20/2013 9:49am GMT.
UNIX time 1369740406 is 05/28/2013 11:26am GMT.
Times were converted using soft.zoneo.net...
If you want to try it yourself leave the last 3 digits off as that is the thousandths of a second and is not compatible with the routine.
If you forget and leave the last three on you get
UNIX time 1369740406968 is 05/06/45375 10:22pm GMT.
So both of these were amended as soon as they got to 8 days - as usual. Again I shake my head and ask why?
Of the Kamchatka quake on my blog I said "Note: The earlier quake will be reduced below Mag 6 so is not included.". If I can tell a day after the event this is going to happen why can't USGS?
edit on 1/6/2013 by PuterMan because: (no reason given)
PuterMan - Thanks for your replies. I have kind-of stopped following earthquakes now (although I do still collect the data when I am at my computer)
and I have moved onto another project.
The idea of one eq in one area having a 'resonance' with another at a different location appealed to me and so I dug into my old php programs to see if there was a way to illustrate this in some way. I do think that there may be some correllation between areas but it gets into woo-woo land and tree-huggers territory which does not satisfy the scientist element on here. That being said, distance would not have anything to do with a natural Earth resonace but if it is needed to show something scientifically then so be it.
The csv text files I get from here ( earthquake.usgs.gov... ) which have the fields
Src,Eqid,Version,Datetime,Lat,Lon,Magnitude,Depth,NST,Region
for example
ci,14896484,2,"Sunday, December 12, 2010 23:23:20 UTC",33.3040,-116.4130,1.0,11.70,22, "Southern California"
I am not really sure if it is worth persuing this idea much more and I have a feeling that, as well as distance accounted for, smaller events may need to be filtered out of the initial selection as they may not be large enough to show some significance (although if there IS a correllation, then it will be at all magnitudes since the Earth probably does not 'care' about sizes. So you see, it is getting into the tree-huggers area which may stop you or other scientists trying to prove a link.)
The resonance idea may go someway to explain for events in remote areas of the earth - such as the recent ones in the Pacific Ocean. These do not appear to be connected to any particular reason and a resonance correllation to another area which was having stresses might just account for them.
What I was looking for in the data was the same areas appearing to have an eq after a 'trigger' event in the source area. On the down side, I can see how Southern California has so many smallish events that it would be easy to associate this area with many source events, but it is the other, less active areas which I was looking for in the data to try to find this link I suspected might be there. It is only by analysing many such area thet we might be able to see a pattern emerging. However, one area has many regions associated with it. For example Japan has 23 or so regions which mention 'Japan' in their descriptions and so any USGS-defined region will have other near-by regions which may have to be pulled into the calculation. An event near the side of one region may be missed because it does not fall into a selection criteria which is man-made and defined by us.
I have developed routines which pull in other regions surrounding the source region and expand the area-of-interest to become much larger. By going through the event file and pulling out the Long/Lat I can see just how large an area-on-the-ground the USGS regions really are. I have not got around to marking these on a map with a rectangle but it would be useful to see a definitive image of these regions as defined by USGS.
The whole idea might need to be investigated by a university which has the time, resources, and inclination to spend on this.
Just had a big "re-structuring" of eqarchives.
The seperate blogs I created for Chile, Italy and Turkey have been a flop.
They are all fired (sacked)
Visits since creation earlier this year
Chile [11]
Italy [36]
Turkey [14]
Very disappointing, almost pathetic
The idea was that I could fit more years in that way, but now that I have figured out how the menu system works on Wordpress I can put individual pages for each year on one blog and use the drop down tabs along the top of the (eqarchive) page to provide the links to previous years maps.
Each page should have 12 monthly maps, which in the case of Turkey and Greece is about 24,000 icons (events) to load on when each page is opened, that is about enough for most broadband connections to handle these days.
All the data (maps) I had on those 3 blogs have been transferred to eqarchives now.
The Japan daily blog lives for another day with [151] hits, I've spent too much time on that to transfer it now.
Need to get these all up to date, end of May already.
reply to post by qmantoo
If USGS are using anything else than the Flinn-Engdahl_regions then they are on their own with that.
Here is a map in pdf format that shows the rectangles of each area, pdf
P'man is working his way through converting into KML files for Google Earth, which will have the lat/long parameters.
ETA: I forgot I did some work on the Japan Regions myself.
2 versions
coloured
lined
you can copy and paste the addresses in the Google Maps Search bar into your browser address box if you want to get it into Google Earth.
Good luck with filtering USGS's lat/longs into those shapes
edit on 1-6-2013 by muzzy because: (no reason given)
M6.5 - 25km SE of Buli, Taiwan
2013-06-02 05:43:03 UTC
Event Time
2013-06-02 05:43:03 UTC
2013-06-02 13:43:03 UTC+08:00 at epicenter
2013-06-02 01:43:03 UTC-04:00 system time
Location
23.792°N 121.135°E depth=14.4km (8.9mi)
Nearby Cities
25km (16mi) SE of Buli, Taiwan
39km (24mi) E of Lugu, Taiwan
49km (30mi) ESE of Nantou, Taiwan
49km (30mi) ESE of Zhongxing New Village, Taiwan
734km (456mi) ENE of Hong Kong, Hong Kong
2013-06-02 05:43:03 UTC
Event Time
2013-06-02 05:43:03 UTC
2013-06-02 13:43:03 UTC+08:00 at epicenter
2013-06-02 01:43:03 UTC-04:00 system time
Location
23.792°N 121.135°E depth=14.4km (8.9mi)
Nearby Cities
25km (16mi) SE of Buli, Taiwan
39km (24mi) E of Lugu, Taiwan
49km (30mi) ESE of Nantou, Taiwan
49km (30mi) ESE of Zhongxing New Village, Taiwan
734km (456mi) ENE of Hong Kong, Hong Kong
reply to post by kennvideo
downgraded to 6.2 already an hour later, or is that just the conversion from M to Mww (whatever type of Mw that is, Moment wobbly-wobbly???) Glossary
China Earthquake Networks have
downgraded to 6.2 already an hour later, or is that just the conversion from M to Mww (whatever type of Mw that is, Moment wobbly-wobbly???) Glossary
China Earthquake Networks have
2013-06-02 13:43:03.2 23.9 120.9 9 Ms6.7 Nantou County, Taiwan
edit on 2-6-2013 by muzzy because: (no reason given)
reply to post by muzzy
Very Strong dangerous earthquake below Taiwan – 1 person killed and many people injured by rockfall
Source
reply to post by qmantoo
I hug trees! I give my Rowans and other trees a stroke, and I talk to most of them. I always apologise for trimming the Thuja and the other hedges. I do have a running battle with the sally trees (Willow - also known as Goat Willow - Saileach Dubh - the black willow or black sally.). Caring about Gaia does not preclude science. Despite my enmity towards the black sally which seeds everywhere and even grows in the gutters of the house I love this song
or a slightly softer version by Orla Fallon
As I have said before on the Quake Watch threads one should be prepared to look at ALL science and evaluate ALL ideas and not stick to what ever the current flavour is in the House of Geology, or whatever your science is.
In the history of mankind no leap forward was ever made by people sticking to dogma.
So you see, it is getting into the tree-huggers area which may stop you or other scientists trying to prove a link.
I hug trees! I give my Rowans and other trees a stroke, and I talk to most of them. I always apologise for trimming the Thuja and the other hedges. I do have a running battle with the sally trees (Willow - also known as Goat Willow - Saileach Dubh - the black willow or black sally.). Caring about Gaia does not preclude science. Despite my enmity towards the black sally which seeds everywhere and even grows in the gutters of the house I love this song
or a slightly softer version by Orla Fallon
As I have said before on the Quake Watch threads one should be prepared to look at ALL science and evaluate ALL ideas and not stick to what ever the current flavour is in the House of Geology, or whatever your science is.
In the history of mankind no leap forward was ever made by people sticking to dogma.
edit on 2/6/2013 by PuterMan because: Green tree hugging decoration seemed appropriate
reply to post by muzzy
Married White Woman, but if you are talking about magnetic storage then Magnetic Write Width. Perhaps for earthquakes it is My Word a Whopper.
Being serious for moment however I would make this assumption......................I believe I am correct in saying that:
Mwp = Mw calculated on the first seconds of the P wave arrival
Mwb = Mw calculated on the first seconds of the body wave arrival
By that logic Mww would be calculated on the W Phase and I have no doubt you are aware that USGS give Centroid tensor, Body wave tensors and WPhase tensors for most large quakes. This Mww will be a later calculation than Mwp for example which is the first few seconds of P wave arrival and sort of equivalent to mb in terms of it's origin in the signal.
reply to post by PuterMan
Thanks for the explanation, yeah have seen it before, but it doesn't seem too common.
So its mainly for extra large quakes and is a quick result method then.
It seems to get more complicated the more you look into it all.
Thanks for the explanation, yeah have seen it before, but it doesn't seem too common.
So its mainly for extra large quakes and is a quick result method then.
It seems to get more complicated the more you look into it all.
reply to post by muzzy
Useless make it more complicated, but I suppose if you were a purist you might say more accurate, but at the end of the day the full Mw calculation is what should eventually be published.
Now here is a curious one. ONLY Useless upgraded this quake to 6.0 Mw
Magnitude 6.0 near the east coast of Honshu. Japan 17-Apr-13 and I noted that on my page. On checking against the ANSS catalogue today as I do after a month has passed, I find that it was NOT upgraded in the ANSS catalogue. You will find the links to GFZ and EMSC on my page.
Also, if my memory serves me right, I believe you were talking about a double hit in the Kermedecs?
ANSS now has that
Source: ANSS Catalog Search
Just to be fair to Useless I looked back on my own data and discovered that USGS did add that second quake some time during the 30 days after the original event.
Much stick is given to USGS but in this instance they did better then EMSC or GFZ, neither of which have posted the second quake. for USGS this time. for the others.
Useless make it more complicated, but I suppose if you were a purist you might say more accurate, but at the end of the day the full Mw calculation is what should eventually be published.
Now here is a curious one. ONLY Useless upgraded this quake to 6.0 Mw
Magnitude 6.0 near the east coast of Honshu. Japan 17-Apr-13 and I noted that on my page. On checking against the ANSS catalogue today as I do after a month has passed, I find that it was NOT upgraded in the ANSS catalogue. You will find the links to GFZ and EMSC on my page.
Also, if my memory serves me right, I believe you were talking about a double hit in the Kermedecs?
ANSS now has that
DateTime,Latitude,Longitude,Depth,Magnitude,MagType,NbStations,Gap,Distance,RMS,Source,EventID
2013/04/26 06:53:28.95,-28.7357,-178.9155,349.02,6.20,Mw,112,22,1,1.32,NEI,2013042620
2013/04/26 06:53:28.90,-28.6810,-178.9160,351.00,6.10,Mw,386,14,1,0.94,NEI,2013042620
Source: ANSS Catalog Search
edit on 2/6/2013 by PuterMan because: To remove some weirdness that had infiltrated my text
Just to be fair to Useless I looked back on my own data and discovered that USGS did add that second quake some time during the 30 days after the original event.
Much stick is given to USGS but in this instance they did better then EMSC or GFZ, neither of which have posted the second quake. for USGS this time. for the others.
edit on 2/6/2013 by PuterMan because: to add more information
reply to post by PuterMan
Isn't Kermadec a duplicate?
A likely confusion with ANSS is own event IDs and in doing, loss in translation of original sourced USGS event IDs us2013plai usb000gg01
Duplicate suspicion is from incompleteness for us2013plai with 6.1 generic Mw type and no tensors
Tensors and all else are under usb000gg01, preferred official magnitude 6.2 Mwc, Centroid Mw
comcat.cr.usgs.gov/earthquakes/eventpage/us2013plai
comcat.cr.usgs.gov/earthquakes/eventpage/usb000gg01
new topics
-
President BIDEN's FBI Raided Donald Trump's Florida Home for OBAMA-NORTH KOREA Documents.
Political Conspiracies: 18 minutes ago -
Maestro Benedetto
Literature: 1 hours ago -
Is AI Better Than the Hollywood Elite?
Movies: 2 hours ago -
Las Vegas UFO Spotting Teen Traumatized by Demon Creature in Backyard
Aliens and UFOs: 5 hours ago -
2024 Pigeon Forge Rod Run - On the Strip (Video made for you)
Automotive Discussion: 6 hours ago -
Gaza Terrorists Attack US Humanitarian Pier During Construction
Middle East Issues: 6 hours ago -
The functionality of boldening and italics is clunky and no post char limit warning?
ATS Freshman's Forum: 7 hours ago -
Meadows, Giuliani Among 11 Indicted in Arizona in Latest 2020 Election Subversion Case
Mainstream News: 8 hours ago -
Massachusetts Drag Queen Leads Young Kids in Free Palestine Chant
Social Issues and Civil Unrest: 8 hours ago -
Weinstein's conviction overturned
Mainstream News: 9 hours ago
top topics
-
Krystalnacht on today's most elite Universities?
Social Issues and Civil Unrest: 11 hours ago, 9 flags -
Supreme Court Oral Arguments 4.25.2024 - Are PRESIDENTS IMMUNE From Later Being Prosecuted.
Above Politics: 11 hours ago, 8 flags -
University of Texas Instantly Shuts Down Anti Israel Protests
Education and Media: 14 hours ago, 7 flags -
Weinstein's conviction overturned
Mainstream News: 9 hours ago, 7 flags -
Gaza Terrorists Attack US Humanitarian Pier During Construction
Middle East Issues: 6 hours ago, 7 flags -
Massachusetts Drag Queen Leads Young Kids in Free Palestine Chant
Social Issues and Civil Unrest: 8 hours ago, 6 flags -
Meadows, Giuliani Among 11 Indicted in Arizona in Latest 2020 Election Subversion Case
Mainstream News: 8 hours ago, 5 flags -
Las Vegas UFO Spotting Teen Traumatized by Demon Creature in Backyard
Aliens and UFOs: 5 hours ago, 4 flags -
President BIDEN's FBI Raided Donald Trump's Florida Home for OBAMA-NORTH KOREA Documents.
Political Conspiracies: 18 minutes ago, 3 flags -
2024 Pigeon Forge Rod Run - On the Strip (Video made for you)
Automotive Discussion: 6 hours ago, 2 flags
active topics
-
University of Texas Instantly Shuts Down Anti Israel Protests
Education and Media • 234 • : cherokeetroy -
Nearly 70% Of Americans Want Talks To End War In Ukraine
Political Issues • 95 • : Irishhaf -
Sunak spinning the sickness figures
Other Current Events • 23 • : NoCorruptionAllowed -
Meadows, Giuliani Among 11 Indicted in Arizona in Latest 2020 Election Subversion Case
Mainstream News • 14 • : WeMustCare -
HORRIBLE !! Russian Soldier Drinking Own Urine To Survive In Battle
World War Three • 44 • : theshadowknows -
President BIDEN's FBI Raided Donald Trump's Florida Home for OBAMA-NORTH KOREA Documents.
Political Conspiracies • 0 • : WeMustCare -
God's Righteousness is Greater than Our Wrath
Religion, Faith, And Theology • 31 • : glend -
Post A Funny (T&C Friendly) Pic Part IV: The LOL awakens!
General Chit Chat • 7135 • : underpass61 -
VP's Secret Service agent brawls with other agents at Andrews
Mainstream News • 62 • : ByeByeAmericanPie -
SETI chief says US has no evidence for alien technology. 'And we never have'
Aliens and UFOs • 72 • : yuppa