It looks like you're using an Ad Blocker.
Please white-list or disable AboveTopSecret.com in your ad-blocking tool.
Thank you.
Some features of ATS will be disabled while you continue to use an ad-blocker.

Quake Watch 2013
page: 79share:
reply to post by muzzy
Thanks Muzzy for checking on the numbers. The article states that there were no earthquakes larger than 6.5 after the triggered ones six days after the event. So, I don't think you can include the 17th of April. But even so, there is still 3. For example there was a 6.6 on the 21st of April. So, you are right and maybe you should email Fred directly and ask. Maybe he was misquoted?
There was a lull afterward.
And thanks for adding the Japanese numbers, I was curious about that as well.
Magnitude 6+ earthquakes downgraded: 1
Magnitude 5 or 6+ earthquakes upgraded: 1
------------------------------------------------------------------
Downgraded quake
mag=7.7|place=83km E of Khash.
earthquake.usgs.gov...
------------------------------------------------------------------
Upgraded quake
mag=6|place=14km ENE of Ishinomaki. earthquake.usgs.gov...
Log closed 235805
------------------------------------------------------------------
source QVSData
Re the upgraded one GFZ has 5.9, EMSC has 5.9 and JMA has 5.8.
edit on 25/4/2013 by PuterMan because: (no reason given)
edit on 25/4/2013 by PuterMan because: (no reason given)
reply to post by muzzy
Thanks for checking that out muzzy.
Many of the articles on EP are sourced and not writen by the site owner.
Rainbows
Jane
Thanks for checking that out muzzy.
Many of the articles on EP are sourced and not writen by the site owner.
Rainbows
Jane
reply to post by angelchemuel
ETA: This is based on Mg 6.0 as Muzzy was checking but I am just working on Mag 6.5 over the same period and if the data is correct then I will apologise
Many of the articles on EP are not checked out by the owner either and are just posted verbatim right or wrong! In the same reaction that Muzzy had - you know I will check that - so should EP and not just believe everything they are told. Yet another reason to consider them an unreliable source.
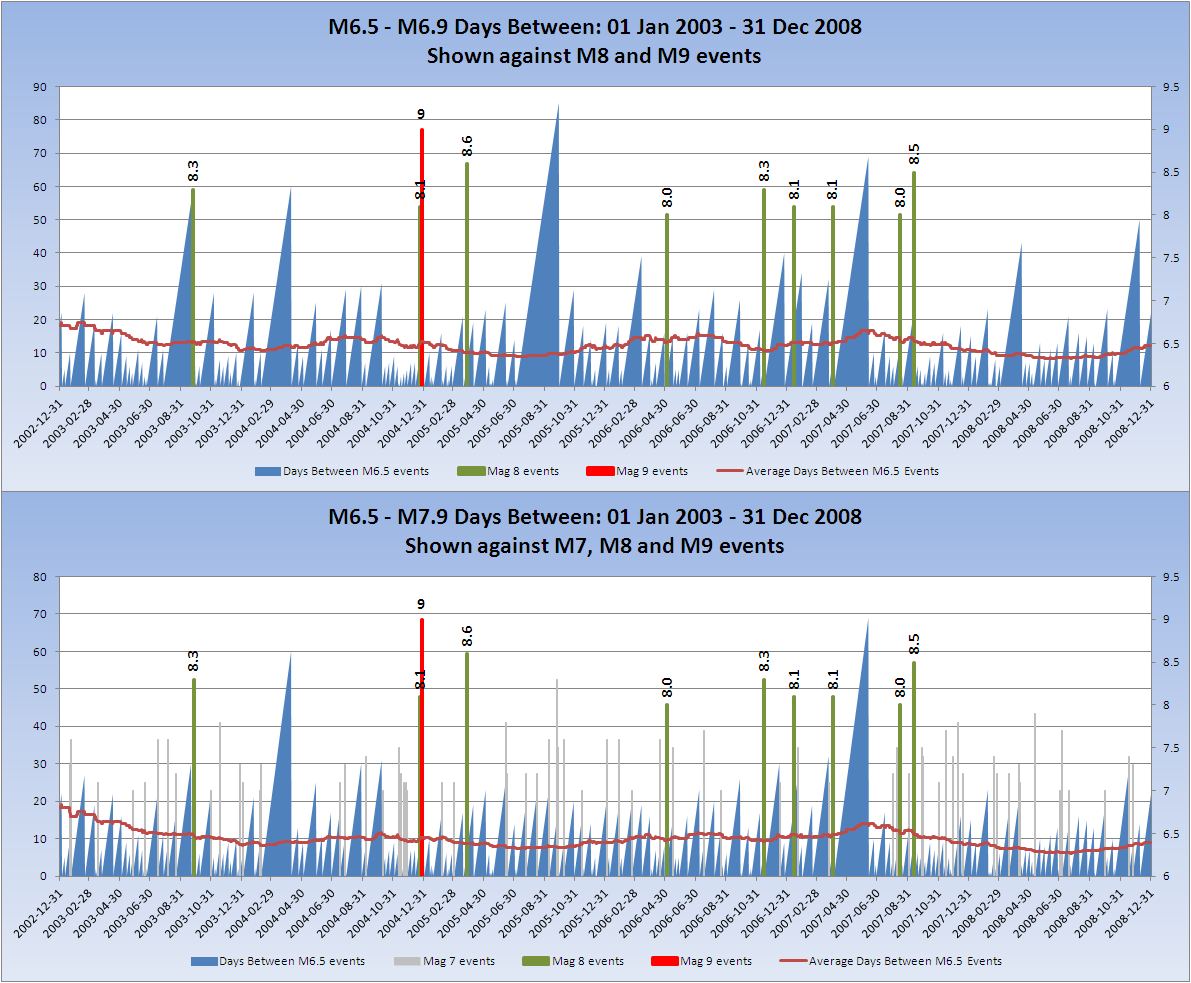
It occurred to me that Muzzy could have saved himself some trouble because a while ago I posted somewhere on this or QW2012 the gaps between large earthquakes and there was at the most 17 days between any Mag 6+ which makes 95 days impossible. USGS, as Muzzy said, should read their own data
This was the chart I posted which runs from 01 Jan 2003 to 31 Dec 2008 (that is as far as I have got at present). You can see the 17 day spike in 2004 BEFORE the Indonesian quake. You can also see that is the only one and you can also see the average which drifts from
ETA: This is based on Mg 6.0 as Muzzy was checking but I am just working on Mag 6.5 over the same period and if the data is correct then I will apologise
Many of the articles on EP are not checked out by the owner either and are just posted verbatim right or wrong! In the same reaction that Muzzy had - you know I will check that - so should EP and not just believe everything they are told. Yet another reason to consider them an unreliable source.
It occurred to me that Muzzy could have saved himself some trouble because a while ago I posted somewhere on this or QW2012 the gaps between large earthquakes and there was at the most 17 days between any Mag 6+ which makes 95 days impossible. USGS, as Muzzy said, should read their own data
This was the chart I posted which runs from 01 Jan 2003 to 31 Dec 2008 (that is as far as I have got at present). You can see the 17 day spike in 2004 BEFORE the Indonesian quake. You can also see that is the only one and you can also see the average which drifts from
update to post by PuterMan
At least during the period 2002 to 2008 inclusive there is not one single period where there is a 95 day gap, and for the USGS premise to hold good there would have to be. There is one gap of 85 days but it is not connected to any major earthquake. There is one
At least during the period 2002 to 2008 inclusive there is not one single period where there is a 95 day gap, and for the USGS premise to hold good there would have to be. There is one gap of 85 days but it is not connected to any major earthquake. There is one
reply to post by angelchemuel
It is our pleasure, as always, to debunk USGS!
BUT..........
It is possible, thought I doubt it, that we have misinterpreted what was said in the two source blogs.
I believe that quite clearly refers the reader to distances thousands of kilometres away and then says this period without a large quake has been a rare event.
Whilst it does not make it clear that the M6.5 is pointing to worldwide I think it is reasonable to make that assumption from the text.
However, is Fred Pollitz being reported correctly? I am not sure since these scientists seem incapable of creating a document with any flow to it
Rare Great Earthquake in April Triggers Large Aftershocks All Over the Globe
The particularly relevant phrase in that is:
(You see what I mean about flow?)
The synopsis of the paper in Nature ( paywalled of course ) does not seem to suggest the text attributed.
I suspect that the paper has been misquoted but we would need to see the full paper to determine that.
From the other paper linked in the USGS article there is a link to this video of a well attended presentation ( ) on the 2004 seismicity mentioned above.
and
See in the USGS article the graphic at the end entitled
Number of earthquakes at least M=5.5 in the eight days preceding and the eight days following the M=8.6 main shock in the East Indian Ocean on April 11, 2012.
They are saying that Mag 5.5 > numbers average just over 1 historically. This is derived from 20,255 Mag 5.5+ quakes registered in ANSS divided by 17,542 days giving 1.152686 average M5.5+ quakes per day worldwide BUT.............and I don't have time to calculate it at present..........a large number of 5.5Mw quakes are NOT registered as M5.5+ as they are (for example) 5.1mb and anything 5.1mb and over is potentially 5.5Mw.
Just on the past year this gives a daily rate of 2.75. In the 8 days after the rate was 3.75 based on USGS but potentially was 9.5
However you cannot compare 8 days to 17,542 days and say that the rate is significantly increased.
From 01 Jan 1964 to 30 Nov 2012 the number of quakes 5.5 (USGS) was 20,583 and the number of days in 17,779 giving a daily average of 1.1579 which is 0.005214 quakes per day different from the other figure.
How many increased number were there at other periods after big quakes? Probably many.
You wonder how people manipulate data for other areas of science? This is how.
It is our pleasure, as always, to debunk USGS!
BUT..........
It is possible, thought I doubt it, that we have misinterpreted what was said in the two source blogs.
The magnitude (M) 8.6 earthquake, a strike-slip event at intra-oceanic tectonic plates, caused global seismic rates of M=4.5 to rise for several days, even at distances thousands of kilometers from the main-shock site. However, the rate of M=6.5 seismic activity subsequently dropped to zero for the next 95 days. This period of quiet, without a large quake, has been a rare event in the past century. So why did this period of quiet occur?
I believe that quite clearly refers the reader to distances thousands of kilometres away and then says this period without a large quake has been a rare event.
Whilst it does not make it clear that the M6.5 is pointing to worldwide I think it is reasonable to make that assumption from the text.
However, is Fred Pollitz being reported correctly? I am not sure since these scientists seem incapable of creating a document with any flow to it
Rare Great Earthquake in April Triggers Large Aftershocks All Over the Globe
The particularly relevant phrase in that is:
In a study published in this week’s issue of “Nature,” USGS seismologist Fred Pollitz and colleagues analyzed the unprecedented increase in global seismic activity triggered by the Magnitude-8.6 East Indian Ocean quake of April 11, 2012, and in a recently published study in the “Proceedings of the National Academy of Sciences,” seismologist Volkan Sevilgen and his USGS colleagues investigated the near-cessation of seismic activity up to 250 miles away caused by the 2004 M9.2 Sumatra earthquake.
(You see what I mean about flow?)
The synopsis of the paper in Nature ( paywalled of course ) does not seem to suggest the text attributed.
Large earthquakes trigger very small earthquakes globally during passage of the seismic waves and during the following several hours to days1, 2, 3, 4, 5, 6, 7, 8, 9, 10, but so far remote aftershocks of moment magnitude M ≥ 5.5 have not been identified11, with the lone exception of an M = 6.9 quake remotely triggered by the surface waves from an M = 6.6 quake 4,800 kilometres away12. The 2012 east Indian Ocean earthquake that had a moment magnitude of 8.6 is the largest strike-slip event ever recorded. Here we show that the rate of occurrence of remote M ≥ 5.5 earthquakes (>1,500 kilometres from the epicentre) increased nearly fivefold for six days after the 2012 event, and extended in magnitude to M ≤ 7. These global aftershocks were located along the four lobes of Love-wave radiation; all struck where the dynamic shear strain is calculated to exceed 10−7 for at least 100 seconds during dynamic-wave passage. The other M ≥ 8.5 mainshocks during the past decade are thrusts; after these events, the global rate of occurrence of remote M ≥ 5.5 events increased by about one-third the rate following the 2012 shock and lasted for only two days, a weaker but possibly real increase. We suggest that the unprecedented delayed triggering power of the 2012 earthquake may have arisen because of its strike-slip source geometry or because the event struck at a time of an unusually low global earthquake rate, perhaps increasing the number of nucleation sites that were very close to failure.
I suspect that the paper has been misquoted but we would need to see the full paper to determine that.
From the other paper linked in the USGS article there is a link to this video of a well attended presentation ( ) on the 2004 seismicity mentioned above.
and
See in the USGS article the graphic at the end entitled
Number of earthquakes at least M=5.5 in the eight days preceding and the eight days following the M=8.6 main shock in the East Indian Ocean on April 11, 2012.
They are saying that Mag 5.5 > numbers average just over 1 historically. This is derived from 20,255 Mag 5.5+ quakes registered in ANSS divided by 17,542 days giving 1.152686 average M5.5+ quakes per day worldwide BUT.............and I don't have time to calculate it at present..........a large number of 5.5Mw quakes are NOT registered as M5.5+ as they are (for example) 5.1mb and anything 5.1mb and over is potentially 5.5Mw.
Just on the past year this gives a daily rate of 2.75. In the 8 days after the rate was 3.75 based on USGS but potentially was 9.5
However you cannot compare 8 days to 17,542 days and say that the rate is significantly increased.
From 01 Jan 1964 to 30 Nov 2012 the number of quakes 5.5 (USGS) was 20,583 and the number of days in 17,779 giving a daily average of 1.1579 which is 0.005214 quakes per day different from the other figure.
How many increased number were there at other periods after big quakes? Probably many.
You wonder how people manipulate data for other areas of science? This is how.
edit on 26/4/2013 by PuterMan because: (no reason
given)
reply to post by PuterMan
EP/Space Daily said
Fred/USGS said
I didn't check that out.
EP says "several days" , Fred is specific "6 days"
But just does that include local aftershocks of the 8.6 or not ?
I'm not sure these 3 articles are about the same thing, the USGS seems to have the theme/title that "April 2012: East Indian Ocean quake triggers many distant quakes"
whereas the EP is titled "Planet has unusual period of silence between large earthquakes"
the exact opposite.
and the Nature article seems to focus on the fact "largest strike-slip event ever recorded" and "The other M ≥ 8.5 mainshocks during the past decade are thrusts"
So 3 articles in total, by the same guy, with 3 different conclusions.
You could say "cover your ass"
Maybe it would have been more appropriate to just leave the analysis thing alone and concentrate on getting locations and magnitudes correct on a daily basis at USGS.
The final comment on EP
"Pollitz and his colleagues show that a transient seismic perturbation of the size of the April 2012 global aftershock would inhibit rupture in 88 percent of their possible M=6.5 earthquake fault sources over the next 95 days, regardless of how close they were to failure beforehand"
that is a VERY dangerous statement to make,
relax folks, there won't be many 6.5's for 95 days
WRONG
I see EP hasn't approved my comment reply, that just about says it all. Make stuff up, then cover up the truth.
EP/Space Daily said
The magnitude (M) 8.6 earthquake, a strike-slip event at intra-oceanic tectonic plates, caused global seismic rates of M=4.5 to rise for several days
Fred/USGS said
An extraordinary number of earthquakes of M4.5 and greater were triggered worldwide in the six days after the M8.6 East Indian Ocean earthquake in April 2012.
I didn't check that out.
EP says "several days" , Fred is specific "6 days"
But just does that include local aftershocks of the 8.6 or not ?
I'm not sure these 3 articles are about the same thing, the USGS seems to have the theme/title that "April 2012: East Indian Ocean quake triggers many distant quakes"
whereas the EP is titled "Planet has unusual period of silence between large earthquakes"
the exact opposite.
and the Nature article seems to focus on the fact "largest strike-slip event ever recorded" and "The other M ≥ 8.5 mainshocks during the past decade are thrusts"
So 3 articles in total, by the same guy, with 3 different conclusions.
You could say "cover your ass"
Maybe it would have been more appropriate to just leave the analysis thing alone and concentrate on getting locations and magnitudes correct on a daily basis at USGS.
The final comment on EP
"Pollitz and his colleagues show that a transient seismic perturbation of the size of the April 2012 global aftershock would inhibit rupture in 88 percent of their possible M=6.5 earthquake fault sources over the next 95 days, regardless of how close they were to failure beforehand"
that is a VERY dangerous statement to make,
relax folks, there won't be many 6.5's for 95 days
WRONG
I see EP hasn't approved my comment reply, that just about says it all. Make stuff up, then cover up the truth.
edit on 26-4-2013 by muzzy because: (no reason given)
reply to post by PuterMan
thanks for that, weird how it didn't work on FF as a "refresh", but it did on Chrome and IE.
I made the animation as a single string, it wasn't a loop so it would replay, did you redo it?
I'll go have a look again now and see if it has changed at all, with any more additions
Makes a bit of a change, checking the process of reporting, rather than the actual data itself.
edit on 26-4-2013 by muzzy because: (no reason
given)
update to post by PuterMan
I added in the Mag 7 - 7.9 and it decimates the 95 days. Curiously the 85 days gap was plugged with Mag 7 quakes.
Here is the Mag 6.5 to 7.9 days between set against the Mag 8 & 9 (the chart below) with the other one I did on top (with one minor correction as I mistypes 01-13 and 01-31)
Click the image to increase its bigness

edit on 26/4/2013 by PuterMan because: To change the image for one with the same scales on each axis of each part.
reply to post by muzzy
Yes, I added the infinite loop and increased the delay on the last frame to 6 seconds from 1 so that there suitable pause before it restarts.
Yes, I added the infinite loop and increased the delay on the last frame to 6 seconds from 1 so that there suitable pause before it restarts.
Just a heads up, if you will.
I'm seeing a lot of activity out of Utah these past few days, nothing huge mostly below 2.0.
But enough to notice a swarm pattern in one area.
It all been in or close to this region
39.442N 111.213W
Preliminary Earthquake Report
Magnitude 1.0
Date-Time
25 Apr 2013 20:07:10 UTC
25 Apr 2013 14:07:10 near epicenter
25 Apr 2013 13:07:10 standard time in your timezone
Location 39.442N 111.213W
Depth 4 km
Distances
23 km (14 mi) ESE of Mount Pleasant, Utah
80 km (49 mi) SSE of Payson, Utah
83 km (51 mi) SSE of Spanish Fork, Utah
87 km (53 mi) SSE of Springville, Utah
157 km (97 mi) SSE of Salt Lake City, Utah
Location Uncertainty Horizontal: 0.8 km; Vertical 31.6 km
Parameters Nph = 6; Dmin = 16.3 km; Rmss = 0.11 seconds; Gp = 118°
Version = 2
Event ID uu 60020802
The depth is pretty shallow too.
Just observing
M.
reply to post by PuterMan
yeah I seen that too.
The key line I looked at in your 2 graphs was the burgundy " average days between" which never went over 20 days.
I tend to shy away from analyzing stuff too much, its always open to individual interpretation and is opinion only.
If I was to do a study like Fred did then I would have to set some strict parameters, for example if we go 6.5> do we include aftershocks of any 7's that occur in this period, or just the 7.whatever it was by itself
eg from that text file I posted, keeping in mind I already deleted the Mag 8 local aftershocks;
2010/06/16 03:16:27.55 -2.1740 136.5430 18.00 7.00 Mw
2010/06/16 03:58:08.48 -2.3290 136.4840 10.50 6.60 Mw
and
2011/08/20 16:55:02.81 -18.3650 168.1430 32.00 7.10 Mw
2011/08/20 17:13:06.38 -18.3080 168.1560 35.00 6.50 Mw
and this one, main and aftershock? or 2 x mag 7 events?
2012/10/28 03:04:08.82 52.7880 -132.1010 14.00 7.80 Mw
2012/10/28 03:07:30.00 52.7690 -131.9270 5.00 7.70 Unk
and if we don't include aftershocks, where do foreshocks fit in?
2010/07/18 13:04:09.41 -5.9660 150.4280 28.00 6.90 Mw
2010/07/18 13:34:59.36 -5.9310 150.5900 35.00 7.40 Mw
and what about multiple 7's like this one
2010/07/23 22:51:11.84 6.4970 123.4800 578.00 7.60 Mw
2010/07/23 23:15:10.19 6.7760 123.2590 640.60 7.50 Mw
2010/07/24 05:35:01.06 6.2180 123.5190 553.00 6.60 Mw
2010/07/29 07:31:56.24 6.5480 123.2220 618.00 6.60 Mw
Is that to be just one quake (to be included), with 3 aftershocks (not to be included) or all 4 events that should be included. How can you leave out a 7.5 calling it an aftershock?
and how long after does an aftershock have to be, to be an aftershock?
example, this one is 49 days after;
2012/09/05 14:42:07.88 10.0990 -85.3080 35.00 7.60 Mw
2012/10/24 00:45:32.99 10.0860 -85.2980 17.00 6.50 Mw
without parameters (which should always be included in the text) the conclusion can be totally distorted
I wonder why Fred el al. picked 95 days? in the ANSS data nothing in particular stands out at the 95 day marks
365 divided by 95 goes 3.84 times, not an even number
and why mag 6.5 and not 6.0?
probably would have got different results that didn't back the articles summary.
makes you wonder if the top brass at USGS set a goal "hey Fred, go and find some data that will confirm quakes drop off after a mag 8, and if that doesn't fit, then make it show they increase"
the mistake is that they released both articles
For years I had the premise in the case of New Zealand earthquakes, that just before a mag 5 the number of daily events would drop away considerably (average 20-26 per day dropping to 1-3 per day), and it did stack up time after time, however when Geonet introduced the SeisComP3 data collection system on September 2012 the numbers have since been consistent, never less than 26 per day and averaging around the 40 mark. Of the 10 mag 5's since Sept 2012 only once did the numbers drop off prior based on the SeisComP3 data.
So that shows the analysis only worked based on the data available at the time, and I found out later that because the older type data was manually loaded it was also subject to human influence.
here is the text file again (is 2 pages back now) ANSS data mag 8's +95day periods
ha!
reminds me of that saying
" how much wood could a woodchuck chuck, if a woodchuck could chuck wood"
yeah I seen that too.
The key line I looked at in your 2 graphs was the burgundy " average days between" which never went over 20 days.
I tend to shy away from analyzing stuff too much, its always open to individual interpretation and is opinion only.
If I was to do a study like Fred did then I would have to set some strict parameters, for example if we go 6.5> do we include aftershocks of any 7's that occur in this period, or just the 7.whatever it was by itself
eg from that text file I posted, keeping in mind I already deleted the Mag 8 local aftershocks;
2010/06/16 03:16:27.55 -2.1740 136.5430 18.00 7.00 Mw
2010/06/16 03:58:08.48 -2.3290 136.4840 10.50 6.60 Mw
and
2011/08/20 16:55:02.81 -18.3650 168.1430 32.00 7.10 Mw
2011/08/20 17:13:06.38 -18.3080 168.1560 35.00 6.50 Mw
and this one, main and aftershock? or 2 x mag 7 events?
2012/10/28 03:04:08.82 52.7880 -132.1010 14.00 7.80 Mw
2012/10/28 03:07:30.00 52.7690 -131.9270 5.00 7.70 Unk
and if we don't include aftershocks, where do foreshocks fit in?
2010/07/18 13:04:09.41 -5.9660 150.4280 28.00 6.90 Mw
2010/07/18 13:34:59.36 -5.9310 150.5900 35.00 7.40 Mw
and what about multiple 7's like this one
2010/07/23 22:51:11.84 6.4970 123.4800 578.00 7.60 Mw
2010/07/23 23:15:10.19 6.7760 123.2590 640.60 7.50 Mw
2010/07/24 05:35:01.06 6.2180 123.5190 553.00 6.60 Mw
2010/07/29 07:31:56.24 6.5480 123.2220 618.00 6.60 Mw
Is that to be just one quake (to be included), with 3 aftershocks (not to be included) or all 4 events that should be included. How can you leave out a 7.5 calling it an aftershock?
and how long after does an aftershock have to be, to be an aftershock?
example, this one is 49 days after;
2012/09/05 14:42:07.88 10.0990 -85.3080 35.00 7.60 Mw
2012/10/24 00:45:32.99 10.0860 -85.2980 17.00 6.50 Mw
without parameters (which should always be included in the text) the conclusion can be totally distorted
I wonder why Fred el al. picked 95 days? in the ANSS data nothing in particular stands out at the 95 day marks
365 divided by 95 goes 3.84 times, not an even number
and why mag 6.5 and not 6.0?
probably would have got different results that didn't back the articles summary.
makes you wonder if the top brass at USGS set a goal "hey Fred, go and find some data that will confirm quakes drop off after a mag 8, and if that doesn't fit, then make it show they increase"
the mistake is that they released both articles
For years I had the premise in the case of New Zealand earthquakes, that just before a mag 5 the number of daily events would drop away considerably (average 20-26 per day dropping to 1-3 per day), and it did stack up time after time, however when Geonet introduced the SeisComP3 data collection system on September 2012 the numbers have since been consistent, never less than 26 per day and averaging around the 40 mark. Of the 10 mag 5's since Sept 2012 only once did the numbers drop off prior based on the SeisComP3 data.
So that shows the analysis only worked based on the data available at the time, and I found out later that because the older type data was manually loaded it was also subject to human influence.
here is the text file again (is 2 pages back now) ANSS data mag 8's +95day periods
edit on 26-4-2013 by muzzy because: (no reason given)
ha!
and how long after does an aftershock have to be, to be an aftershock?
reminds me of that saying
" how much wood could a woodchuck chuck, if a woodchuck could chuck wood"
edit on 26-4-2013 by muzzy because: (no reason given)
What is going on in Georgia today? Frack related?
2.8 2013/04/26 05:13:40 33.773 -82.373 11.8 GEORGIA, USA
plus a few others of 2.2 and 2.1 today showing up on Intellicast? You have to add the earthquake layer.
By the way here is an interesting report i found called:
Impact of New Madrid Seismic Zone Earthquakes on the Central USA Vol. 1 and 2
Summary/Conclusions of this report are pretty sobering:
The first earthquakes felt in Augusta were when the New Madrid ruptured in 1811-1812.
2.8 2013/04/26 05:13:40 33.773 -82.373 11.8 GEORGIA, USA
plus a few others of 2.2 and 2.1 today showing up on Intellicast? You have to add the earthquake layer.
By the way here is an interesting report i found called:
Impact of New Madrid Seismic Zone Earthquakes on the Central USA Vol. 1 and 2
Summary/Conclusions of this report are pretty sobering:
The results indicate that Tennessee, Arkansas, and Missouri are most severely impacted. Illinois and Kentucky are also impacted, though not as severely as the previous three states.
Nearly 715,000 buildings are damaged in the eight-state study region. About 42,000 search and rescue personnel working in 1,500 teams are required to respond to the earthquakes.
Damage to critical infrastructure (essential facilities, transportation and utility lifelines) is substantial in the 140 impacted counties near the rupture zone, including 3,500 damaged bridges and nearly 425,000 breaks and leaks to both local and interstate pipelines.
Approximately 2.6 million households are without power after the earthquake. Nearly 86,000 injuries and fatalities result from damage to infrastructure.
Nearly 130 hospitals are damaged and most are located in the impacted counties near the rupture zone. There is extensive damage and substantial travel delays in both Memphis, Tennessee, and St. Louis, Missouri, thus hampering search and rescue as well as evacuation.
Moreover roughly 15 major bridges are unusable. Three days after the earthquake, 7.2 million people are still displaced and 2 million people seek temporary shelter.
Direct economic losses for the eight states total nearly $300 billion, while indirect losses may be at least twice this amount
The first earthquakes felt in Augusta were when the New Madrid ruptured in 1811-1812.
The first earthquakes reported felt in Georgia were the great New Madrid series of 1811 - 1812. These shocks were felt over almost all of the eastern United States. In Georgia that series of shocks reportedly shook some bricks from chimneys.
The great Charleston, South Carolina, earthquake of 1886 caused severe shaking experienced in Georgia. On August 31 at 9:25 p.m., preceded by a low rumble, the shock waves reached Savannah. People had difficulty remaining standing. One woman died of fright as the shaking cracked walls, felled chimneys, and broke windows. Panic at a revival service left two injured and two more were injured in leaping from upper story windows. Several more were injured by falling bricks.
Ten buildings in Savannah were damaged beyond repair and at least 240 chimneys damaged. People spent the night outside. At Tybee Island light station the 134 foot lighthouse was cracked near the middle where the walls were six feet thick, and the one-ton lens moved an inch and a half to the northeast.
In Augusta the shaking was the most severe (VIII on the Modified Mercalli scale) in the State. An estimated 1000 chimneys and many buildings were damaged. The business and social life was paralyzed for two days. Brunswick and Darien were alarmed.
Originally posted by ericblair4891
reply to post by muzzy
And thanks for adding the Japanese numbers, I was curious about that as well.
huh? Japanese? don't you mean China?
Originally posted by PuterMan
reply to post by muzzy
Yes, I added the infinite loop and increased the delay on the last frame to 6 seconds from 1 so that there suitable pause before it restarts.
I didn't do a direct link to the ATS animation because I didn't think it would fit on the page. I see from your post that it automatically re-scales those. Is that a new Forum feature (re scaling)?
I'm getting those bloody Text-Enhance popups again, had to disable Abobe Flash Player for my own sanity, now just had to put it back on to load thse images. Also see since I last looked LyricsTube 1.111 has been added to my Extensions without my knowledge or permission, damn Windows 8, I hate it. Got no choice though in having to have Adobe Player on if I want to load pics to ATS.
anyway back to Ya'an, China
still just looking at the 72 hour (3 days time period)
new block of data added into the 63:59:01 to 72:00:00 period, added at 151 hours (6.29 days) after the main shock, now making 926 number total.
[color=8BB381](click image for larger version, opens in new tab/window)
also between the 72hr mark and the 120 hr mark, 559 more aftershocks
[color=8BB381](click image for larger version, opens in new tab/window)
only 2 more added 120-151hrs elapsed time
edit on 26-4-2013 by muzzy because: ah ha! I see how you rescaled to fit the screen and still had the link full size, substitute [ats] with
[pic], clever!
With regard to the upgraded quake from 5.9 to 6.0 in Japan I was looking at the seismo gram and could not understand why there was a much bigger quake
earlier in the day.
ETA: Details of Mag 6
2013-04-17 12:03:31, 38.484, 141.443, 6.0, 72.6, Nr. E. Coast Of Honshu. Japan [Map]
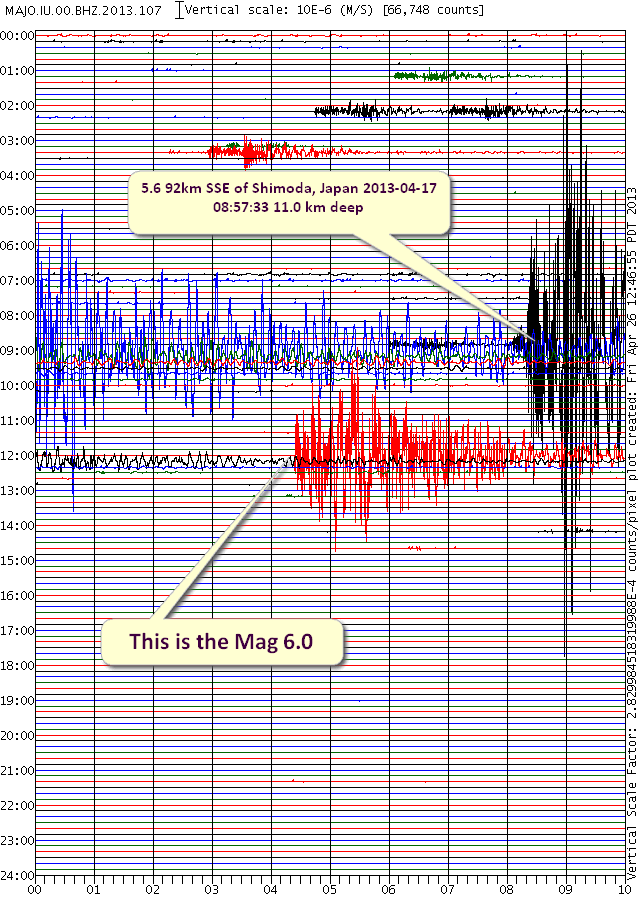
The relationship of these to the seismo station is this
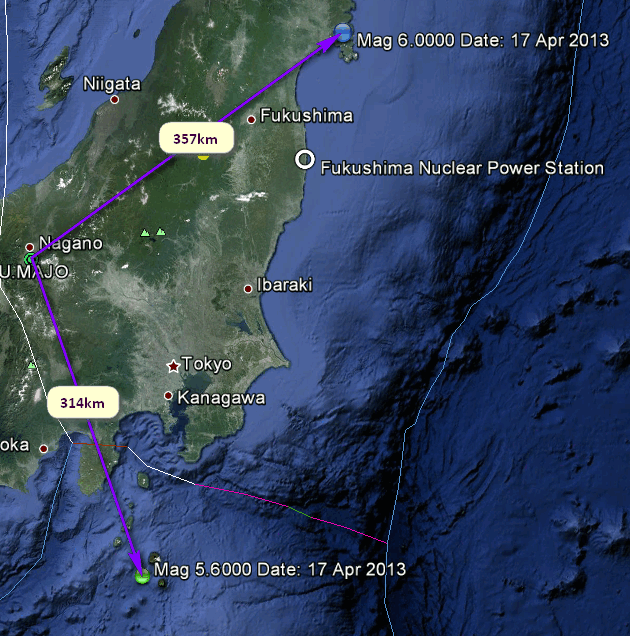
JMA have that 5.6 as 6.2.
Sorta hmm..........although the Mag 6 was quite a bit deeper..........
ETA: Details of Mag 6
2013-04-17 12:03:31, 38.484, 141.443, 6.0, 72.6, Nr. E. Coast Of Honshu. Japan [Map]
The relationship of these to the seismo station is this
JMA have that 5.6 as 6.2.
Sorta hmm..........although the Mag 6 was quite a bit deeper..........
edit on 26/4/2013 by PuterMan because: (no reason given)
reply to post by PuterMan
yep I've noticed depth makes a huge difference on LISS as well, last nights 6.1 Kermadecs is very "stumpy" compared to what you would expect a 6.1 so close to SNZO to look like.
was at 354km deep according to GFZ
the graph
not such a difference between the 2 Jap quakes when you look at them from 9,400km away, if anything the 2nd one looks slightly bigger (the split one)
LISS NZSO 17-04-2013
GFZ data on those, they never changed the first one from 5.6M. 46km not that much difference in the depth (56km vs10km)
yep I've noticed depth makes a huge difference on LISS as well, last nights 6.1 Kermadecs is very "stumpy" compared to what you would expect a 6.1 so close to SNZO to look like.
was at 354km deep according to GFZ
the graph
not such a difference between the 2 Jap quakes when you look at them from 9,400km away, if anything the 2nd one looks slightly bigger (the split one)
LISS NZSO 17-04-2013
edit on 26-4-2013 by muzzy because: (no reason given)
GFZ data on those, they never changed the first one from 5.6M. 46km not that much difference in the depth (56km vs10km)
edit on 26-4-2013 by
muzzy because: (no reason given)
Well USGS REALLY sux now, there is no P wave Travel Times AT ALL now on the technical pages off the newinteractivemapandlistthingymark2 mark 1 or the
old 7 days list.
what use are they for anything?
what use are they for anything?
Originally posted by whatnext21
What is going on in Georgia today? Frack related?
2.8 2013/04/26 05:13:40 33.773 -82.373 11.8 GEORGIA, USA
plus a few others of 2.2 and 2.1 today showing up on Intellicast? You have to add the earthquake layer.
By the way here is an interesting report i found called:
Impact of New Madrid Seismic Zone Earthquakes on the Central USA Vol. 1 and 2
Summary/Conclusions of this report are pretty sobering:
The results indicate that Tennessee, Arkansas, and Missouri are most severely impacted. Illinois and Kentucky are also impacted, though not as severely as the previous three states.
Nearly 715,000 buildings are damaged in the eight-state study region. About 42,000 search and rescue personnel working in 1,500 teams are required to respond to the earthquakes.
Damage to critical infrastructure (essential facilities, transportation and utility lifelines) is substantial in the 140 impacted counties near the rupture zone, including 3,500 damaged bridges and nearly 425,000 breaks and leaks to both local and interstate pipelines.
Approximately 2.6 million households are without power after the earthquake. Nearly 86,000 injuries and fatalities result from damage to infrastructure.
Nearly 130 hospitals are damaged and most are located in the impacted counties near the rupture zone. There is extensive damage and substantial travel delays in both Memphis, Tennessee, and St. Louis, Missouri, thus hampering search and rescue as well as evacuation.
Moreover roughly 15 major bridges are unusable. Three days after the earthquake, 7.2 million people are still displaced and 2 million people seek temporary shelter.
Direct economic losses for the eight states total nearly $300 billion, while indirect losses may be at least twice this amount
The first earthquakes felt in Augusta were when the New Madrid ruptured in 1811-1812.
The first earthquakes reported felt in Georgia were the great New Madrid series of 1811 - 1812. These shocks were felt over almost all of the eastern United States. In Georgia that series of shocks reportedly shook some bricks from chimneys.
The great Charleston, South Carolina, earthquake of 1886 caused severe shaking experienced in Georgia. On August 31 at 9:25 p.m., preceded by a low rumble, the shock waves reached Savannah. People had difficulty remaining standing. One woman died of fright as the shaking cracked walls, felled chimneys, and broke windows. Panic at a revival service left two injured and two more were injured in leaping from upper story windows. Several more were injured by falling bricks.
Ten buildings in Savannah were damaged beyond repair and at least 240 chimneys damaged. People spent the night outside. At Tybee Island light station the 134 foot lighthouse was cracked near the middle where the walls were six feet thick, and the one-ton lens moved an inch and a half to the northeast.
In Augusta the shaking was the most severe (VIII on the Modified Mercalli scale) in the State. An estimated 1000 chimneys and many buildings were damaged. The business and social life was paralyzed for two days. Brunswick and Darien were alarmed.
Don't know much about quakes but can say that I can't remember the last time I heard of one in GA or SC. Is this an odd quake or just normal as usual?
reply to post by Vasa Croe
enough that unless they started fracking in 1977 that cause can be discounted.
text file ANSS Georgia and South Carolina 1964-2013 click to open in html
I'd map them for ya but its dinner time here.
enough that unless they started fracking in 1977 that cause can be discounted.
text file ANSS Georgia and South Carolina 1964-2013 click to open in html
I'd map them for ya but its dinner time here.
new topics
-
Maestro Benedetto
Literature: 44 minutes ago -
Is AI Better Than the Hollywood Elite?
Movies: 53 minutes ago -
Las Vegas UFO Spotting Teen Traumatized by Demon Creature in Backyard
Aliens and UFOs: 4 hours ago -
2024 Pigeon Forge Rod Run - On the Strip (Video made for you)
Automotive Discussion: 5 hours ago -
Gaza Terrorists Attack US Humanitarian Pier During Construction
Middle East Issues: 5 hours ago -
The functionality of boldening and italics is clunky and no post char limit warning?
ATS Freshman's Forum: 6 hours ago -
Meadows, Giuliani Among 11 Indicted in Arizona in Latest 2020 Election Subversion Case
Mainstream News: 7 hours ago -
Massachusetts Drag Queen Leads Young Kids in Free Palestine Chant
Social Issues and Civil Unrest: 7 hours ago -
Weinstein's conviction overturned
Mainstream News: 8 hours ago -
Supreme Court Oral Arguments 4.25.2024 - Are PRESIDENTS IMMUNE From Later Being Prosecuted.
Above Politics: 10 hours ago
top topics
-
Krystalnacht on today's most elite Universities?
Social Issues and Civil Unrest: 10 hours ago, 9 flags -
Supreme Court Oral Arguments 4.25.2024 - Are PRESIDENTS IMMUNE From Later Being Prosecuted.
Above Politics: 10 hours ago, 8 flags -
Weinstein's conviction overturned
Mainstream News: 8 hours ago, 7 flags -
Gaza Terrorists Attack US Humanitarian Pier During Construction
Middle East Issues: 5 hours ago, 7 flags -
University of Texas Instantly Shuts Down Anti Israel Protests
Education and Media: 13 hours ago, 6 flags -
Massachusetts Drag Queen Leads Young Kids in Free Palestine Chant
Social Issues and Civil Unrest: 7 hours ago, 6 flags -
Meadows, Giuliani Among 11 Indicted in Arizona in Latest 2020 Election Subversion Case
Mainstream News: 7 hours ago, 5 flags -
Las Vegas UFO Spotting Teen Traumatized by Demon Creature in Backyard
Aliens and UFOs: 4 hours ago, 4 flags -
2024 Pigeon Forge Rod Run - On the Strip (Video made for you)
Automotive Discussion: 5 hours ago, 2 flags -
Any one suspicious of fever promotions events, major investor Goldman Sachs card only.
The Gray Area: 15 hours ago, 2 flags
active topics
-
University of Texas Instantly Shuts Down Anti Israel Protests
Education and Media • 225 • : Xtrozero -
VP's Secret Service agent brawls with other agents at Andrews
Mainstream News • 59 • : ByeByeAmericanPie -
SETI chief says US has no evidence for alien technology. 'And we never have'
Aliens and UFOs • 72 • : yuppa -
My Poor Avocado Plant.
General Chit Chat • 77 • : JonnyC555 -
New whistleblower Jason Sands speaks on Twitter Spaces last night.
Aliens and UFOs • 61 • : Ophiuchus1 -
Is AI Better Than the Hollywood Elite?
Movies • 2 • : 5thHead -
Gaza Terrorists Attack US Humanitarian Pier During Construction
Middle East Issues • 25 • : CarlLaFong -
Mood Music Part VI
Music • 3102 • : Hellmutt -
Las Vegas UFO Spotting Teen Traumatized by Demon Creature in Backyard
Aliens and UFOs • 9 • : Ophiuchus1 -
British TV Presenter Refuses To Use Guest's Preferred Pronouns
Education and Media • 164 • : Annee