It looks like you're using an Ad Blocker.
Please white-list or disable AboveTopSecret.com in your ad-blocking tool.
Thank you.
Some features of ATS will be disabled while you continue to use an ad-blocker.

Quake Watch 2013
page: 82share:
EMSC-CSEM GFZ USGS missed
www.ldeo.columbia.edu/~ekstrom/Research/SWD/current/RADB_SWD_grd.html
www.seisme.nc/index.php?option=com_alertes&view=alertes&Itemid=184&ids=ird2013ioek&lang=en
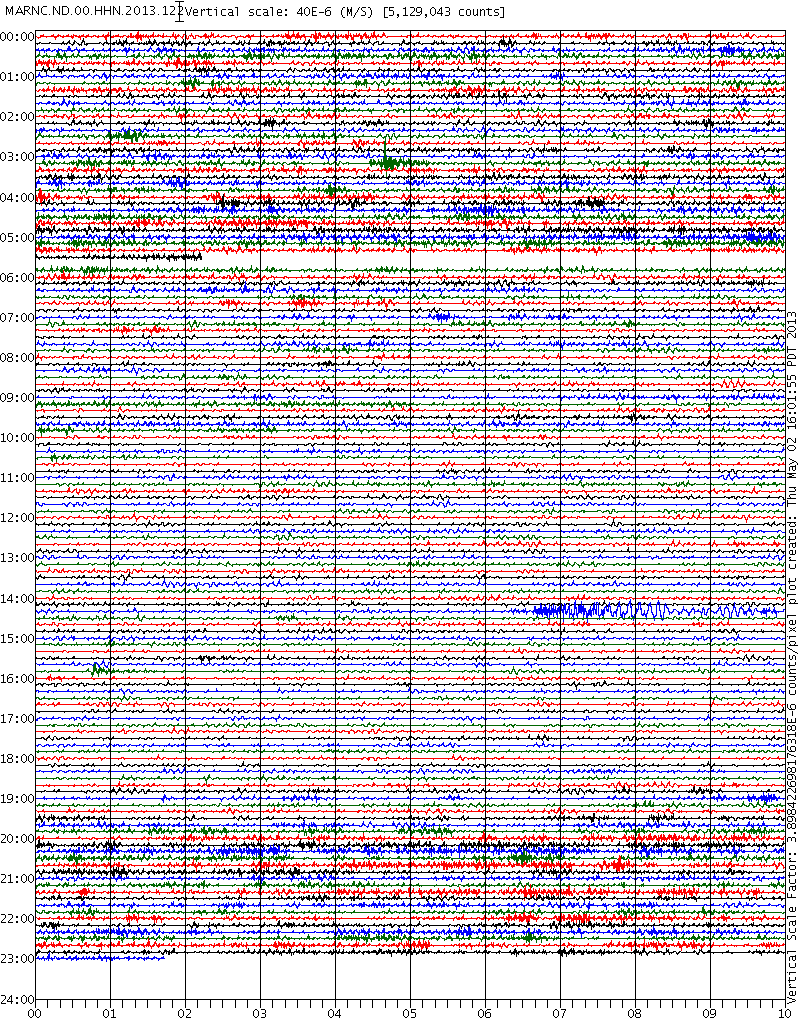
www.iris.washington.edu/servlet/quackquery/plotcache/webicorder_fMARNC.ND.00.HHN.2013.122.png
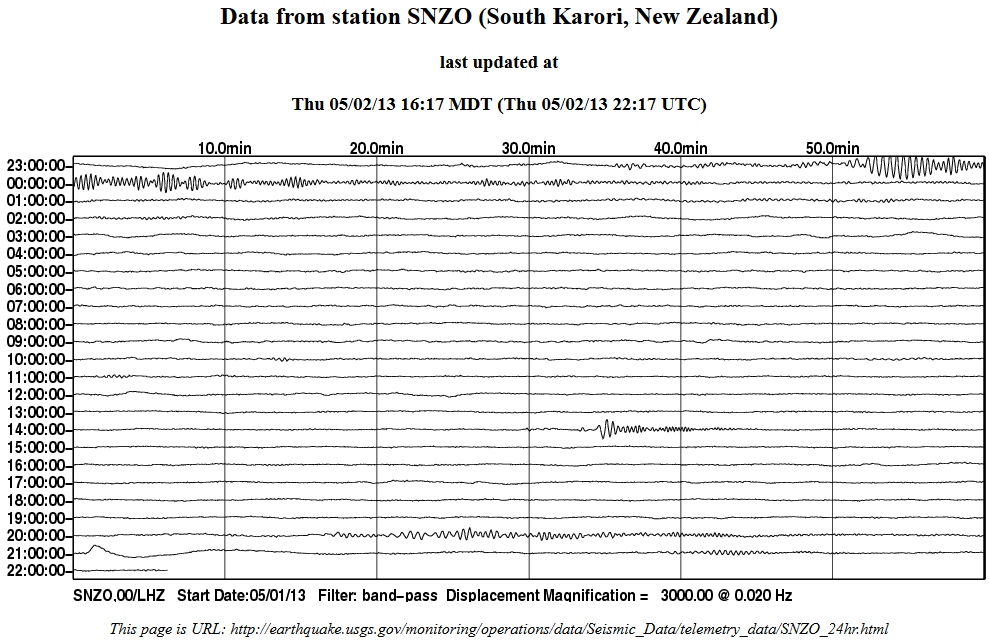
earthquake.usgs.gov/monitoring/operations/data/Seismic_Data/telemetry_data/SNZO_24hr.html
www.ldeo.columbia.edu/~ekstrom/Research/SWD/current/RADB_SWD_grd.html
2013 5 2 14 25 28.0 -23.25 170.75 33.0 4.9 SOUTHEAST OF LOYALTY ISLANDS
www.seisme.nc/index.php?option=com_alertes&view=alertes&Itemid=184&ids=ird2013ioek&lang=en
Southeast of Loyalty Islands
02/05/2013 14:25:22 (UTC) MLv 4.7 0 Km
Localisation
Southeast of Loyalty Islands
Latitude : 23.16 °S
Longitude : 170.61 °E
Depth : 0 Km
Description
Date : 02/05/2013 14:25:22 (UTC)
Magnitude : 4.7 MLv
Phase count : 8
RMS residual :0.62
Distance to nearest cities
119 kms of Matthew island
174 kms of Hunter island
181 kms of Walpole island
330 kms of Pines island
333 kms of Tadine
391 kms of Yaté
Agency : IRD - Event Id : ird2013ioek
www.iris.washington.edu/servlet/quackquery/plotcache/webicorder_fMARNC.ND.00.HHN.2013.122.png

earthquake.usgs.gov/monitoring/operations/data/Seismic_Data/telemetry_data/SNZO_24hr.html

Originally posted by Dianec
I think why I even started to pay attention was because I was driving on highway 395 out of lakeview oregon and when going by lake abert my son asked me if we were at yellowstone. In looking at the lake there was a spout of water off in the distance and other areas of steam looking vents. The smell of sulpher was strong and we even drove through some steam. I used my iPhone to get some pics but its an iPhone so they didn't capture it as well as I would have liked (yet still show something). We knew it was active due to the smell of sulphur and the fact that it was 3:00 pm and not morning fog burn off from air/water interactions. When I got home I had realized a couple of quakes had happened near that area in addition to Idaho and others you listed so assumed a small crack (quake) opened up a vent (its supposedly dormant yet used to be seismically active in this area of oregon/california). When these quakes disappeared from my map and I couldn't find them I began to question it but overall I feel there are some glitches in the system.
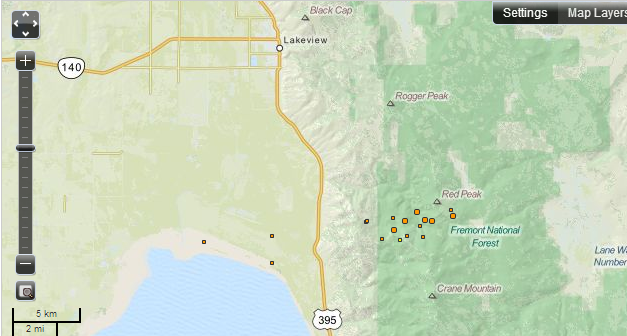
Dianec, you saw a geyser, steam vents, and smelled sulphur near Lakeview, OR? Really interesting!
Here are the quakes you mentioned.
Almost all of the earthquakes in this swarm over the past 24 hours have been very shallow. When I noticed them popping up earlier today, my first thought was volcanics of some sort, but then I noticed they were near the Warner mountains and chalked it up to mountain building or Basin and Range faulting.
1.5 12km SE of Lakeview, Oregon 2013-05-03 00:13:56 42.093°N 120.258°W 1.8
2.2 12km SE of Lakeview, Oregon 2013-05-02 23:25:22 42.106°N 120.251°W 1.8
0.2 11km SSW of Lakeview, Oregon 2013-05-02 22:30:37 42.090°N 120.397°W 7.9
2.5 13km SE of Lakeview, Oregon 2013-05-02 22:27:47 42.103°N 120.227°W 1.8
2.4 13km SE of Lakeview, Oregon 2013-05-02 20:07:25 42.101°N 120.241°W 1.8
1.6 13km SE of Lakeview, Oregon 2013-05-02 20:06:04 42.106°N 120.228°W 1.8
2.2 12km SE of Lakeview, Oregon 2013-05-02 18:36:08 42.101°N 120.246°W 2.0
1.0 12km SSE of Lakeview, Oregon 2013-05-02 18:20:27 42.092°N 120.275°W 1.6
0.5 13km SE of Lakeview, Oregon 2013-05-02 18:13:21 42.093°N 120.248°W 2.1
0.4 10km S of Lakeview, Oregon 2013-05-02 17:05:44 42.093°N 120.351°W 5.0
1.4 12km SE of Lakeview, Oregon 2013-05-02 16:44:56 42.098°N 120.249°W 1.0
2.2 12km SSE of Lakeview, Oregon 2013-05-02 14:14:43 42.096°N 120.267°W 1.8
2.2 12km SE of Lakeview, Oregon 2013-05-02 07:04:15 42.101°N 120.259°W 2.5
1.0 11km SE of Lakeview, Oregon 2013-05-02 04:07:32 42.102°N 120.267°W 4.7
0.4 10km SSE of Lakeview, Oregon 2013-05-02 04:04:57 42.101°N 120.286°W 4.7
0.6 10km SSE of Lakeview, Oregon 2013-05-02 03:23:43 42.100°N 120.286°W 5.9
1.5 12km S of Lakeview, Oregon 2013-05-02 03:22:28 42.079°N 120.351°W 5.6
0.7 12km SSE of Lakeview, Oregon 2013-05-01 14:47:39 42.091°N 120.263°W 1.8
We'll have to keep a watch on this.
reply to post by Olivine
I'm glad to have someone reply about abert lake near lakeview. I would upload pics if I knew how and if the time comes will search harder on this subject. I'm watching as well. If 2000 (on average) quakes happen per year in yellowstone for example, I believe we are over average if it continues as it has for the past 30 days or so. I am glad to see posts of quakes in the Warner mountains. I don't know if this is normal or not for this area but am going to look into it. Best regards.
I'm glad to have someone reply about abert lake near lakeview. I would upload pics if I knew how and if the time comes will search harder on this subject. I'm watching as well. If 2000 (on average) quakes happen per year in yellowstone for example, I believe we are over average if it continues as it has for the past 30 days or so. I am glad to see posts of quakes in the Warner mountains. I don't know if this is normal or not for this area but am going to look into it. Best regards.
reply to post by Dianec
My pleasure--glad to have you on the board here, and as our "eyes in the field".
We aren't the only ones watching. This is what was posted over on the PNSN facebook group (login required) by director John Vidale:
Of course, the 'nine quakes' figure has increased since that post. In fact, there was another a minutes ago.
You can see them on the UW.LKVW.EHZ seismogram here. Just click the "previous" link to see all of the day's earlier shaking.
Here is a snapshot of the action from earlier in the day:

Looking at all of the channels, motion seems to be largest in the vertical direction, if just slightly.
.......................
Uploading pics isn't too hard once you get the hang of it.
Save them on your computer, then click the "TOOLS+" link near the top, right of your ATS screen.
After that page loads, you will see "ATS uploads" just below the "tools" header. Click that.
Now just click the "select image file" button, browse your computer's folders to find where you saved the image, and click "open". (.jpg files us less space than .png, which is useful, because I think the max size upload is 500 kb.) The image should show up in the area to the right.
Now click the image. There will be 3 different codes below it. Just copy your choice (I use thumbnails if the image is too wide to fit in the forum screen easily), and then paste the code in your post.
My pleasure--glad to have you on the board here, and as our "eyes in the field".
We aren't the only ones watching. This is what was posted over on the PNSN facebook group (login required) by director John Vidale:
Nine earthquakes have been recorded in the rangefront adjacent to Lakeview during the past two days. ... The most recent swarm was in 2007, with 38 events between March and September. Since then the yearly counts have been mostly less than 5.
(Eleven events in 2012.)
Of course, the 'nine quakes' figure has increased since that post. In fact, there was another a minutes ago.
You can see them on the UW.LKVW.EHZ seismogram here. Just click the "previous" link to see all of the day's earlier shaking.
Here is a snapshot of the action from earlier in the day:
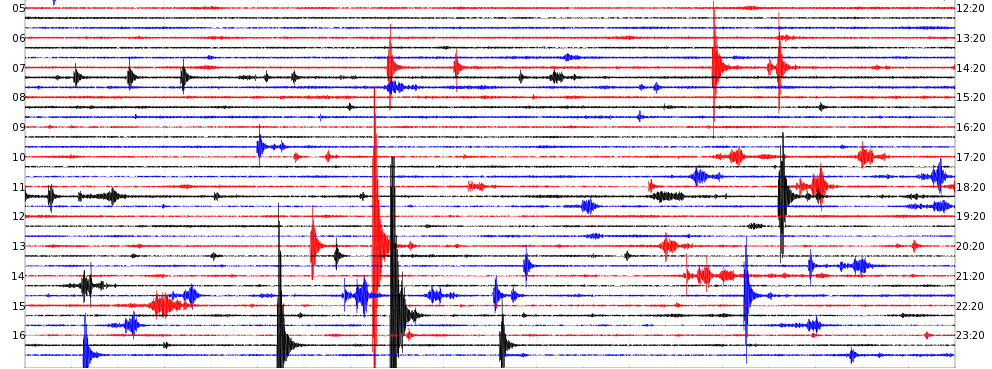
Looking at all of the channels, motion seems to be largest in the vertical direction, if just slightly.
.......................
Uploading pics isn't too hard once you get the hang of it.
Save them on your computer, then click the "TOOLS+" link near the top, right of your ATS screen.
After that page loads, you will see "ATS uploads" just below the "tools" header. Click that.
Now just click the "select image file" button, browse your computer's folders to find where you saved the image, and click "open". (.jpg files us less space than .png, which is useful, because I think the max size upload is 500 kb.) The image should show up in the area to the right.
Now click the image. There will be 3 different codes below it. Just copy your choice (I use thumbnails if the image is too wide to fit in the forum screen easily), and then paste the code in your post.
edit on 5/2/2013 by Olivine because: (no reason given)
reply to post by Olivine
Evidently the ipad won't accept adobe flash, which is needed to upload so ill go to the Facebook link you provided and try to upload there. Tomorrow ill attempt to transfer ipad and iPhone photos taken of the lake to my MacBook. I really want to share these pictures so will make this happen. Only passed about 4 cars on that entire 133 mile stretch but hoping others saw it as well who took note. Ill be working on it. It's the reason I took them - because I felt it was odd (have passed it before and it's never looked like this). Thanks for the link and instructions. At least now I know how to do this
Evidently the ipad won't accept adobe flash, which is needed to upload so ill go to the Facebook link you provided and try to upload there. Tomorrow ill attempt to transfer ipad and iPhone photos taken of the lake to my MacBook. I really want to share these pictures so will make this happen. Only passed about 4 cars on that entire 133 mile stretch but hoping others saw it as well who took note. Ill be working on it. It's the reason I took them - because I felt it was odd (have passed it before and it's never looked like this). Thanks for the link and instructions. At least now I know how to do this
reply to post by Dianec
Here is the list as at 0700 UTC today 03 May. I have marked the one on this list that are on your list. The missing one are most likelt because I use a latitude/longitude box to define Yellowstone so those others may fall outside that box.
I am assuming that if you can change data files you have the paid version of Earthquake 3D so I can't replicate what you have but, silly question, you have checked that the slider is not on one day??
Here is the list as at 0700 UTC today 03 May. I have marked the one on this list that are on your list. The missing one are most likelt because I use a latitude/longitude box to define Yellowstone so those others may fall outside that box.
Prov,Date/Time UTC,Latitude,Longitude,Magnitude,Depth(Km),Location
usgs,2013-05-02 20:03:34, 44.296, -110.656, 1.5, 9.6, 22Km Se Of Old Faithful Geyser. Wyoming
usgs,2013-05-02 20:00:41, 44.328, -110.697, 1.2, 11.6, 18Km Se Of Old Faithful Geyser. Wyoming
usgs,2013-05-02 19:36:31, 44.613, -110.350, 1.3, 2.7, 41Km Ene Of Old Faithful Geyser. Wyoming
usgs,2013-05-02 05:18:06, 44.301, -110.667, 1.5, 6.8, 21Km Se Of Old Faithful Geyser. Wyoming
usgs,2013-05-02 04:52:14, 44.314, -110.691, 1.9, 10.7, 19Km Se Of Old Faithful Geyser. Wyoming
usgs,2013-05-02 04:43:42, 44.325, -110.675, 1.1, 5.1, 19Km Se Of Old Faithful Geyser. Wyoming
usgs,2013-05-02 04:43:26, 44.327, -110.703, 1.5, 11.3, 17Km Se Of Old Faithful Geyser. Wyoming
usgs,2013-05-02 04:42:39, 44.310, -110.673, 1.4, 7.3, 20Km Se Of Old Faithful Geyser. Wyoming
usgs,2013-05-02 04:38:44, 44.313, -110.672, 1.1, 3.9, 20Km Se Of Old Faithful Geyser. Wyoming
usgs,2013-05-02 04:34:57, 44.307, -110.683, 1.0, 2.3, 20Km Se Of Old Faithful Geyser. Wyoming
usgs,2013-05-02 04:34:46, 44.317, -110.686, 1.0, 2.1, 19Km Se Of Old Faithful Geyser. Wyoming
usgs,2013-05-02 04:34:36, 44.309, -110.674, 1.5, 10.6, 20Km Se Of Old Faithful Geyser. Wyoming
usgs,2013-05-01 14:43:24, 44.820, -110.794, 1.6, 5.2, 30Km Ne Of West Yellowstone. Montana
usgs,2013-04-30 14:37:25, 44.647, -110.915, 1.1, 9.5, 15Km E Of West Yellowstone. Montana
usgs,2013-04-30 14:14:16, 44.645, -110.916, 1.0, 10.3, 15Km E Of West Yellowstone. Montana
usgs,2013-04-28 07:52:08, 44.786, -110.998, 1.2, 5.6, 16Km Nne Of West Yellowstone. Montana
usgs,2013-04-26 03:18:00, 44.491, -110.031, 1.0, 9.1, 63Km E Of Old Faithful Geyser. Wyoming
I am assuming that if you can change data files you have the paid version of Earthquake 3D so I can't replicate what you have but, silly question, you have checked that the slider is not on one day??
edit on 3/5/2013 by PuterMan because: Green decoration was required.
reply to post by muzzy
LOVE IT!
Ah dear friend unfortunately one can put a lot of work into things and get little recognition, but it is not the recognition that counts, it is the knowledge that you have done the job well and even if you don't know or are not made aware, have imparted useful information to a number of people albeit possibly a small number.
Like you I get few visits to my blog and the earthquake lists each day, yet there is no resource like it on the web for pure historical information from the Useless System for Guessing Seismicity. EMSC data is excellent and seems to be retained for ever and GFZ has little information retained for ever, but the Useless System for Guessing Seismicity removes the info in most instances after 30 days and that is where my blog comes in.
Do I mind that it is not well frequented? No not really. I do it for my own pleasure or I would not do it at all.
You are building up a massive resource and ONE DAY in the future your traffic will climb and your unique visual record of events WILL find an audience. Persevere my friend and don't get disheartened. it IS worth doing.
Useless System for Guessing Seismicity
LOVE IT!
Ah dear friend unfortunately one can put a lot of work into things and get little recognition, but it is not the recognition that counts, it is the knowledge that you have done the job well and even if you don't know or are not made aware, have imparted useful information to a number of people albeit possibly a small number.
Like you I get few visits to my blog and the earthquake lists each day, yet there is no resource like it on the web for pure historical information from the Useless System for Guessing Seismicity. EMSC data is excellent and seems to be retained for ever and GFZ has little information retained for ever, but the Useless System for Guessing Seismicity removes the info in most instances after 30 days and that is where my blog comes in.
Do I mind that it is not well frequented? No not really. I do it for my own pleasure or I would not do it at all.
You are building up a massive resource and ONE DAY in the future your traffic will climb and your unique visual record of events WILL find an audience. Persevere my friend and don't get disheartened. it IS worth doing.
edit on 3/5/2013 by PuterMan because: tags again
reply to post by PuterMan
Thank you for this list. I have it turned onto 7 days. It's all screwed up. It isn't showing even all of yesterday's unless I set it to 7 days. Yes I regretfully paid for it so one would think it would work. Even when I switch between USGS 1, USGS2, etc nothing changes. Good I have this site so I get better links to more accurate listings. Thanks again.
Thank you for this list. I have it turned onto 7 days. It's all screwed up. It isn't showing even all of yesterday's unless I set it to 7 days. Yes I regretfully paid for it so one would think it would work. Even when I switch between USGS 1, USGS2, etc nothing changes. Good I have this site so I get better links to more accurate listings. Thanks again.
reply to post by below
First welcome to ATS and of course to Quake Watch. Muzzy is your host on this thread, supported by a cast of quake nerds such as myself.
The video you posted appears to be false. This is not getting at you by the way - I am not shooting the messenger.
I can see no earthquake registered in that area in the last 7 days on USGS, and the largest quake on JMA - the Japan Met Agency - is a 4.4 ML and down by Fukushima so no where near that one shown in the video.
Doing a circular search on my database for earthquakes in a 70km radius of Lat 46.5E / Lon146N which covers the area in question, there has not been a Mag 7.2 in that area at least since 2009.
Running the same query through my ANSS database gives a max of Mag 6.1 in 2005 and an earlier 6.1 in 2002.
I have to conclude that the information in this video, which shows images from the Mag 9.1 tsunami and others, is at best wrong and downright misleading.
Unfortunately the 'person' that uploaded this video does not see fit to give any data about the earthquake he/she is posting which make the video worthless.
First welcome to ATS and of course to Quake Watch. Muzzy is your host on this thread, supported by a cast of quake nerds such as myself.
The video you posted appears to be false. This is not getting at you by the way - I am not shooting the messenger.
I can see no earthquake registered in that area in the last 7 days on USGS, and the largest quake on JMA - the Japan Met Agency - is a 4.4 ML and down by Fukushima so no where near that one shown in the video.
Doing a circular search on my database for earthquakes in a 70km radius of Lat 46.5E / Lon146N which covers the area in question, there has not been a Mag 7.2 in that area at least since 2009.
Date Latitude Longitude, Magnitude, Location, Distance from search point.
2009-06-17T11:12:13.000Z, 42.87740, 146.12410, 4.4000, off the coast of Hokkaido. Japan, 70.0
2009-07-29T12:22:49.000Z, 43.33890, 146.83520, 4.7000, Kuril Islands, 69.8
2009-08-15T10:45:50.000Z, 43.22120, 145.78200, 4.7000, Hokkaido. Japan region, 35.7
2009-09-10T09:29:20.000Z, 43.26850, 146.16960, 4.8000, Kuril Islands, 29.2
2009-10-11T01:12:19.000Z, 43.16140, 146.62120, 5.2000, Kuril Islands, 62.8
2009-11-24T05:25:45.000Z, 43.54440, 146.85760, 5.1000, Kuril Islands, 69.3
2010-01-15T15:44:48.000Z, 43.61670, 146.66130, 5.3000, Kuril Islands, 54.8
2010-04-04T08:35:41.000Z, 43.25370, 146.17180, 4.8000, Kuril Islands, 30.7
2010-06-05T05:22:03.000Z, 43.48310, 146.73550, 5.5000, Kuril Islands, 59.4
2010-09-27T16:13:38.000Z, 43.56760, 145.63170, 5.0000, Hokkaido. Japan region, 30.6
2010-10-02T07:17:43.000Z, 43.64630, 145.16960, 4.6000, Hokkaido. Japan region, 68.8
2010-11-19T04:01:59.000Z, 43.23300, 145.53830, 5.0000, Hokkaido. Japan region, 47.7
2010-12-05T15:51:07.000Z, 43.33970, 146.16300, 4.4000, Kuril Islands, 22.2
2011-05-14T22:30:31.000Z, 43.15880, 146.14960, 5.2000, Kuril Islands, 39.8
2011-06-14T12:48:55.000Z, 43.25260, 145.30100, 5.2000, Hokkaido. Japan region, 62.8
2011-08-19T02:28:50.000Z, 43.26080, 146.03060, 5.0000, Kuril Islands, 26.7
2011-10-09T16:34:08.000Z, 43.35530, 146.65500, 4.9000, Kuril Islands, 55.3
2012-02-28T14:30:10.000Z, 43.21070, 145.72090, 4.7000, Hokkaido. Japan region, 39.3
2012-03-19T10:23:20.000Z, 43.53920, 146.03460, 4.6000, Kuril Islands, 5.2
2012-05-04T05:34:09.000Z, 43.31210, 145.45990, 4.6000, Hokkaido. Japan region, 48.4
2012-07-04T02:37:47.000Z, 43.83700, 146.34900, 4.6000, Kuril Islands, 46.8
2012-07-15T14:34:46.000Z, 43.24400, 146.41000, 5.2000, Kuril Islands, 43.7
2012-12-03T17:48:28.000Z, 43.08200, 145.86900, 4.7000, Hokkaido. Japan region, 47.7
2013-01-23T21:34:32.000Z, 43.08700, 145.67800, 5.3000, Hokkaido. Japan region, 52.8
2013-02-16T22:17:31.000Z, 43.47900, 146.73500, 5.3000, Kuril Islands, 59.3
2013-04-05T19:24:58.000Z, 43.45800, 145.89300, 5.1000, Hokkaido. Japan region, 9.8
2013-04-18T03:53:05.000Z, 43.40660, 146.67970, 4.4000, Kuril Islands, 55.8
Running the same query through my ANSS database gives a max of Mag 6.1 in 2005 and an earlier 6.1 in 2002.
I have to conclude that the information in this video, which shows images from the Mag 9.1 tsunami and others, is at best wrong and downright misleading.
Unfortunately the 'person' that uploaded this video does not see fit to give any data about the earthquake he/she is posting which make the video worthless.
reply to post by Dianec
I note on the 3D program that when you click USGS it goes to the old out of date pages. I dropped the old 1 and 7 day text files a week or two ago as I think they are going to be phased out, despite that fact that a contact in USGS assured me they would not be.
Earthquake 3D should get modernised and start using the GeoJSON files. As a paying user you could perhaps contact the vendor and ask? I like the program, but an unreliable program is worse than no program.
www.ldeo.columbia.edu/~ekstrom/Research/SWD/current/RADB_SWD_grd.html
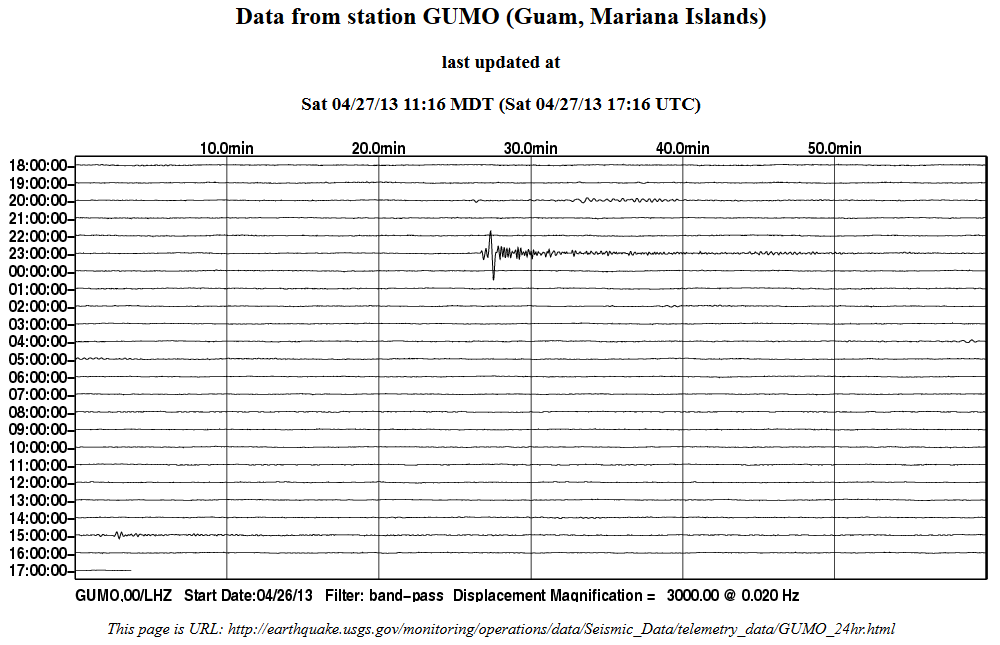
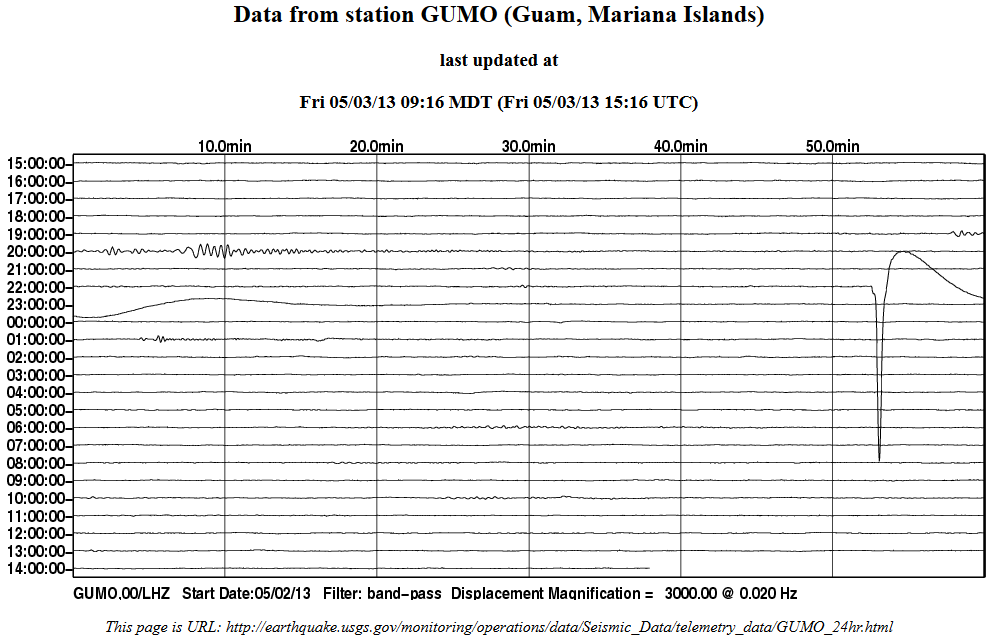
earthquake.usgs.gov/monitoring/operations/data/Seismic_Data/telemetry_data/GUMO_24hr.html
www.ceme.gsras.ru/cgi-bin/quake_state.pl?sta=20131602
earthquake.usgs.gov/monitoring/operations/data/Seismic_Data/telemetry_data/GUMO_24hr.html
Also visible on G.SANVU
www.seisme.nc/index.php?option=com_alertes&view=alertes&Itemid=184&ids=ird2013ipng&lang=en
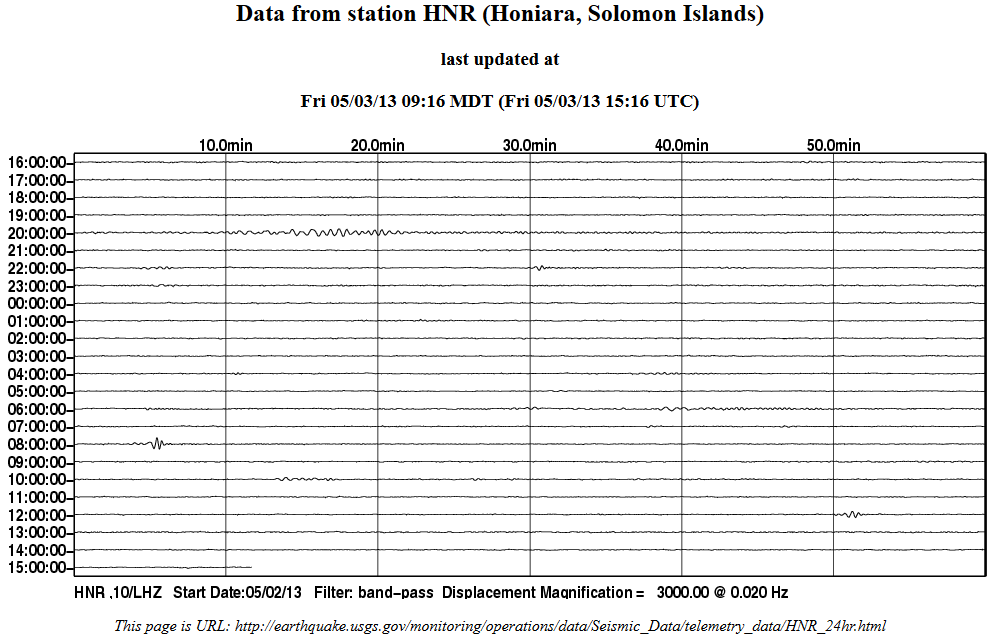
earthquake.usgs.gov/monitoring/operations/data/Seismic_Data/telemetry_data/HNR_24hr.html
2013 4 26 23 26 16.0 15.50 144.50 33.0 5.1 MARIANA ISLANDS REGION
earthquake.usgs.gov/monitoring/operations/data/Seismic_Data/telemetry_data/GUMO_24hr.html

www.ceme.gsras.ru/cgi-bin/quake_state.pl?sta=20131602
2013-05-03 01:03:00.4 17.42 147.11 50 17 - 4.8/14 2.5 Mariana Islands region
earthquake.usgs.gov/monitoring/operations/data/Seismic_Data/telemetry_data/GUMO_24hr.html

Also visible on G.SANVU
www.seisme.nc/index.php?option=com_alertes&view=alertes&Itemid=184&ids=ird2013ipng&lang=en
03/05/2013 08:01:58 4.8 Santa Cruz Islands
earthquake.usgs.gov/monitoring/operations/data/Seismic_Data/telemetry_data/HNR_24hr.html

I guess that 17 people were hurt on this one...
www.emsc-csem.org...
www.emsc-csem.org...
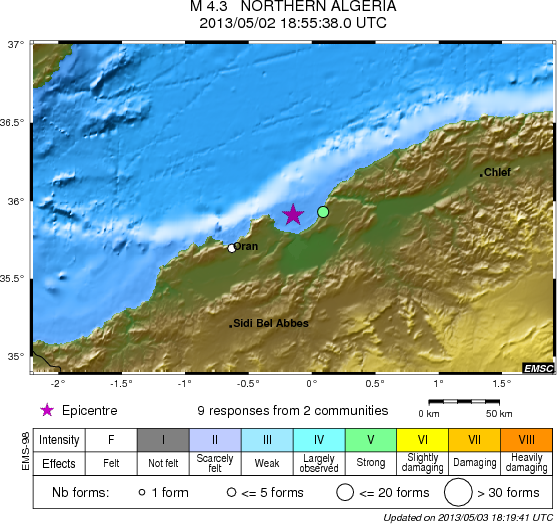
Magnitude Mw 4.3
Region NORTHERN ALGERIA
Date time 2013-05-02 18:55:38.0 UTC
Location 35.91 N ; 0.15 W
Depth 10 km
Distances 301 km W of Algiers, Algeria / pop: 1,977,663 / local time: 19:55:38.0 2013-05-02
21 km W of Mostaganem, Algeria / pop: 130,000 / local time: 19:55:38.0 2013-05-02
18 km NE of Aïn el Bya, Algeria / pop: 37,241 / local time: 19:55:38.0 2013-05-02
www.emsc-csem.org...
www.emsc-csem.org...
www.seisme.nc/index.php?option=com_alertes&view=alertes&Itemid=184&ids=ird2013iqha
www.geohazards.gov.vu/home/107?event=vgo2013iqhh
www.iris.edu/servlet/quackquery/plotcache/webicorder_fSANVU.G.00.HHN.2013.123.png
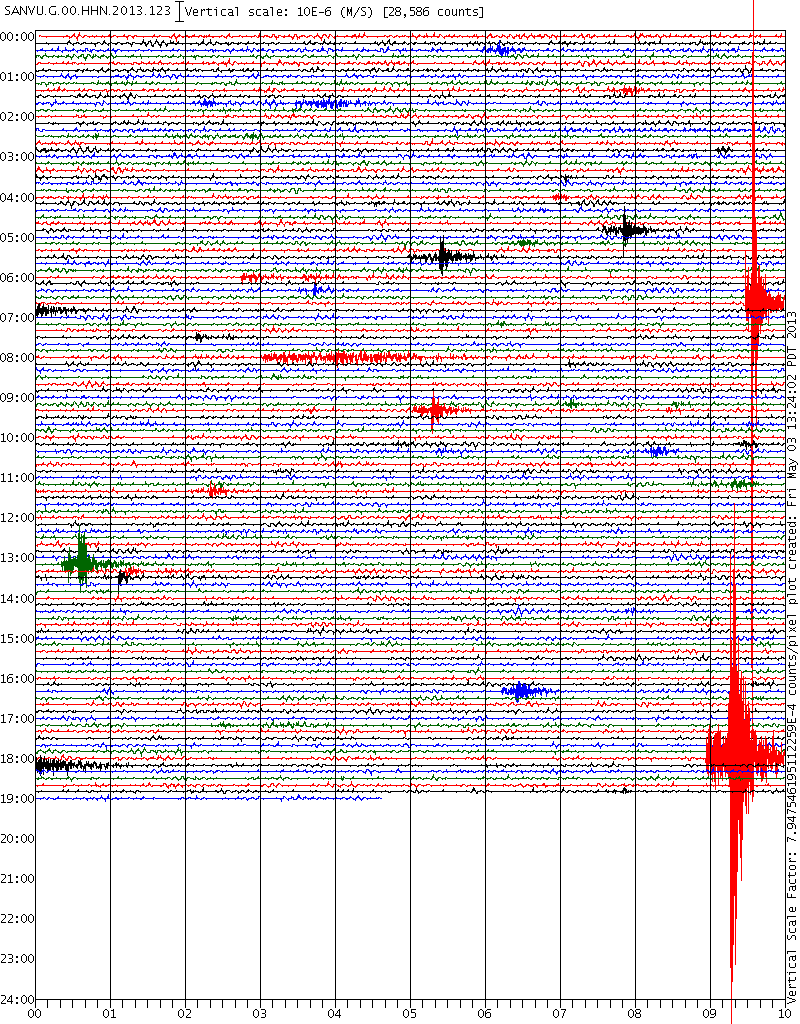
Vanuatu Islands
03/05/2013 18:08:15 (UTC) MLv 4.9 10 Km
Localisation
Vanuatu Islands
Latitude : 15.34 °S
Longitude : 169.86 °E
Depth : 10 Km
Description
Date : 03/05/2013 18:08:15 (UTC)
Magnitude : 4.9 MLv
Phase count : 12
RMS residual :2.52
Distance to nearest cities
288 kms of Luganville
314 kms of Port Vila
471 kms of Lénakel
678 kms of Wé
687 kms of Fayaoué
720 kms of Tadine
Agency : IRD - Event Id : ird2013iqha
www.geohazards.gov.vu/home/107?event=vgo2013iqhh
Detail of the Last Regional Earthquake
Earthquake detected by the Vanuatu-New Caledonia Seismic Network (VMGD/IRD)
Séisme détecté par le Réseau Sismique Vanuatu-Nelle Calédonie (VMGD/IRD)
Seismic event of 2013/05/03 at 18:08:28.2 UTC
Local time : 2013/05/04 at 05:08:28
in Vanuatu Islands
Magnitude : M 4.7
Depth : 167 km
Latitude : 15.63 S
Longitude : 168.39 E
Detected in : 36 min 49 sec
www.iris.edu/servlet/quackquery/plotcache/webicorder_fSANVU.G.00.HHN.2013.123.png

reply to post by PuterMan
Glad it made you laugh
I've always griped about USGS, its not only the constant changing of data, its the changing of url's all the time, and that was way before the newfangledinteractivmapthingyV1 and V2.
Its a real shame, as the people who do the actual geology work seem to be good at it, its the IT side that lets them down.
There seems to be an obsession everywhere to make everything fit into the screen of a handheld speaking device. For me personally I used to have the alert thing on one of my old Samsung phones, and did get a few messages that there was e.g. a 7.9 just happened up Tonga way, handy if you live by the sea and it was in your general area, but then you get home and go on the computer and find it has been downgraded to a 7.1 or something smaller, and there was never any risk of a tsunami and they got it wrong right from the start. Whats the point to it?
Generally speaking I have this urge that when I see something interesting I want to see more about it, it is people like me (an millions of others) who helped inspire a multi-billion$ industry on the Internet, "search" should be my middle name
So when you go delving into something and find the details have been deleted after 7 or 30 days its a big disappointment. USGS web side sux.
If it is any comfort to you I have used your QVS pages quite a few times to find stuff that USGS have let expire A very helpful resource indeed.
Yes indeed, I started doing those blogs for my own satisfaction too, and still do. I get a lot of downtime due to weather and it helps pass the time on a rainy day. OK so I got obsessed with it
It took years for my original NZ quake blog to get the numbers up, and now I get regular readers every day, what helps is if there is a big event, like the Christchurch 2010-2011 quakes, that brought in a few punters.
Thanks for the inspiration PM.
This has been a long time coming. an Iceland page
I've been watching the IMO web page for about 4 years, occasionally there is something interesting going on, like volcano's erupting
I got the idea back in 2009 for the timeline graphs I use on my NZ blog from these guys.
Over the years I have been fiddling around with those graphs, some had dots (aftershock sequences), others wiggles (Katla, Hengill and El Hierro on VolcanicTremor ) then I tried some bar graphs to show how many quakes per day or how much energy etc , but I was never happy with any of them really. Dots showed the detail but not the trend, and wiggles showed the trend but you couldn't see where or how many events were on the lines.
I think I might have found what I was trying to do, wiggles and dots
I think it gives a good overall picture of what happened, to make it work I have given the line a bit of a fade so it doesn't obliterate the detail of the dots (events)
So seeing as I have finally got around to doing Iceland maps I started here with the new style of graph.
 [color=8BB381](click image for Iceland page on eqarchives.wordpress,
opens in new tab/window)
[color=8BB381](click image for Iceland page on eqarchives.wordpress,
opens in new tab/window)
Geez that Grimsey series put out some quakes over a couple of days!
of course I haven't mapped or plotted below magnitude 1, there are approx 600 of those per month in the data as well.
I've been watching the IMO web page for about 4 years, occasionally there is something interesting going on, like volcano's erupting
I got the idea back in 2009 for the timeline graphs I use on my NZ blog from these guys.
Over the years I have been fiddling around with those graphs, some had dots (aftershock sequences), others wiggles (Katla, Hengill and El Hierro on VolcanicTremor ) then I tried some bar graphs to show how many quakes per day or how much energy etc , but I was never happy with any of them really. Dots showed the detail but not the trend, and wiggles showed the trend but you couldn't see where or how many events were on the lines.
I think I might have found what I was trying to do, wiggles and dots
I think it gives a good overall picture of what happened, to make it work I have given the line a bit of a fade so it doesn't obliterate the detail of the dots (events)
So seeing as I have finally got around to doing Iceland maps I started here with the new style of graph.
Geez that Grimsey series put out some quakes over a couple of days!
of course I haven't mapped or plotted below magnitude 1, there are approx 600 of those per month in the data as well.
edit on 3-5-2013 by muzzy
because: (no reason given)
reply to post by PuterMan
Do you have a better link so I can have a reliable page to visit for updates? On earthquakes that is.
Do you have a better link so I can have a reliable page to visit for updates? On earthquakes that is.
ok, I feel very dizzy right now. I always said, that most of the times I have this dizziness, there will be a big quake within the next few hours.
I don't like predictions, but there are two possibilities: I am right or it is just the alcohol from the last night
I don't like predictions, but there are two possibilities: I am right or it is just the alcohol from the last night
reply to post by Dianec
He is probably asleep now, I'm on the day shift
If you go back to the first page of this Topic there is a list to choose from.
If you are just after USA quakes you are stuck with USGS, but you can get more refined and reliable data from the State feeders listed on this page here
He is probably asleep now, I'm on the day shift
If you go back to the first page of this Topic there is a list to choose from.
If you are just after USA quakes you are stuck with USGS, but you can get more refined and reliable data from the State feeders listed on this page here
Just about 13 days (309hrs) after the Y'an, Sichaun, China 7.0Ms quake.
I wonder how they are getting on?
I see the latest download available for the first 72 hours looks a bit different, a whole bunch of >1.5 mag. have been deleted completely. I haven't been through the lists to see what has changed in detail but I did look for the deleted quakes by date and time and they weren't there. Smallest aftershock is now 1.8ML, and there were just 5 of those.
Seems strange, I was expecting the other way around (more >1.5 added).
So at this point 935 aftershocks total,
in the first 72 hours 570 aftershocks,
thats up from 557 showing at the 88hrs mark, despite those
new topics
-
WF Killer Patents & Secret Science Vol. 1 | Free Energy & Anti-Gravity Cover-Ups
General Conspiracies: 11 seconds ago -
Hurt my hip; should I go see a Doctor
General Chit Chat: 49 minutes ago -
Israel attacking Iran again.
Middle East Issues: 1 hours ago -
Michigan school district cancels lesson on gender identity and pronouns after backlash
Education and Media: 2 hours ago -
When an Angel gets his or her wings
Religion, Faith, And Theology: 2 hours ago -
Comparing the theology of Paul and Hebrews
Religion, Faith, And Theology: 3 hours ago -
Pentagon acknowledges secret UFO project, the Kona Blue program | Vargas Reports
Aliens and UFOs: 4 hours ago -
Boston Dynamics say Farewell to Atlas
Science & Technology: 4 hours ago -
I hate dreaming
Rant: 5 hours ago -
Man sets himself on fire outside Donald Trump trial
Mainstream News: 7 hours ago
top topics
-
The Democrats Take Control the House - Look what happened while you were sleeping
US Political Madness: 8 hours ago, 18 flags -
In an Historic First, In N Out Burger Permanently Closes a Location
Mainstream News: 10 hours ago, 16 flags -
A man of the people
Medical Issues & Conspiracies: 15 hours ago, 11 flags -
Biden says little kids flip him the bird all the time.
Politicians & People: 7 hours ago, 8 flags -
Man sets himself on fire outside Donald Trump trial
Mainstream News: 7 hours ago, 7 flags -
Pentagon acknowledges secret UFO project, the Kona Blue program | Vargas Reports
Aliens and UFOs: 4 hours ago, 6 flags -
Israel attacking Iran again.
Middle East Issues: 1 hours ago, 5 flags -
Michigan school district cancels lesson on gender identity and pronouns after backlash
Education and Media: 2 hours ago, 4 flags -
4 plans of US elites to defeat Russia
New World Order: 17 hours ago, 4 flags -
Boston Dynamics say Farewell to Atlas
Science & Technology: 4 hours ago, 4 flags
active topics
-
WF Killer Patents & Secret Science Vol. 1 | Free Energy & Anti-Gravity Cover-Ups
General Conspiracies • 0 • : 727Sky -
Boston Dynamics say Farewell to Atlas
Science & Technology • 5 • : Caver78 -
Hurt my hip; should I go see a Doctor
General Chit Chat • 7 • : randomtangentsrme -
Biden says little kids flip him the bird all the time.
Politicians & People • 16 • : stelth2 -
When an Angel gets his or her wings
Religion, Faith, And Theology • 2 • : stelth2 -
MULTIPLE SKYMASTER MESSAGES GOING OUT
World War Three • 51 • : Zaphod58 -
Israel attacking Iran again.
Middle East Issues • 19 • : stelth2 -
Pentagon acknowledges secret UFO project, the Kona Blue program | Vargas Reports
Aliens and UFOs • 7 • : Ophiuchus1 -
-@TH3WH17ERABB17- -Q- ---TIME TO SHOW THE WORLD--- -Part- --44--
Dissecting Disinformation • 549 • : cherokeetroy -
In an Historic First, In N Out Burger Permanently Closes a Location
Mainstream News • 9 • : VariedcodeSole