It looks like you're using an Ad Blocker.
Please white-list or disable AboveTopSecret.com in your ad-blocking tool.
Thank you.
Some features of ATS will be disabled while you continue to use an ad-blocker.

Arctic Ice Rotten to the Core
page: 9share:
Of course here is the NY Times article form the converted GW skeptic.
www.nytimes.com...
The Conversion of a Climate-Change Skeptic
I stumbled across this looking for more info on Methane and the MWP. I read this when it first came out, and thought I would post it.
www.nytimes.com...
The Conversion of a Climate-Change Skeptic
CALL me a converted skeptic. Three years ago I identified problems in previous climate studies that, in my mind, threw doubt on the very existence of global warming. Last year, following an intensive research effort involving a dozen scientists, I concluded that global warming was real and that the prior estimates of the rate of warming were correct. I’m now going a step further: Humans are almost entirely the cause.
I stumbled across this looking for more info on Methane and the MWP. I read this when it first came out, and thought I would post it.
Here is a very legitimate looking paper on methane and global warming. You can join and read the full article, but I had problems with the website
loading too slowly.
www.researchgate.net...
This looks like very recent data. It would be interesting to find out more about this research.
www.researchgate.net...
Journal Article
Temperature and methane records over the last 2 ka in Dasuopu ice core
Tandong Yao, L. G. Thompson, Keqin Duan, Baiqing Xu, Ninglian Wang, Jianchen Pu, Lide Tian, Weizhen Sun, Shichang Kang, Xiang Qin
Science in China Series D Earth Sciences (impact factor: 1.59). 04/2012; 45(12):1068-1074. DOI:10.1360/02yd9104
0 VOTES · 0 BOOKMARKS
ABSTRACT
High resolution δ18O and methane records over the last 2ka have been reconstructed from Dasuopu ice core recovered from the Himalayas. Analysis
shows that the δ18O record correlates well with the Northern Hemispheric temperature, Dunde ice core record, and with temperature record in
eastern China. The warming trend detected in δ18O record from the last century is similar to that during the Medieval warm period. There is a dramatic increasing in methane
concentration in the Dasuopu ice core, which reached 1031 nmol ⋅ mol-1 in 1997. Moreover, methane concentration in the Dasuopu ice core is about 15%-20% higher than that in Antarctica and Greenland.
There is a positive correlation between methane concentration and δ18O in Dasuopu ice core.
SIMILAR PUBLICATIONS
Seasonal air temperature variations retrieved from a Geladaindong ice core, Tibetan Plateau
Yongjun Zhang, Shichang Kang, Dahe Qin, Jiawen Ren, Yulan Zhang, Bjorn Grigholm, Paul Mayewski
17(4):431-441. · 0.83 Impact Factor
Variations in air temperature during the last 100 years revealed by δ18O in the Malan ice core from the Tibetan Plateau
Ninglian Wang, Tandong Yao, Jianchen Pu, Yongliang Zhang, Weizhen Sun, Youqing Wang
48(19):2134-2138. · 1.32 Impact Factor
Recent temperature increase recorded in an ice core in the source region of Yangtze River
ShiChang Kang, YongJun Zhang, DaHe Qin, JiaWen Ren, QiangGong Zhang, Bjorn Grigholm, Paul A. Mayewski
52(6):825-831. · 1.32 Impact Factor
A shallow ice core re-drilled on the Dunde Ice Cap, western China: recent changes in the Asian high mountains
Nozomu Takeuchi, Takayuki Miyake, Fumio Nakazawa, Hideki Narita, Koji Fujita, Akiko Sakai, Masayoshi Nakawo, Yoshiyuki Fujii, Keqin Duan, Tandong Yao
Environmental Research Letters. 4(4):045207. · 3.63 Impact Factor
Dasuopu ice core record of atmospheric methane over the past 2000 years
Baiqing Xu, Tandong Yao
44(8):689-695. · 1.59 Impact Factor
Data provided are for informational purposes only. Although carefully collected, accuracy cannot be guaranteed. The impact factor represents a rough estimation of the journal's impact factor and does not reflect the actual current impact factor. Publisher conditions are provided by RoMEO. Differing provisions from the publisher's actual policy or licence agreement may be applicable.
This looks like very recent data. It would be interesting to find out more about this research.
edit on 29-9-2012 by poet1b because:
Typo
Originally posted by poet1b
reply to post by ElectricUniverse
It is the phony baloney scientists in your links that get paid big bucks to put out false evidence about global warming.
All my links are independent research coming to the same conclusion, and that is easy to see because they actually explain how their research was done.
None of your links do absolutely nothing to refute link on the first page that tells us we now have soil exposed that has been frozen for millions of years.
PROVE IT... I proved that your Mann is a stooge for Al Gore with EVIDENCE, now prove that those scientists I gave links to "are paid big bucks to put out false evidence about global warming"...
BTW, your links are not "independent", several if not all have Mann as a researcher, the same Mann who is nothing but a mouthpiece for Al Gore...
I have also proven that the main culprits at the IPCC who have been claiming "mankind is to blame" have put up false information about Climate Change to FORCE governments to bow to their agenda, but they were caught red handed...
BTW, have you heard about CLIMATEGATE?... The fact that Prof. Jones, Trembath, et al were exchanging emails in which they propose ways to legally and ilegally stop any research that contradicts their views from being published and to not release data to the public?...
The scientist behind the bogus claim in a Nobel Prize-winning UN report that Himalayan glaciers will have melted by 2035 last night admitted it was included purely to put political pressure on world leaders.
Dr Murari Lal also said he was well aware the statement, in the 2007 report by the Intergovernmental Panel on Climate Change (IPCC), did not rest on peer-reviewed scientific research.
In an interview with The Mail on Sunday, Dr Lal, the co-ordinating lead author of the report’s chapter on Asia, said: ‘It related to several countries in this region and their water sources. We thought that if we can highlight it, it will impact policy-makers and politicians and encourage them to take some concrete action.
‘It had importance for the region, so we thought we should put it in.’
Dr Lal’s admission will only add to the mounting furore over the melting glaciers assertion, which the IPCC was last week forced to withdraw because it has no scientific foundation.
According to the IPCC’s statement of principles, its role is ‘to assess on a comprehensive, objective, open and transparent basis, scientific, technical and socio-economic information – IPCC reports should be neutral with respect to policy’.
.........
www.dailymail.co.uk...
www.abovetopsecret.com...
www.abovetopsecret.com...
A BRITISH climate scientist at the centre of a controversy over leaked emails is facing fresh claims that he sought to hide problems in temperature data on which his work was based.
An investigation of more than 2000 emails apparently hacked from the University of East Anglia's climatic research unit has found evidence that a series of measurements from Chinese weather stations was seriously flawed.
Climate scientist Phil Jones and a collaborator have been accused of scientific fraud for attempting to suppress data that could cast doubt on a key 1990 study on the effect of cities on warming.
Dr Jones withheld the information requested under British freedom of information laws. Subsequently a senior colleague told him he feared that Dr Jones' collaborator, Wei-chyung Wang of the University at Albany, had ''screwed up''.
The apparent attempts to cover up problems with temperature data from the Chinese weather stations provide the first link between the email scandal and the UN's embattled climate science body, the Intergovernmental Panel on Climate Change, as a paper based on the measurements was used to bolster IPCC statements about rapid global warming in recent decades.
The IPCC has already been criticised for its use of information that had not been rigorously checked - in particular a false claim that all Himalayan glaciers could melt by 2035.
Of 105 freedom of information requests to the University of East Anglia over the climatic research unit, which Dr Jones led until the end of December, only 10 had been released in full.
..............
www.theage.com.au...
In at least one of the emails they mention ways that they can use not to release information, and in one of the emails Jones himself jokes saying...:
....If they ever hear there is a Freedom of Information Act now in the UK, I think Ill delete the file rather than send to anyone."
www.cbsnews.com...
Not to mention the fact that CRU, and Jones had deleted their raw temperature data.
We Lost the Original Data
Steve McIntyre, of ClimateAudit, is a determined individual. While this may be no fun for those who fall under his focus and happen to have something to hide, more sunlight on climate science cannot be a bad thing.
...
Obviously, the ability to do good research depends upon good data with known provenance. At the time WMO Resolution 40 was widely hailed in the atmospheric sciences community as a major step forward in data sharing and availability in support of both operations and research.
Thus it is with some surprise to observe CRU going through bizarre contortions to avoid releasing its climate data to Steve McIntyre. They first told him that he couldn't have it because he was not an academic. I found this to be a petty reason for keeping data out of the hands of someone who clearly wants to examine it for scholarly purposes. So, wanting to test this theory I asked CRU for the data myself, being a "real" academic. I received a letter back from CRU stating that I couldn't have the data because "we do not hold the requested information."
I found that odd. How can they not hold the data when they are showing graphs of global temperatures on their webpage? However, it turns out that CRU has in response to requests for its data put up a new webpage with the following remarkable admission (emphasis added):
We are not in a position to supply data for a particular country not covered by the example agreements referred to earlier, as we have never had sufficient resources to keep track of the exact source of each individual monthly value. Since the 1980s, we have merged the data we have received into existing series or begun new ones, so it is impossible to say if all stations within a particular country or if all of an individual record should be freely available. Data storage availability in the 1980s meant that we were not able to keep the multiple sources for some sites, only the station series after adjustment for homogeneity issues.[b/ We, therefore, do not hold the original raw data but only the value-added (i.e. quality controlled and homogenized) data.
Say what?! CRU has lost track of the original data that it uses to create its global temperature record!? Can this be serious? So not only is it now impossible to replicate or reevaluate homogeneity adjustments made in the past -- which might be important to do as new information is learned about the spatial representativeness of siting, land use effects, and so on -- but it is now also impossible to create a new temperature index from scratch. CRU is basically saying, "trust us." So much for settling questions and resolving debates with empirical information (i.e., science).
...
rogerpielkejr.blogspot.com...
edit on 29-9-2012 by ElectricUniverse because: errors
reply to post by ElectricUniverse
See link about former skeptic. Already proved.
Now your explanation as to why we are seeing soil exposed that has not been exposed for over a million years.
See link about former skeptic. Already proved.
Now your explanation as to why we are seeing soil exposed that has not been exposed for over a million years.
reply to post by ElectricUniverse
Its funny, I’ve read a few of your posts and I’ve just realized you use the exact same argument methods as Fundamentalist Christians/ Young Earth Creationists….
You cherry pick one off scientific reports which seem to support your claims and completely ignore the overwhelming reports to the contrary. You flood forums with random scientific data which appear to further your cause in an effort to overwhelm the layperson who doesn’t know an awful lot about the science behind the facts yet then you make claims such as the main centers which emit carbon should be warmer with simplistic claims that ‘it’s hotter closer to the fire’ showing you really don’t understand the first thing about climatology (fyi CO2 is not a heat source itself, it causes the atmosphere to retain heat). You say you’ve posted hundreds of papers and have actually read 1000’s yet you seem to rotate through the same dozen or so probably cos that’s all that really exist.
In order to end a lot of the falsities you seem to enjoy spreading throughout this forum I will be addressing each one of the claims you bring up in this thread one at a time.
This is a blatant lie. There would be approximately a dozen at the very best which indicate the possibility that it was equal to or slightly higher in various localised areas.
False. Neither the Roman Ice Age nor the Medieval Ice Age have been shown to be any hotter than temperatures are at present except in localised areas. There's no dispuiting that it is getting hotter, yet Antartica has actually been slightly cooler. This proves nothing. And even if these claims were shown to be tre it would still prove nothing because there is nothing except anthropogenic carbon which can account for the current temperature rise. Even some of the main sceptics of the IPCC such as Steve Mckintyre of Climate Audit make no claims about
This data is in part is based off the misleading claims of a geologist (not a climatologist) called Don Easterbrook who presented a paper at a 2010 climate skeptic conference where he actually fraudulently altered graphs to try and bolster his claims. See below.
hot-topic.co.nz...
Also as another poster has pointed out the ice on Greenland has retreated well beyond where it was when the Vikings lived there, and this has only been in the past decade. This actually really is the key. Even if everything you claim is true (which it isn’t), you still do not and cannot claim that that temperatures are not rising at present. All the graphs you have posted show this. The difference between natural temperature variations in the past and the present day is that these changes occurred slowly over many hundreds if not thousands of years, not in order of decades. Plants and animals had time to adapt; now they do not. This is further exacerbated by the fact that we have completely fragmented there environment so they now cannot move to higher or lower latitudes simply cos there are manmade obstacles blocking their retreat and/or there is no longer anywhere to move to.
Take a look at this graph you posted, not only are there far more hotter periods on average in the Current Warm period than the Medieval Warm Period, but it also conveniently leaves out the past decade where temperatures have been far hotter than anything ever before seen in recorded history.
[atsimg]http://files.abovetopsecret.com/images/member/a357061c7174.jpg[/atsimg]
As for the Roman Warming Period, so little is known about this that even the leading climate change skeptics won’t touch it with a 10 foot pole.
Next…
Not only is tree ring data pretty ‘iffy’ from the start, but even if it is accurate it only shows localized temperature variations. Even the famous ‘hockey stick graph’ produced by the IPCC relied heavily on tree ring data and this has been torn apart by many scientists in the past few years. Others who have studied tree ring data still dispute your claim
Once again this is a single study based of stalactites in a cave in a valley which are well known to have anomalous microclimates.
Seriously…. A study which is nearly 20 years old regarding the cultivation practices of medieval Chinese farmers…
This is the one study I’ll give credence to. However once again it is only ‘one’ study and again I’ll remind everyone of the difference between local and global. Also sea level temperatures are a vastly different ball game to land based temperatures.
No one has ever doubted this
No, they have just suggested that this is a mechanism for past climate change events and I can guarantee very few of them would be willing to have their names attached to anything you’re trying to claim.
Nothing here so far that even touches on Anthropogenic Global Warming.
Let’s continue…
What do expect from government bueracracy? I don’t trust them either. There are plenty of skeptics who have been caught lying as well as can be seen above. Nothing new there.
You say you have 100’s…? Oh please share, cos as mentioned above you seem to cut and paste just a few dozen in all your posts which really don’t prove anything much at all unless you want to know paleo temperatures in South African Caves or obscure forests in the Netherlands.
As for your ‘Climatgate’ claims, 8 separate committees have investigated this incident and NONE found any evidence of wrong doing or coverups. The main finding that came out was that there simply needs to be a little more transparency in their methods which is good news for science as a whole.
Like your scientific reports, all of the media snippets were taken out of context and are you really going to trust a group who would use criminal means to try and prove their point anyway…?
I’d love to see the actual paper instead simply the ‘choice excerpts’
At any rate I’ll raise you your 650 and give you 3000
Wiki and NASA say we’re already in the cloud…
Yet another reason not to ignore the overwhelming evidence in favour of anthropogenic climate change
You say somewhere you’ve been doing this here since 2004 and instantly I thought of 2 things. Firstly in that time you could have earned 2 science degrees so that you might actually have an idea about what you’re talking about. Secondly….what a waste. Imagine if you put as much time into fighting for a cause that actually mattered...
Finally I’ll leave you with two things…
The words of one of the one of the most ardent climate change skeptic – Richard Muller – who actually took the time to look at the research and has since completely reversed his opinion
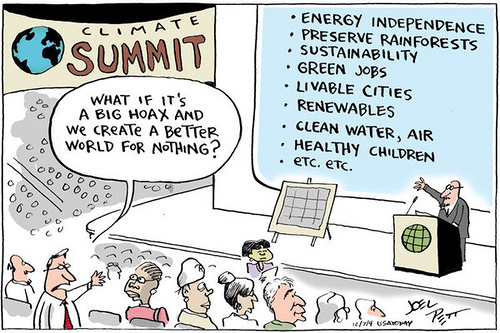
and this little comic which really speaks volumes…
Its funny, I’ve read a few of your posts and I’ve just realized you use the exact same argument methods as Fundamentalist Christians/ Young Earth Creationists….
You cherry pick one off scientific reports which seem to support your claims and completely ignore the overwhelming reports to the contrary. You flood forums with random scientific data which appear to further your cause in an effort to overwhelm the layperson who doesn’t know an awful lot about the science behind the facts yet then you make claims such as the main centers which emit carbon should be warmer with simplistic claims that ‘it’s hotter closer to the fire’ showing you really don’t understand the first thing about climatology (fyi CO2 is not a heat source itself, it causes the atmosphere to retain heat). You say you’ve posted hundreds of papers and have actually read 1000’s yet you seem to rotate through the same dozen or so probably cos that’s all that really exist.
In order to end a lot of the falsities you seem to enjoy spreading throughout this forum I will be addressing each one of the claims you bring up in this thread one at a time.
Thousands of research papers from all over the world have proven the Medieval and Roman Warm Period were much warmer than the late 20th and 21st century, and no matter what ignorant people like yourself like to claim posting the crackpot theories from known liars like Mann, you won't change what those thousands of research papers say.
This is a blatant lie. There would be approximately a dozen at the very best which indicate the possibility that it was equal to or slightly higher in various localised areas.
Was "Global Warming" "the most pressing thing" to the Vikings when the ice was even more receded than it is now?....
Was "Global Warming" "the most pressing thing" in the times of the Romans during the Roman Warming period when it was WARMER GLOBALLY than it is now?....
False. Neither the Roman Ice Age nor the Medieval Ice Age have been shown to be any hotter than temperatures are at present except in localised areas. There's no dispuiting that it is getting hotter, yet Antartica has actually been slightly cooler. This proves nothing. And even if these claims were shown to be tre it would still prove nothing because there is nothing except anthropogenic carbon which can account for the current temperature rise. Even some of the main sceptics of the IPCC such as Steve Mckintyre of Climate Audit make no claims about
Are you saying the 15th century was warmer than the present?
No, we are saying that the hockey stick graph used by IPCC provides no statistically significant information about how the current climate compares to that of the 15th century (and earlier). And notwithstanding that, to the extent readers consider the results informative, if a correct PC method and the unedited version of the Gasp” series are used, the graph used by the IPCC to measure the average temperature of the Northern Hemisphere shows values in the 15th century exceed those at the end of the 20th century.
Does your work disprove global warming?
We have not made such a claim. There is considerable evidence that in many locations the late 20th century was generally warmer than the mid-19th century. However, there is also considerable evidence that in parts of the Northern Hemisphere, the mid-19th century was exceptionally cold. We think that a more interesting issue is whether the late 20th century was warmer than periods of similar length in the 11th century. We ourselves do not opine on this matter, other than to say that the MBH results relied upon so heavily by the Intergovernmental Panel on Climate Change in its 2001 report are invalid.
climateaudit.org...
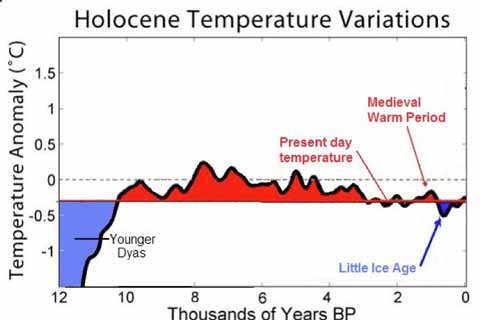
This data is in part is based off the misleading claims of a geologist (not a climatologist) called Don Easterbrook who presented a paper at a 2010 climate skeptic conference where he actually fraudulently altered graphs to try and bolster his claims. See below.
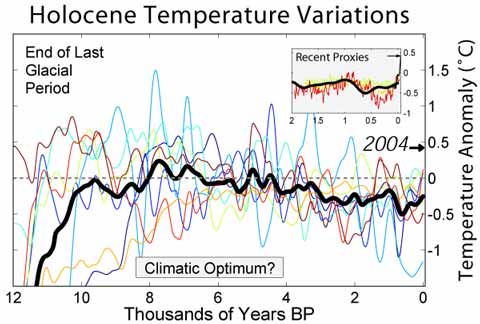
Looking through Easterbrook’s slides, it seems he has taken a graph of Holocene temperature variations prepared by Global Warming Art (used at Wikipedia), and altered it to fraudulently bolster his case
When I saw that graphic, it struck me as strangely familiar. The typefaces and presentation are reminiscent of graphs prepared by Robert A Rohde for Global Warming Art. So I checked, and this is what I found:
Here’s the source page. Note that the typeface and scaling of the axes are identical, save for the y-axis being swapped over to the left. The thick black curve, the median of the reconstructions Rohde has used, is identical. Here’s a “blink” comparison:
Easterbrook has altered the graph considerably. The dotted line across the graph marks the zero anomaly, which Rohde has set at the mid-20th century average values. To put current temperatures in perspective, he has provided an arrow indicating 2004’s temperature and a box providing an expanded scale for the last 2000 years. Easterbrook has erased that arrow, all the individual reconstructions and the detail box, and drawn a new line at 0.25ºC below zero. This he labels “present day temperature”. Areas above the new line are infilled in red, those below in blue. Easterbrook has quite deliberately altered the graph to reduce “current temperatures” by 0.75ºC and make the curve fit his storyline. The original suggests that current temperatures are comparable to, perhaps higher than the warmest period of the Holocene, the post-glacial climatic optimum 8000 years ago. Easterbrook’s version gives the impression that for most of the last 10,000 years temperature has been warmer than today. It’s interesting to note that Easterbrook has added a pointer to the Younger Dryas, but has managed to misspell it “Dyas”.
hot-topic.co.nz...
Also as another poster has pointed out the ice on Greenland has retreated well beyond where it was when the Vikings lived there, and this has only been in the past decade. This actually really is the key. Even if everything you claim is true (which it isn’t), you still do not and cannot claim that that temperatures are not rising at present. All the graphs you have posted show this. The difference between natural temperature variations in the past and the present day is that these changes occurred slowly over many hundreds if not thousands of years, not in order of decades. Plants and animals had time to adapt; now they do not. This is further exacerbated by the fact that we have completely fragmented there environment so they now cannot move to higher or lower latitudes simply cos there are manmade obstacles blocking their retreat and/or there is no longer anywhere to move to.
Take a look at this graph you posted, not only are there far more hotter periods on average in the Current Warm period than the Medieval Warm Period, but it also conveniently leaves out the past decade where temperatures have been far hotter than anything ever before seen in recorded history.
[atsimg]http://files.abovetopsecret.com/images/member/a357061c7174.jpg[/atsimg]
As for the Roman Warming Period, so little is known about this that even the leading climate change skeptics won’t touch it with a 10 foot pole.
Next…
The new tree-ring evidence from Torneträsk suggests that this “Medieval Warm Period” in northern Fennoscandia was much warmer than previously recognized.
Not only is tree ring data pretty ‘iffy’ from the start, but even if it is accurate it only shows localized temperature variations. Even the famous ‘hockey stick graph’ produced by the IPCC relied heavily on tree ring data and this has been torn apart by many scientists in the past few years. Others who have studied tree ring data still dispute your claim
But it's old news that Northern Europe experienced a natural warm period 2,000 years ago and during the 11th century. Not much is known about the Roman period, but the medieval warm spell primarily resulted from a decrease in volcanic activity and an increase in solar activity, Wilson said. Volcanic ash in the atmosphere tends to block the sun, decreasing Earth's surface temperature.
The current warming, on the other hand, has nothing to do with volcanoes. "None of this changes the fact that the current warming can't be modeled based on natural forces alone," he said. "Anthropogenic [greenhouse gas] emissions are the predominant forces in the late 20th century and early 21st century period."
That Scandinavia may have been slightly warmer in the 11th century than today also doesn't change the fact that the world, as a whole, is warmer now. "This data is spatially specific. You would expect to see this trend in northern Scandinavia, but not in the Alps," Wilson said. "Almost all models show that the current global warming is probably warmer overall than that warming."
Finally, according to Gavin Schmidt, a NASA climate scientist, the tree rings show what mounds of other data have shown as well: For the past few millennia, Earth's northern latitudes had been cooling down overall. "Similarly, we expect that over the same period the tropics should have warmed slightly," Schmidt said in an email. These trends resulted from shifts in the Earth's orbit on thousand-year-long time-scales.
But Wilson, Schmidt and the vast majority of climate scientists agree: human-caused warming of the entire globe now overwhelms those subtle, regional heat redistributions. World temperatures are now pushing in only one direction: up.
www.lifeslittlemysteries.com...
The proxy climate record has been constituted from oxygen and carbon isotope and colour density data obtained from a well-dated stalagmite derived from Cold Air Cave in the Makapansgat Valley.
The climate of the interior of South Africa was around 1oC cooler in the Little Ice Age and may have been over 3°C higher than at present during the extremes of the medieval warm period.
Once again this is a single study based of stalactites in a cave in a valley which are well known to have anomalous microclimates.
Evidence for the existence of the medieval warm period in China
Journal Climatic Change
Publisher Springer Netherlands
ISSN 0165-0009 (Print) 1573-1480 (Online)
Issue Volume 26, Numbers 2-3 / March, 1994
……………..
The collected documentary records of the cultivation of citrus trees andBoehmeria nivea (a perennial herb) have been used to produce distribution maps of these plants for the eighth, twelfth and thirteenth centuries A.D. The northern boundary of citrus andBoehmeria nivea cultivation in the thirteenth century lay to the north of the modern distribution. During the last 1000 years, the thirteenth-century boundary was the northernmost. This indicates that this was the warmest time in that period. On the basis of knowledge of the climatic conditions required for planting these species, it can be estimated that the annual mean temperature in south Henan Province in the thirteenth century was 0.9–1.0°C higher than at present.
Seriously…. A study which is nearly 20 years old regarding the cultivation practices of medieval Chinese farmers…
suggesting that annual coastal water temperatures were 3 to 4° C warmer than today. The bulk δ18O values show a marked trend towards more positive values. 24 fossil shells have bulk δ18O values 0.2permil to 0.7permil more positive than modern bivalves from the same location. These results suggest that the coastal waters off northwest Florida were warmer and less saline compared to today and attest of considerable differences of the regional climate and hydrological balance during the Medieval Warm Period and Roman Warm Period.
This is the one study I’ll give credence to. However once again it is only ‘one’ study and again I’ll remind everyone of the difference between local and global. Also sea level temperatures are a vastly different ball game to land based temperatures.
However, two recent papers have suggested that we may need to look outside the Earth System and even outside our local planetary system for the possible origins of climate change, both on a decadal scale and over longer timescales of hundreds of millions of years
No one has ever doubted this
The above are just osome of hundreds of peer-review research papers, from thousands of scientists who have linked Solar System and Galactic events, among other NATURAL events as the causes of the Climate Changes we have been experiencing.
No, they have just suggested that this is a mechanism for past climate change events and I can guarantee very few of them would be willing to have their names attached to anything you’re trying to claim.
A survey of all peer-reviewed abstracts on the subject 'global climate change' published between 1993 and 2003 shows that not a single paper rejected the consensus position that global warming is man caused 75% of the papers agreed with the consensus position while 25% made no comment either way (focused on methods or paleoclimate analysis).
www.sciencemag.org...
What I presented is REAL SCIENCE, it has NOTHING to do with religion, but I see what sort of "evidence" people like you like to present...
Nothing here so far that even touches on Anthropogenic Global Warming.
Let’s continue…
Whose work are you going to present? The IPCC which has been caught lying, and whose scientists behind the lie that is manmade Climate Change have had to apologize and spill the beans about their lies?...
What do expect from government bueracracy? I don’t trust them either. There are plenty of skeptics who have been caught lying as well as can be seen above. Nothing new there.
Thousands that say the opposite? really? go ahead and try. I dare you.
You say you have 100’s…? Oh please share, cos as mentioned above you seem to cut and paste just a few dozen in all your posts which really don’t prove anything much at all unless you want to know paleo temperatures in South African Caves or obscure forests in the Netherlands.
As for your ‘Climatgate’ claims, 8 separate committees have investigated this incident and NONE found any evidence of wrong doing or coverups. The main finding that came out was that there simply needs to be a little more transparency in their methods which is good news for science as a whole.
Like your scientific reports, all of the media snippets were taken out of context and are you really going to trust a group who would use criminal means to try and prove their point anyway…?
WASHINGTON – A United Nations climate change conference in Poland is about to get a surprise from 650 leading scientists who scoff at doomsday reports of man-made global warming – labeling them variously a lie, a hoax and part of a new religion.
I’d love to see the actual paper instead simply the ‘choice excerpts’
At any rate I’ll raise you your 650 and give you 3000
Subsequent research has confirmed this result. A survey of 3146 earth scientists asked the question "Do you think human activity is a significant contributing factor in changing mean global temperatures?". More than 90% of participants had Ph.D.s, and 7% had master’s degrees. Overall, 82% of the scientists answered yes. However, what are most interesting are responses compared to the level of expertise in climate science. Of scientists who were non-climatologists and didn't publish research, 77% answered yes. In contrast, 97.5% of climatologists who actively publish research on climate change responded yes. As the level of active research and specialization in climate science increases, so does agreement that humans are significantly changing global temperatures.
Figure 1: Response to the survey question "Do you think human activity is a significant contributing factor in changing mean global temperatures?" (Doran 2009) General public data come from a 2008 Gallup poll.
Most striking is the divide between expert climate scientists (97.4%) and the general public (58%). The paper concludes:
"It seems that the debate on the authenticity of global warming and the role played by human activity is largely nonexistent among those who understand the nuances and scientific basis of long-term climate processes. The challenge, rather, appears to be how to effectively communicate this fact to policy makers and to a public that continues to mistakenly perceive debate among scientists."
tigger.uic.edu...
This overwhelming consensus among climate experts is confirmed by an independent study that surveys all climate scientists who have publicly signed declarations supporting or rejecting the consensus. They find between 97% to 98% of climate experts support the consensus Moreover, they examine the number of publications by each scientist as a measure of expertise in climate science. They find the average number of publications by unconvinced scientists (eg - skeptics) is around half the number by scientists convinced by the evidence. Not only is there a vast difference in the number of convinced versus unconvinced scientists, there is also a considerable gap in expertise between the two groups.
www.pnas.org...
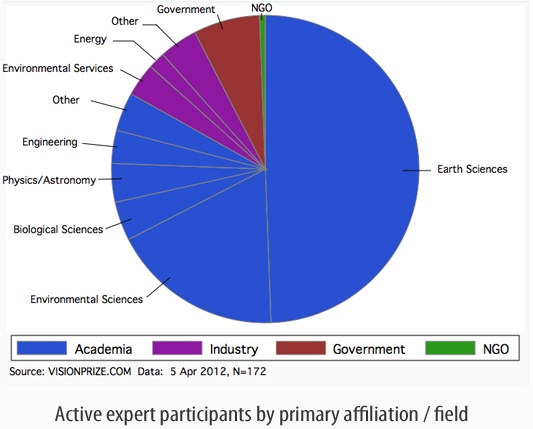
The Vision Prize is an online poll of scientists about climate risk. It is an impartial and independent research platform for incentivized polling of experts on important scientific issues that are relevant to policymakers. In addition to assessing the views of scientists, Vision Prize asked its expert participants to predict the views of their scientific colleagues.
As this figure shows, the majority (~85%) of participants are academics, and approximately half of all participants are Earth Scientists. Thus the average climate science expertise of the participants is quite good.
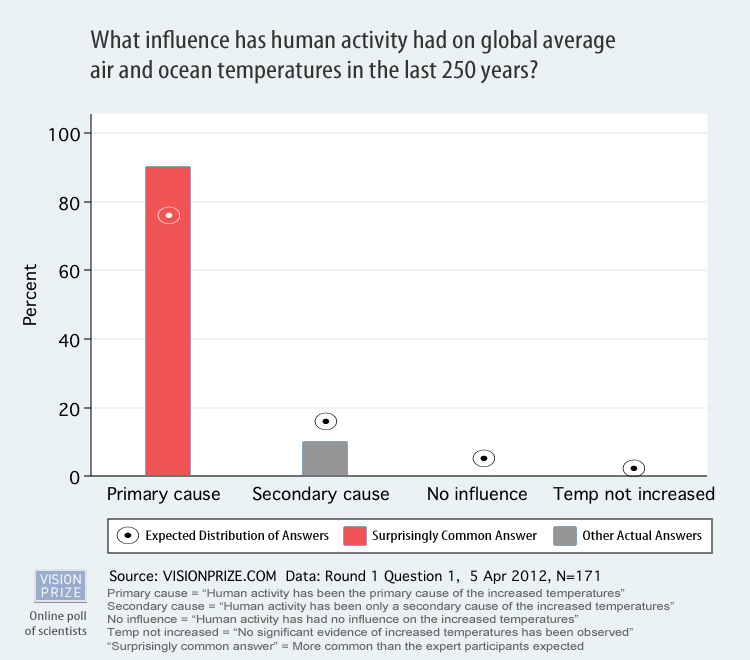
Approximately 90% of participants responded that human activity has had a primary influence over global temperatures over the past 250 years, with the other 10% answering that it has been a secondary cause, and none answering either that humans have had no influence or that temperatures have not increased. Note also that the participants expected less than 80% to peg humans as the primary cause, and a few percent to say humans have no influence - the consensus was significantly better than the participants anticipated
visionprize.com...
Back around in 2004, and throughout the years I have presented these research papers which show that even back in the 1970s at least some scientists knew that our Solar System was approaching a nearby interstellar cloud which could have some possible effects on the global climate.
Wiki and NASA say we’re already in the cloud…
The Solar System is thought to have entered the Local Interstellar Cloud at some time between 44,000 and 150,000 years ago and is expected to remain within it for another 10,000 to 20,000 years.
en.wikipedia.org...
There will be some hard changes, as they have happened in the past. During the Medieval Warm Period Egypt suffered the worst floods and famine which have been unmatched for the last 2,000 years.
Yet another reason not to ignore the overwhelming evidence in favour of anthropogenic climate change
You say somewhere you’ve been doing this here since 2004 and instantly I thought of 2 things. Firstly in that time you could have earned 2 science degrees so that you might actually have an idea about what you’re talking about. Secondly….what a waste. Imagine if you put as much time into fighting for a cause that actually mattered...
Finally I’ll leave you with two things…
The words of one of the one of the most ardent climate change skeptic – Richard Muller – who actually took the time to look at the research and has since completely reversed his opinion
“Three years ago I identified problems in previous climate studies that, in my mind, threw doubt on the very existence of global warming. Last year, following an intensive research effort involving a dozen scientists, I concluded that global warming was real and that the prior estimates of the rate of warming were correct. I’m now going a step further: Humans are almost entirely the cause.”
www.latimes.com...
and this little comic which really speaks volumes…
edit on 1/10/2012 by 1littlewolf because: (no reason given)
Originally posted by 1littlewolf
Its funny, I’ve read a few of your posts and I’ve just realized you use the exact same argument methods as Fundamentalist Christians/ Young Earth Creationists….
It's funny that your argument above does not refute any of the information I have given but it shows you have a lot of hot air as proof of your claims...
Originally posted by 1littlewolf
You cherry pick one off scientific reports which seem to support your claims and completely ignore the overwhelming reports to the contrary. You flood forums with random scientific data which appear to further your cause in an effort to overwhelm the layperson who doesn’t know an awful lot about the science behind the facts yet then you make claims such as the main centers which emit carbon should be warmer with simplistic claims that ‘it’s hotter closer to the fire’ showing you really don’t understand the first thing about climatology (fyi CO2 is not a heat source itself, it causes the atmosphere to retain heat). You say you’ve posted hundreds of papers and have actually read 1000’s yet you seem to rotate through the same dozen or so probably cos that’s all that really exist.
In fact the same could be said of you, first, you cherry-pick everything believing the liars who have been caught publishing lies just to push for the agenda that is the AGW religion. Second, the sources of anthropogenic CO2 have more CO2 than other areas far away from such sources, hence if it was true that CO2 is the cause of the warming then those areas should have warmed most, but they haven't. It is a simple concept that should be understood even by the most layperson out there but you seem unable to understand it...
Originally posted by 1littlewolf
In order to end a lot of the falsities you seem to enjoy spreading throughout this forum I will be addressing each one of the claims you bring up in this thread one at a time.
Let's see what you bring to the table...
Originally posted by 1littlewolf
This is a blatant lie. There would be approximately a dozen at the very best which indicate the possibility that it was equal to or slightly higher in various localised areas.
That is the blatant lie Climate Change has been studied far longer than the AGW religion has existed, there are a lot more than just "approximately a dozen"... Second of all even the papers I presented show that North America, South America, the Antarctic, Europe, Asia, and Africa were all WARMER than at any time during the late 20th century and 21st century. All those areas together show a map of the globe and not just "localized areas". It is obvious who is blatenly lying here, and that is you...
BTW, no Climate Change has EVER brought the exact same temperatures all over the globe, not even the ongoing one, yet you are seem to be implying that because temperatures were not uniform during the Medieval and Roman Period this means those Climate Changes were not global?... We could say the same of the ongoing Climate Change... Temperatures HAVEN'T been uniform, some areas have warmed most than others and we have seen climate extremes, not just warming, we have seen records for cooling also during these times, just as it has happened in the past, so should we use this also as a claim that because temperatures haven't been uniform during the ongoing CLimate Change then it means it is not a global occurrence?...
Originally posted by 1littlewolf
False. Neither the Roman Ice Age nor the Medieval Ice Age have been shown to be any hotter than temperatures are at present except in localised areas. There's no dispuiting that it is getting hotter, yet Antartica has actually been slightly cooler. This proves nothing. And even if these claims were shown to be tre it would still prove nothing because there is nothing except anthropogenic carbon which can account for the current temperature rise. Even some of the main sceptics of the IPCC such as Steve Mckintyre of Climate Audit make no claims about...
First, what is false is your claim, I presented several papers from all over the globe and they all state quite clearly that it was WARMER than at any time during the ongoing Climate Change. It seems that you become blind to facts when they don't want to accept them...
Second, It is known that the Sun has been more active during the ongoing Climate Change than about the last 1,000 years, and this activity has been ongoing for about 100 years until at least 2002 when Wilson's research ended.
Before posting that info, let's try to inform you as to some facts...
Variations in Total Solar Irradiance
The ACRIM I instrument was the first to clearly demonstrate that the total radiant energy emanating from the sun was not a constant, and varied in proportion to solar magnetic activity. However, the sun’s output changes so slowly and solar variability is so slight (less than 0.00425% of the total energy per year on time scales of days), that continuous monitoring by state-of-the-art instrumentation is necessary to detect changes with climate significance. Scientists theorize that as much as 25% of the 20th century anticipated global warming of the Earth may be due to changes in the sun’s energy output. Systematic changes in irradiance as little as 0.25% per century can cause the complete range of climate variations that have occurred in the past, ranging from ice ages to global tropical conditions. For example, scientists believe the "Little Ice Age" that occured in Europe in the late 17th century could have been related to the minimum in sunspot activity (and a correlated minimum in total solar irradiance) that occured during the same period.
earthobservatory.nasa.gov...
Now let's read Wilson's research.
March 20, 2003 (date of web publication)
NASA Study Finds Increasing Solar Trend That Can Change Climate
Since the late 1970s, the amount of solar radiation the sun emits, during times of quiet sunspot activity, has increased by nearly .05 percent per decade, according to a NASA funded study.
"This trend is important because, if sustained over many decades, it could cause significant climate change," said Richard Willson, a researcher affiliated with NASA's Goddard Institute for Space Studies and Columbia University's Earth Institute, New York. He is the lead author of the study recently published in Geophysical Research Letters.
...
Although the inferred increase of solar irradiance in 24 years, about 0.1 percent, is not enough to cause notable climate change, the trend would be important if maintained for a century or more. Satellite observations of total solar irradiance have obtained a long enough record (over 24 years) to begin looking for this effect.
...
In this study, Willson, who is also Principal Investigator of NASA's ACRIM experiments, compiled a TSI record of over 24 years by carefully piecing together the overlapping records. In order to construct a long-term dataset, he needed to bridge a two-year gap (1989 to 1991) between ACRIM1 and ACRIM2. Both the Nimbus7/ERB and ERBS measurements overlapped the ACRIM 'gap.' Using Nimbus7/ERB results produced a 0.05 percent per decade upward trend between solar minima, while ERBS results produced no trend. Until this study, the cause of this difference, and hence the validity of the TSI trend, was uncertain. Willson has identified specific errors in the ERBS data responsible for the difference. The accurate long-term dataset, therefore, shows a significant positive trend (.05 percent per decade) in TSI between the solar minima of solar cycles 21 to 23 (1978 to present). This major finding may help climatologists to distinguish between solar and man-made influences on climate.
...
www.nasa.gov...
The above study by Wilson covered only 24 years, from 1978 until 2002, and the trend he found is that the Sun's activity had been increasing.
Now Wilson is not the only one who has been studying the Sun's activity, we know that even before 1978 the Sun's activity was also increasing.
Sunspots reaching 1,000-year high
By Dr David Whitehouse
BBC News Online science editor
A new analysis shows that the Sun is more active now than it has been at anytime in the previous 1,000 years.
...
But the most striking feature, he says, is that looking at the past 1,150 years the Sun has never been as active as it has been during the past 60 years.
Over the past few hundred years, there has been a steady increase in the numbers of sunspots, a trend that has accelerated in the past century, just at the time when the Earth has been getting warmer.
The data suggests that changing solar activity is influencing in some way the global climate causing the world to get warmer.
Over the past 20 years, however, the number of sunspots has remained roughly constant, yet the average temperature of the Earth has continued to increase.
...
news.bbc.co.uk...
Dr Solanki obviously wasn't aware of Wilson's research which is why Solanski claims that since about 1984 the Sun's activity ahs been constant, but in fact it hasn't.
I have also posted and proved in the past that even after 2002 the Sun's activity had been increasing, until suddenly it slowed down to a crawl which caused temperatures worldwide to dip around the end of 2005-2006.
You see, our Sun's activities are linked together in a way that when one factor is increasing, such as the Sun's magnetic storms, it means that others such as it's irradiance is increasing as well.
Major Magentic Storms 1868-2007
According to the AA* criteria
...
Because of the difference in units of presentation, the values of AA* and Ap* are not the same so that different major magnetic storm onset and end threshold values are used for the two series. However their comparison for the years of overlapping coverage show that relative frequency of occurrence of major storms per year are similar. Another reason for differences is that an index derived from magnetic perturbation values at only two observatories easily experiences larger extreme values if either input site is well situated to the overhead ionospheric and.or field aligned current systems producing the magnetic storm effects. Although not documented here, it is interesting to note that the overall level of magnetic disturbance from year to year has increased substantially from a low around 1900 Also, the level of mean yearly aa is now much higher so that a year of minimum magnetic disturbances now is typically more disturbed than years at maximum disturbance levels before 1900.
...
www.ngdc.noaa.gov...
www.ngdc.noaa.gov...
If you look at the above link, and graph you will find that the Sun's activity had been increasing until the end of 2005 when it suddenly slowed down to a crawl.
What this means is that the Sun's activity had been increasing for over 84 years to 100 years, which means that the Sun has been one of the mayor sources of warming during the ongoing Climate Change.
Not only that but you seem to forget that when the Earth warms the atmosphere can hold more water vapor, and water vapor is 10 times worse, molecule by molecule, than CO2, not to mention that it is a lot more abundant than CO2 is, and 99.999% of it is NATURAL.
Water vapor exists in our atmosphere from 1% - 4%, but the average is 1% of the atmosphere's gases, meanwhile CO2 is 0.039% by volume. Water Vapor is far more potent than CO2, and more abundant.
The AGW religious fanatics always like to claim that because CO2 has a lifetime in the atmosphere longer than water vapor that it is worse than water vapor, but the fact is that all ghg lose heat EVERY NIGHT, to regain it again during the morning, hence the longer lifetime of CO2 does not make it a worse ghg.
The warmer the atmosphere gets, the MORE water vapor it can hold, which leads to a feedback effect in which water vapor increases the temperatures warms the atmosphere more which makes it hold more water vapor. But if it wasn't because water vapor and other ghgs lose heat at night, and that the Sun's activity is not constant we would be living in a much, much warmer world.
edit on 2-10-2012 by ElectricUniverse because: errors.
Originally posted by 1littlewolf
This data is in part is based off the misleading claims of a geologist (not a climatologist) called Don Easterbrook who presented a paper at a 2010 climate skeptic conference where he actually fraudulently altered graphs to try and bolster his claims. See below.
You are cherry-picking, not to mention that there are several other graphs and papers which clearly show the same results, that the Medieval Warm Period was WARMER... Your lies are not going to bury the truth...
Originally posted by 1littlewolf
Also as another poster has pointed out the ice on Greenland has retreated well beyond where it was when the Vikings lived there, and this has only been in the past decade. This actually really is the key. Even if everything you claim is true (which it isn’t), you still do not and cannot claim that that temperatures are not rising at present. All the graphs you have posted show this. The difference between natural temperature variations in the past and the present day is that these changes occurred slowly over many hundreds if not thousands of years, not in order of decades. Plants and animals had time to adapt; now they do not. This is further exacerbated by the fact that we have completely fragmented there environment so they now cannot move to higher or lower latitudes simply cos there are manmade obstacles blocking their retreat and/or there is no longer anywhere to move to.
WRONG. Studies have shown that temperatures were warmer around the globe, which would include the Arctic, and Antarctic. Not to mention that past Climate Changes like the Medieval and Roman Warm periods DID NOT take thousands of years to occur, but happened in a similar manner as the ongoing Climate Change.
You are trying to disseminate lies, there have been even Climate Changes so abrupt in the past that they occurred within 10 years and even less...
Originally published in Science Express on 19 June 2008
Science 1 August 2008:
Vol. 321. no. 5889, pp. 680 - 684
DOI: 10.1126/science.1157707
Prev | Table of Contents | Next
Reports
High-Resolution Greenland Ice Core Data Show Abrupt Climate Change Happens in Few Years
Jørgen Peder Steffensen,1* Katrine K. Andersen,1 Matthias Bigler,1,2 Henrik B. Clausen,1 Dorthe Dahl-Jensen,1 Hubertus Fischer,2,3 Kumiko Goto-Azuma,4 Margareta Hansson,5 Sigfús J. Johnsen,1 Jean Jouzel,6 Valérie Masson-Delmotte,6 Trevor Popp,7 Sune O. Rasmussen,1 Regine Röthlisberger,2,8 Urs Ruth,3 Bernhard Stauffer,2 Marie-Louise Siggaard-Andersen,1 Árn E. Sveinbjörnsdóttir,9 Anders Svensson,1 James W. C. White7
The last two abrupt warmings at the onset of our present warm interglacial period, interrupted by the Younger Dryas cooling event, were investigated at high temporal resolution from the North Greenland Ice Core Project ice core. The deuterium excess, a proxy of Greenland precipitation moisture source, switched mode within 1 to 3 years over these transitions and initiated a more gradual change (over 50 years) of the Greenland air temperature, as recorded by stable water isotopes. The onsets of both abrupt Greenland warmings were slightly preceded by decreasing Greenland dust deposition, reflecting the wetting of Asian deserts. A northern shift of the Intertropical Convergence Zone could be the trigger of these abrupt shifts of Northern Hemisphere atmospheric circulation, resulting in changes of 2 to 4 kelvin in Greenland moisture source temperature from one year to the next.
www.sciencemag.org...
BTW, when the oceans are warmer it means the land and atmosphere are warmer... Just in case you didn't know...
Oh, and let's not forget...
Hormes, A., Beer, J. and Schlüchter, C., 2006. A geochronological approach to understanding the role of solar activity on Holocene glacier length variability in the Swiss Alps. Geogr. Ann., 88 A (4): 281–294.
Abstract — We present a radiocarbon data set of 71 samples of wood and peat material that melted out or sheared out from underneath eight present day mid-latitude glaciers in the Central Swiss Alps. Results indicated that in the past several glaciers have been repeatedly less extensive than they were in the 1990s. The periods when glaciers had a smaller volume and shorter length persisted between 320 and 2500 years. This data set provides greater insight into glacier variability than previously possible, especially for the early and middle Holocene. The radiocarbon-dated periods defined with less extensive glaciers coincide with periods of reduced radioproduction, pointing to a connection between solar activity and glacier melting processes. Measured long-term series of glacier length variations show significant correlation with the total solar irradiance. Incoming solar irradiance and changing albedo can account for a direct forcing of the glacier mass balances. Long-term investigations of atmospheric processes that are in interaction with changing solar activity are needed in order to understand the feedback mechanisms with glacier mass balances.
The Role of Solar Activity on Holocene Glacier Length Variability in the swiss Alps
The Holocene, Vol. 16, No. 5, 697-704 (2006)
DOI: 10.1191/0959683606hl964rp
Multicentury glacier fluctuations in the Swiss Alps during the Holocene
Ulrich E. Joerin
Institute of Geological Sciences, University of Bern, Baltzerstrasse 1, CH-3012 Bern, Switzerland, [email protected]
Thomas F. Stocker
Climate and Environmental Physics, Physics Institute, University of Bern, Sidlerstrasse 5, CH-3012 Bern, Switzerland
Christian Schlüchter
Institute of Geological Sciences, University of Bern, Baltzerstrasse 1, CH-3012 Bern, Switzerland
Subfossil remains of wood and peat from six Swiss glaciers found in proglacial fluvial sediments indicate that glaciers were smaller than the 1985 reference level and climatic conditions allowed vegetation growth in now glaciated basins. An extended data set of Swiss glacier recessions consisting of 143 radiocarbon dates is presented to improve the chronology of glacier fluctuations. A comparison with other archives and dated glacier advances suggests 12 major recession periods occurring at 9850- 9600, 9300-8650, 8550-8050, 7700-7550, 7450-6550, 6150-5950, 5700-5500, 5200-4400, 4300-3400, 2800-2700, 2150-1850, 1400-1200 cal. yr BP. It is proposed that major glacier fluctuations occurred on a multicentennial scale with a changing pattern during the course of the Holocene. After the Younger Dryas, glaciers receded to a smaller extent and prolonged recessions occurred repeatedly, culminating around 7 cal. kyr BP. After a transition around 6 cal. kyr BP weak fluctuations around the present level dominated. After 3.6 cal. kyr BP less frequent recessions interrupted the trend to advanced glaciers peaking with the prominent ‘Little Ice Age’. This trend is in line with a continuous decrease of summer insolation during the Holocene.
hol.sagepub.com...
Originally posted by 1littlewolf
Take a look at this graph you posted, not only are there far more hotter periods on average in the Current Warm period than the Medieval Warm Period, but it also conveniently leaves out the past decade where temperatures have been far hotter than anything ever before seen in recorded history.
[atsimg]http://files.abovetopsecret.com/images/member/a357061c7174.jpg[/atsimg]
As for the Roman Warming Period, so little is known about this that even the leading climate change skeptics won’t touch it with a 10 foot pole.
You can't even read the above graph... The CWP to the right is the CURRENT Warm Period. The graph CLEARLY shows that the Medieval Warm Period, to the left on the graph, was WARMER than the CWP (Current Warm Period).
As for the Roman Warm Period, the evidence shows it was from 2 to 4 degrees Celsius than the CWP at it's warmest.
For some references and papers on the RWP here is a good link.
www.co2science.org...
Originally posted by 1littlewolf
That Scandinavia may have been slightly warmer in the 11th century than today also doesn't change the fact that the world, as a whole, is warmer now. "This data is spatially specific. You would expect to see this trend in northern Scandinavia, but not in the Alps," Wilson said. "Almost all models show that the current global warming is probably warmer overall than that warming."
Again you are cherry-picking... Even your masters Mann, Jones, Tembath, et al know that ALL of Europe was affected by the Medieval Warm Period, and other papers I presented show that other continents and countries, and in general the entire globe was WARMER than at any time during the present...
BTW, do you want me to address the GCMs?... Because it is a known fact that they are ALL flawed to the bone...
Koutsoyiannis, D., A. Efstratiadis, N. Mamassis, and A. Christofides, On the credibility of climate predictions, Hydrological Sciences Journal, 53 (4), 671–684, 2008.
[doc_id=864]
[English]
Geographically distributed predictions of future climate, obtained through climate models, are widely used in hydrology and many other disciplines, typically without assessing their reliability. Here we compare the output of various models to temperature and precipitation observations from eight stations with long (over 100 years) records from around the globe. The results show that models perform poorly, even at a climatic (30-year) scale. Thus local model projections cannot be credible, whereas a common argument that models can perform better at larger spatial scales is unsupported.
www.itia.ntua.gr...
And...
There is not even an attempt to model such complex climate details, as GCMsare too coarse for such purposes. When K. Hasselmann (a leading greenhouse protagonist)was asked why GCMs do not allow for the stratosphere’s warming by the suns ultravioletradation and its impact on the circulation in the troposphere, he answered: “This aspect is too complex to incorporate it into models”[8]. Since there are other solar-terrestrial relationships which are “too complex” such as, for example, the dynamics of cloud coverage modulated by the solar wind, it is no wonder that the predictions based on GCMs do not conform to climate reality.
plasmaresources.com...
And...
Orographic cloud in a GCM: the missing cirrus
Journal Climate Dynamics
Publisher Springer Berlin / Heidelberg
ISSN 0930-7575 (Print) 1432-0894 (Online)
Issue Volume 24, Numbers 7-8 / June, 2005
DOI 10.1007/s00382-005-0020-9
Pages 771-780
Subject Collection Earth and Environmental Science
SpringerLink Date Monday, May 02, 2005
PDF (702.7 KB)HTMLFree Preview
Orographic cloud in a GCM: the missing cirrus
S. M. Dean1 , B. N. Lawrence2, R. G. Grainger1 and D. N. Heuff3
(1) Atmospheric Oceanic and Planetary Physics, Clarendon Laboratory, University of Oxford, Oxford, Oxfordshire, UK
(2) British Atmospheric Data Centre, Rutherford Appleton Laboratory, Chilton, Oxfordshire, UK
(3) Department of Physics and Astronomy, University of Canterbury, Christchurch, New Zealand
Received: 13 September 2004 Accepted: 25 February 2005 Published online: 27 April 2005
Abstract Observations from the International Satellite Cloud Climatalogy Project (ISCCP) are used to demonstrate that the 19-level HadAM3 version of the United Kingdom Met Office Unified Model does not simulate sufficient high cloud over land. By using low-altitude winds, from the European Centre for Medium Range Weather Forecasting (ECMWF) Re-Analysis from 1979 to 1994 (ERA-15) to predict the areas of maximum likelihood of orographic wave generation, it is shown that much of the deficiency is likely to be due to the lack of a representation of the orographic cirrus generated by sub-grid scale orography. It is probable that this is a problem in most GCMs.
www.springerlink.com...
Another of the many flaws of GCMs...
The widely accepted (albeit unproven) theory that manmade global warming will accelerate itself by creating more heat-trapping clouds is challenged this month in new research from The University of Alabama in Huntsville.
Instead of creating more clouds, individual tropical warming cycles that served as proxies for global warming saw a decrease in the coverage of heat-trapping cirrus clouds, says Dr. Roy Spencer, a principal research scientist in UAHuntsville's Earth System Science Center.
That was not what he expected to find.
"All leading climate models forecast that as the atmosphere warms there should be an increase in high altitude cirrus clouds, which would amplify any warming caused by manmade greenhouse gases," he said. "That amplification is a positive feedback. What we found in month-to-month fluctuations of the tropical climate system was a strongly negative feedback. As the tropical atmosphere warms, cirrus clouds decrease. That allows more infrared heat to escape from the atmosphere to outer space."
The results of this research were published today in the American Geophysical Union's "Geophysical Research Letters" on-line edition. The paper was co-authored by UAHuntsville's Dr. John R. Christy and Dr. W. Danny Braswell, and Dr. Justin Hnilo of Lawrence Livermore National Laboratory, Livermore, CA.
www.uah.edu...
Originally posted by 1littlewolf
Seriously…. A study which is nearly 20 years old regarding the cultivation practices of medieval Chinese farmers…
Seriously, are you going to dismiss peer-reviewed papers just because you don't want to accept them?...
Similar research has been done in Egypt and other areas in the world studying for example the price of food
BTW, are you going to dismiss the following paper because it was done by Chinese scientists as well?...
doi:10.1016/j.palaeo.2005.07.012
Copyright © 2005 Elsevier B.V. All rights reserved.
Temperature responses to quasi-100-yr solar variability during the past 6000 years based on δ18O of peat cellulose in Hongyuan, eastern Qinghai–Tibet plateau, China
Hai Xua, b, , , , Yetang Hongb, Qinghua Linb, Yongxuan Zhub, Bing Hongb and Hongbo Jiangb
aState Key Laboratory of Loess and Quaternary Geology, Institute of Earth Environment, Chinese Academy of Sciences, 10 Fenghui South Road, High-tech Zone, Xi'an, Shaanxi Province, PO Box 710075, China
bState Key Laboratory of Environmental Geochemistry, Institute of Geochemistry, Chinese Academy of Sciences, Guiyang, 550002, China
Received 28 October 2004; revised 17 July 2005; accepted 19 July 2005. Available online 22 August 2005.
Abstract
During the past 6000 years, the temperature variation trend inferred from δ18O of peat cellulose in a peat core from Hongyuan (eastern Qinghai–Tibet plateau, southwestern China) is similar to the atmospheric 14C concentration trend and the modeled solar output trend. The general trend of Hongyuan δ18O during the past millennium also coincides well with the atmospheric 14C concentration trend, the 10Be concentration trend in an ice core from the South Pole, the reconstructed total solar irradiance trend, as well as the modeled solar output trend. In addition, temperature events also correspond well to solar perturbations during the past 6000 years. Therefore, the driving force of Holocene temperature variations should be properly ascribed to solar activity. The spectrum analysis further illustrates that quasi-100-yr fluctuation of solar activity was probably responsible for temperature variations in northeast Qinghai–Tibet plateau during the past 6000 years.
Keywords: Peat; Oxygen isotopic composition; Temperature; Solar activity; Qinghai–Tibet plateau; China
www.sciencedirect.com
Originally posted by 1littlewolf
No one has ever doubted this
The main claim of the AGW religion is that CO2 is the main cause for the ongoing Climate Change, and that CO2 is more powerful than the Sun and any other force in the Universe...
Originally posted by 1littlewolf
No, they have just suggested that this is a mechanism for past climate change events and I can guarantee very few of them would be willing to have their names attached to anything you’re trying to claim.
Oh wow, I didn't know you spoke for these scientists as well... BTW, the fact that they have published these papers in scientific journals is a CLEAR sign that they disagree with you...
And do you want to go over the fact that scientific groups/organizations are claiming that they are speaking for ALL their scientists when in fact only, and mainly the directors of such groups, which number around 5-16 per scientific organization/group are the ones claiming that "all their scientists agree with the AGW lie", when in fact most of these scientists weren't asked to give their opinions, and the directors made such claims because they wanted to get more funding, since the AGW religion has been so popular amongst mainly leftwing groups/organizations and rich individuals like George Soros, and Al Gore...
I have posted in the past the fact that many scientists have even written back to their directors in their respective scientific groups and complaint about the claim that ALL, or MOST scientists agree with the AGW lie...
As an example here is one of such group.
World’s Largest Scientific Society Rejects Man-Made Climate Fears
WORLD’S LARGEST SCIENCE GROUP REJECTING MAN-MADE CLIMATE FEARS
By Marc Morano
July 31, 2009
NewsWithViews.com
An outpouring of skeptical scientists who are members of the American Chemical Society (ACS) are revolting against the group’s editor-in-chief — with some demanding he be removed — after an editorial appeared claiming “the science of anthropogenic climate change is becoming increasingly well established.”
The editorial claimed the “consensus” view was growing “increasingly difficult to challenge, despite the efforts of diehard climate-change deniers.” The editor now admits he is “startled” by the negative reaction from the group’s scientific members. The American Chemical Society bills itself as the “world’s largest scientific society.”
The June 22, 2009 editorial in Chemical and Engineering News by editor in chief Rudy Baum, is facing widespread blowback and condemnation from American Chemical Society member scientists. Baum concluded his editorial by stating that “deniers” are attempting to “derail meaningful efforts to respond to global climate change.”
Dozens of letters were published on July 27, 2009 castigating Baum, with some scientists calling for his replacement as editor-in-chief.
The editorial was met with a swift, passionate and scientific rebuke from Baum’s colleagues. Virtually all of the letters published on July 27 in castigated Baum’s climate science views. Scientists rebuked Baum’s use of the word “deniers” because of the terms “association with Holocaust deniers.” In addition, the scientists called Baum’s editorial: “disgusting”; “a disgrace”; “filled with misinformation”; “unworthy of a scientific periodical” and “pap.”
...
Link
Originally posted by 1littlewolf
Nothing here so far that even touches on Anthropogenic Global Warming.
Oh yes it does... The fact that past Climate Changes have been faster, and warmer than the present, the fact that the GCMs (Global Climate Models) are flawed to a fault, and despite this the AGW camp keep using GCMs to bolster their religion, the fact that the areas which have warmed the most are far away from sources of CO2, etc, ALL of it shows that Anthropogenic Global Warming is nothing but a farce, a hoax being used to get people to accept a One World Government "to combat Climate Change and other crisis"...
Originally posted by 1littlewolf
Let’s continue…
All you have proven so far is that you can't read scientific graphs, and you don't know jack about Climate Change, but let's see what else you try to claim...
Originally posted by 1littlewolf
You say you have 100’s…? Oh please share, cos as mentioned above you seem to cut and paste just a few dozen in all your posts which really don’t prove anything much at all unless you want to know paleo temperatures in South African Caves or obscure forests in the Netherlands.
Yes, there are hundreds, I can't post them all first because it is very time consuming obviously, and second the ones I have posted more than clearly make my point...
Originally posted by 1littlewolf
As for your ‘Climatgate’ claims, 8 separate committees have investigated this incident and NONE found any evidence of wrong doing or coverups. The main finding that came out was that there simply needs to be a little more transparency in their methods which is good news for science as a whole.
Oh yeah...committees which are set up by governments which are pushing for a One World Government, and push for the belief of AGW...
Originally posted by 1littlewolf
Like your scientific reports, all of the media snippets were taken out of context and are you really going to trust a group who would use criminal means to try and prove their point anyway…?
the one taking such reports out of context, and claiming the contrary to what they say is you. Not to mention that you also want to use the same excuse that Janet Napolitano gave, amongst other politicians, to silence the truth about Climategate...
Perhaps we shouldn't listen to ANY reports which are acquired not exactly in legal ways huh? such as reports made by reporters for newspapers and such... Nice try...
Originally posted by 1littlewolf
At any rate I’ll raise you your 650 and give you 3000
And I raise you by 31,487 scientists, 9029 who have Phds...
www.petitionproject.org...
BTW, don't even try to cherry-pick the list of scientists because I've got more ammunition against your scientists, than you will ever get against those who agree with me...
Not to mention examples like...
50 NASA Scientists Against Global Warming
James Delingpole · Apr 11 at 1:40am
Science is not a numbers game. As Einstein said when Hitler commissioned a pamphlet called 100 Scientists Against Einstein: "If I were wrong, one would have been enough." (H/T Marc Morano)
Nonetheless, I think we should all be quietly encouraged by the recent letter by 50 former NASA astronauts, engineers and scientists protesting at the way their once-great institution has been prostituting its name in order to promote the great man-made global warming scam.
The letter says:
We, the undersigned, respectfully request that NASA and the Goddard Institute for Space Studies (GISS) refrain from including unproven remarks in public releases and websites. We believe the claims by NASA and GISS, that man-made carbon dioxide is having a catastrophic impact on global climate change are not substantiated, especially when considering thousands of years of empirical data. With hundreds of well-known climate scientists and tens of thousands of other scientists publicly declaring their disbelief in the catastrophic forecasts, coming particularly from the GISS leadership, it is clear that the science is NOT settled.
The unbridled advocacy of CO2 being the major cause of climate change is unbecoming of NASA’s history of making an objective assessment of all available scientific data prior to making decisions or public statements.
As former NASA employees, we feel that NASA’s advocacy of an extreme position, prior to a thorough study of the possible overwhelming impact of natural climate drivers is inappropriate. We request that NASA refrain from including unproven and unsupported remarks in its future releases and websites on this subject. At risk is damage to the exemplary reputation of NASA, NASA’s current or former scientists and employees, and even the reputation of science itself.
ricochet.com...
Of course since the environlunatic Hansen is the director of NASA, he will do everything in his power to post more flawed data, and lies to push for his agenda of AGW...
Originally posted by 1littlewolf
Wiki and NASA say we’re already in the cloud…
Again, you are showing ignorance on such topics... Our Solar System is moving to a different region of the Local Fluff, one in which the interstellar Cloud has more structure to it, which means big changes for Earth and the entire Solar System, than the region we have encountered ourselves in for thousands, or even tens of thousands of years...
Originally posted by 1littlewolf
Yet another reason not to ignore the overwhelming evidence in favour of anthropogenic climate change
WRONG, whats the AGW religious camp wants, and is doing is to sequester atmospheric CO2, I know because I was offered a job to work in such a project, and I immediately wrote to my representatives and Senators trying to explain why this is such a bad idea.
CO2 is not the cause of the warming as claimed by the AGW, however CO2 is plant food, and it is a known fact that even the levels of CO2 that exist now are extremely low. If the levels of CO2 get much lower we will have less harvests, trees, plants and all green biomass will grow less, and the growth can be stunted completely and stopped, and this will cause more widespread famine/hunger accross the entire globe...
Originally posted by 1littlewolf
You say somewhere you’ve been doing this here since 2004 and instantly I thought of 2 things. Firstly in that time you could have earned 2 science degrees so that you might actually have an idea about what you’re talking about. Secondly….what a waste. Imagine if you put as much time into fighting for a cause that actually mattered...
First of all, I already have my degrees in what I always wanted to study, second of all anybody can find all the information and peer-reviewed papers I have posted and reach the same conclusion I have...
BTW, fighting against the lie that "CO2 must be sequestered" MATTERS, more so when lower levels than CO2 will mean less harvests worldwide...
If the levels of atmospheric CO2 were much higher than they are now all green biomass on the planet would grow exponentially providing more yields/harvests worldwide with which to feed the population of the world...
Nature emits more than 770 gt of CO2 yearly, and the amounts are not constant, at times it is higher and at times a bit smaller. The amount of CO2 released by man also changes year to year to about 26 gt. Many times the differences in natural emissions from year to year surpasses what mankind emits yearly.
There is no "we have reached a tipping point of how much CO2 is in the atmosphere", in fact much higher levels have existed and there wasn't "mass extinctions of animals" neither on land, or at sea. The extinctions have been caused by either massive volcanic activity, or asteroids/meteors crashing on Earth, or some other similar disasters. The mission of CO2 into the atmsphere which might have caused asphisiation of mammals in the past was an effect of a larger disaster such as alarge meteor crashing on Earth, or at sea.
There is no higher, or better cause to fight for... Unless you are one of those people who hates humanity and want to see millions, ir not billions of people dead from malnutrition...
There is also this fact...
Oceanic Influences on Recent Continental Warming
GILBERT P. COMPO
PRASHANT D. SARDESHMUKH
Climate Diagnostics Center,
Cooperative Institute for Research in Environmental Sciences,
University of Colorado, and
Physical Sciences Division, Earth System Research Laboratory,
National Oceanic and Atmospheric Administration
325 Broadway R/PSD1
Boulder CO 80305-3328
[email protected]
(303) 497-6115
(303) 497-6449
Citation:
Compo, G.P., and P.D. Sardeshmukh, 2008: Oceanic influences on recent continental warming. Climate
Dynamics, doi: 10.1007/s00382-008-0448-9.
This article is published by Springer-Verlag. This author-created version is distributed courtesy of Springer-Verlag.
The original publication is available from www.springerlink.com at
www.springerlink.com...
Abstract
Evidence is presented that the recent worldwide land warming has occurred largely in response to a worldwide warming of the oceans rather than as a direct response to increasing greenhouse gases (GHGs) over land.
Atmospheric model simulations of the last half-century with prescribed observed ocean temperature changes, but without prescribed GHG changes, account for most of the land warming. The oceanic influence has occurred through hydrodynamic-radiative teleconnections, primarily by moistening and warming the air over land and increasing the downward longwave radiation at the surface. The oceans may themselves have warmed from a combination of natural and anthropogenic influences.
www.cdc.noaa.gov...
www.esrl.noaa.gov...
In the above research work the "evidence" says and I quote:
recent worldwide land warming has occurred largely in response to a worldwide warming of the oceans rather than as a direct response to increasing greenhouse gases (GHGs) over land
The fact that also the areas which have been warming the most are very remote locations very far away from sources of anthropogenic pollution, including anthropogenic CO2, this evidence also suggests that some other mechanism, and not CO2 has been the cause of the warming.
Originally posted by 1littlewolf
and this little comic which really speaks volumes…
WOW... a comic strip based on a lie... Yep, I guess that's all the proof you need to refute all the facts you don't want to accept...
Let's read some facts about CO2, and not the lies being indoctrinated into the ignorant masses like yourself...
Successful indoor growers implement methods to increase CO2 concentrations in their enclosure. The typical outdoor air we breathe contains 0.03 - 0.045% (300 - 450 ppm) CO2. Research demonstrates that optimum growth and production for most plants occur between 1200 - 1500 ppm CO2. These optimum CO2 levels can boost plant metabolism, growth and yield by 25 - 60%.
www.planetnatural.com...
The higher the levels of atmospheric CO2, the more harvests/yields that all green biomass will have, including trees, and plants, which would mean we would be able to feed more people...
Let's actually hear it from those who deal with atmospheric CO2 to increase harvests in greenhouses...
Carbon Dioxide (CO2) contributes to plant growth as part of the miracle of nature known as photosynthesis. This enables plants to combine Carbon Dioxide and water with the aid of light energy to form sugar. Some of these sugars are converted into complex compounds that increase dry solid plant substances for continued growth to final maturity. However, when the supply of carbon dioxide is cut off, or reduced, the complex plant cell structure cannot utilize the sun's energy fully and growth or development is curtailed.
CARBON DIOXIDE (CO2)
IMPROVES PLANT GROWTH AND QUALITY
Research has shown that in most cases rate of plant growth under otherwise identical growing conditions is directly related to carbon dioxide concentration.
The amount of carbon dioxide a plant requires to grow may vary from plant to plant, but tests show that most plants will stop growing when the CO2 level decreases below 150 ppm. Even at 220 ppm, a slow-down in plant growth is significantly noticeable.
Colorado State University conducted tests with carnations and other flowers in controlled CO2 atmospheres ranging from 200 to 550 ppm. The higher CO2 concentrations significantly increased the rate of formation of dry plant matter, total flower yield and market value.
www.homeharvest.com...
Actually some people who have greenhouses increase the level of atmospheric CO2 to much higher levels than 550 ppm. BTW to those who don't know it the amount of atmospheric CO2 on Earth is about 380 ppm, so it is NOWHERE near to being fatal for anything, much less plants who actually thrive with more atmospheric CO2...
Anyway further down in the above article you find...
SAMPLE RESULTS FROM CO2 ENRICHMENT STUDIES
BIBB LETTUCE
By adding CO2 to the atmosphere around the plant, a 40% crop increase was achieved. Whereas previous crops averaged 22 heads per basket, lettuce grown in the increased CO2 atmosphere (550 ppm) averaged 16 heads of better quality per basket.
CARNATIONS
CO2 levels to 550 ppm produced an obvious increase in yield (over 30%), but the greatest benefits were earlier flowering (up to 2 weeks) with an increased percentage of dry matter.
ROSES
The addition of controlled carbon dioxide provided a remarkable improvement in blossom quality, number and yield. Plants consistently produced many more flowers with 24 to 30 inch stems. Average yield was increased by 39.7%.
TOMATOES
Work in experimental stations has shown that crop increases of as much as 29% have been obtained by increasing the CO2 concentration. More desirable firmness and more uniform ripening are also observed.
www.homeharvest.com...
Let's continue shall we?...
Why you get more rapid and efficient growth and better plant quality with Johnson CO2.
Plants must absorb carbon dioxide (CO2) in combination with water, soil nutrients and sunlight to produce the sugars vital for growth. A shortage of any of these requirements will retard the growing process. Normally there are approximately 300 parts per million of CO2 in the atmosphere; when this level is increased to over 1 ,000 ppm, results are higher production and better plant quality. The Johnson Generator provides up to 1,500 ppm per unit in an average 24' x 200' greenhouse or an equivalent 50,000 cu. ft. volume based on one air change per hour.
www.johnsongas.com...
Perhaps those people who keep claiming that CO2 is bad for the environment now might understand why when Earth's atmosphere has had 7 and up to 12 times as much CO2 as now there was MORE green biomass, as in more trees, and more plants, not less, and life also flourished on land and in the oceans with much higher levels of atmospheric CO2 than now...
Not to mention...
PRESS RELEASE
Date Released: Thursday, June 5, 2003
Source: Goddard Space Flight Center
A NASA-Department of Energy jointly funded study concludes the Earth has been greening over the past 20 years. As climate changed, plants found it easier to grow.
The globally comprehensive, multi-discipline study appears in this week's Science magazine. The article states climate changes have provided extra doses of water, heat and sunlight in areas where one or more of those ingredients may have been lacking. Plants flourished in places where climatic conditions previously limited growth.
"Our study proposes climatic changes as the leading cause for the increases in plant growth over the last two decades, with lesser contribution from carbon dioxide fertilization and forest re-growth," said Ramakrishna Nemani, the study's lead author from the University of Montana, Missoula, Mont.
...
www.spaceref.com...
Not to mention that even those scientists who believe that CO2 can have a discernible effect on temperatures state a similar argument as the following...
Climate Change: Driven by the Ocean not Human Activity
by
William M. Gray
Professor Emeritus, Dept of Atmospheric Science,
Colorado State University
Prepared for the 2nd Annual Heartland Institute sponsored conference on Climate Change. New York City, March 8-10, 2009
Paper also available at tropical.atmos.colostate.edu... (under News)
Abstract
This paper discusses how the variation in the global ocean’s Meridional Overturning Circulation (MOC) resulting from changes in the Atlantic Thermohaline Circulation (THC) and deep water Surrounding Antarctica Subsidence (SAS) can be the primary cause of climate change. (MOC = THC + SAS) is the likely cause of most of the global warming that has been observed since the start of the industrial revolution (~1850) and for the more recent global warming that has occurred since the mid-1970s. Changes of the MOC since 1995 are hypothesized to have lead to the cessation of global warming since 1998 and to the beginning of a weak global cooling that has occurred since 2001. This weak cooling is projected to go on for the next couple of decades.
Recent GCM global warming scenarios assume that a slightly stronger hydrologic cycle (due to the increase in CO2) will cause additional upper-level tropospheric water vapor and cloudiness. Such vapor-cloudiness increases are assumed to allow the small initial warming due to increased CO2 to be unrealistically multiplied 2-4 or more times. This is where most of the global warming from the GCMs comes from – not the warming resulting from the CO2 increase by itself but the large extra warming due to the assumed increase of upper tropospheric water vapor and cloudiness. As CO2 increases, it does not follow that the net global upper-level water vapor and cloudiness will increase significantly.
Observations of upper tropospheric water vapor over the last 3-4 decades from the National Centers for Environmental Prediction/National Center for Atmospheric Research (NCEP/NCAR) reanalysis data and the International Satellite Cloud Climatology Project (ISCCP) data show that upper tropospheric water vapor appears to undergo a small decrease while Outgoing Longwave Radiation (OLR) undergoes a small increase. This is opposite to what has been programmed into the GCMs. The predicted global warming due to a doubling of CO2 has been erroneously exaggerated by the GCMs due to this water vapor feedback.
CO2 increases without positive water vapor feedback could only have been responsible for about 0.1-0.2oC of the 0.6-0.7oC global mean surface temperature warming that has been observed since the early 20th century. Assuming a doubling of CO2 by the late 21st century (assuming no positive water vapor feedback), we should likely expect to see no more than about 0.3-0.5oC global surface warming and certainly not the 2-5oC warming that has been projected by the GCMs.
tropical.atmos.colostate.edu...
Global warming is not so hot:
1003 was worse, researchers find
By William J. Cromie
Gazette Staff
The heat and droughts of 2001 and 2002, and the unending winter of 2002-2003 in the Northeast have people wondering what on Earth is happening to the weather. Is there anything natural about such variability?
To answer that question, researchers at the Harvard-Smithsonian Center for Astrophysics (CfA) - right in the heart of New England's bad weather - took a look at how things have changed in the past 1,000 years. They looked at studies of changes in glaciers, corals, stalagmites, and fossils. They checked investigations of cores drilled out of ice caps and sediments lying on the bottom of lakes, rivers, and seas. They examined research on pollen, tree rings, tree lines, and junk left over from old cultures and colonies. Their conclusion: We are not living either in the warmest years of the past millennium nor in a time with the most extreme weather.
This review of changes in nature and culture during the past 1,000 years was published in the April 11 issue of the Journal of Energy and Environment. It puts subjective observations of climate change on a much firmer objective foundation. For example, tree-ring data show that temperatures were warmer than now in many far northern regions from 950 to 1100 A.D.
From 800 to 1300 A.D., the Medieval Warm Period, many parts of the world were warmer than they have been in recent decades. But temperatures now (including last winter) are generally much milder than they were from 1300 to 1900, the Little Ice Age.
To come to this coclusion, CfA researchers, along with colleagues from the Center for the Study of Carbon Dioxide and Global Change in Tempe, Ariz., and the Center for Climatic Research at the University of Delaware, reviewed more than 200 studies of climate done over the past 10 years. "Many research advances in reconstructing ancient climate have occurred over the past two decades, so we felt it was time to pull together a large sample of them and look for patterns of variability and change," says Willie Soon of CfA. "Clear patterns did emerge showing that regions worldwide experienced higher temperatures from 800 to 1300 and lower temperatures from 1300 to 1900 than we have felt during our lifetimes."
www.hno.harvard.edu...
There are REAL pollutants that are not being addressed, yet all the fury is being directed to CO2, and people are being indoctrinated into thinking atmospheric CO2 "is a pollutant" when in fact it isn't.
The real pollutants include the following.
Smog is a kind of air pollution; the word "smog" is a portmanteau of smoke and fog. Classic smog results from large amounts of coal burning in an area caused by a mixture of smoke and sulfur dioxide. Modern smog does not usually come from coal but from vehicular and industrial emissions that are acted on in the atmosphere by sunlight to form secondary pollutants that also combine with the primary emissions to form photochemical smog.
Photochemical smog
In the 1950s a new type of smog, known as photochemical smog, was first described.
This forms when sunlight hits various pollutants in the air and forms a mix of inimical chemicals that can be very dangerous. A photochemical smog is the chemical reaction of sunlight, nitrogen oxides (NOx) and volatile organic compounds (VOCs) in the atmosphere, which leaves airborne particles (called particulate matter) and ground-level ozone.
Nitrogen oxides are released by nitrogen and oxygen in the air reacting together under high temperature such as in the exhaust of fossil fuel-burning engines in cars, trucks, coal power plants, and industrial manufacturing factories. VOCs are released from man-made sources such as gasoline (petrol), paints, solvents, pesticides, and biogenic sources, such as pine and citrus tree emissions.
This noxious mixture of air pollutants can include the following:
nitrogen oxides, such as nitrogen dioxide
tropospheric ozone
volatile organic compounds (VOCs)
peroxyacyl nitrates (PAN)
aldehydes (RCHO)
All of these chemicals are usually highly reactive and oxidizing. Photochemical smog is therefore considered to be a problem of modern industrialization. It is present in all modern cities, but it is more common in cities with sunny, warm, dry climates and a large number of motor vehicles.[1] Because it travels with the wind, it can affect sparsely populated areas as well.
..........
en.wikipedia.org...
Where is CO2 in that list?.... it is NOWHERE simply because CO2 IS NOT A POLLUTANT, despite the EPA claiming the contrary.
There are real environmental problems that must be addressed, but insted people are being brainwahsed into hating CO2, when CO2 is benefitial at much higher levels than exist now in Earth's atmosphere.
AGW/Climate Change is not only being used by the elites to brainwash the masses into accepting their New Socialist/Fascist World Order, but it is also being used by unscrupulous individuals to make millions in a multi-billion dollar scam that is AGW.
Al Gore could become world's first carbon billionaire
Al Gore, the former US vice president, could become the world's first carbon billionaire after investing heavily in green energy companies.
Last year Mr Gore's venture capital firm loaned a small California firm $75m to develop energy-saving technology.
The company, Silver Spring Networks, produces hardware and software to make the electricity grid more efficient.
The deal appeared to pay off in a big way last week, when the Energy Department announced $3.4 billion in smart grid grants, the New York Times reports. Of the total, more than $560 million went to utilities with which Silver Spring has contracts.
...
www.telegraph.co.uk...
Carbon Trade Exchange is a global electronic exchange platform serving both the regulatory and voluntary carbon markets
With over 145 members in 22 countries, Carbon Trade Exchange offers its members a trusted and transparent electronic marketplace for buying and selling carbon credits. CTX supports the trading of carbon credits that are originated under both the United Nations Clean Development Mechanism (CERs) and independent voluntary standards (VERs).
...
www.carbontradexchange.com...
Reduce Your Carbon Footprint
RemTec is a proud member and Aggregator for The Climate Action Reserve or (Reserve); RemTec is a source and develops carbon offset credits that meet the requirements of the Climate Action Reserve (Reserve) Ozone Depleting Substances Project Protocol
www.remtec.net...
If you look at who started these companies you will find their funders to be rich people like Al Gore.
BTW, Al Gore is NOT a capitalist, he is a corporatist who is using the GREEN wave to become richer than he was.
Like him there are hundreds of rich people making money from the scam that is carbon credits.
Last February I speculated: Carbon Credit Trading, the next financial bubble to burst? That has now come to pass for U.S. markets with the collapse of the Chicago Climate Exchange.
Carbon credits allow industries to emit carbon dioxide above any cap & trade regulations imposed. The carbon market exists as a commodity only through the decisions of politicians and bureaucrats, who determine both the demand, by setting emissions limits, and the supply, by establishing criteria for offsets. It was a bubble waiting to burst. Unlike traditional commodities, which at sometime during the course of their market exchange must be delivered to someone in physical form, the carbon market is based on the lack of delivery of an invisible substance to no one.
Since 2005, when carbon trading was one of the fastest growing commodities, there was speculation that if the Obama administration passed cap & trade legislation, the market would grow to $3 trillion.
...
tucsoncitizen.com...
The carbon credit has also been used, and is used to redistribute wealth.
The Africa Carbon Credit Exchange (ACCE) is a leading African owned and managed marketplace uniquely designed to enable Africa’s participation in the global carbon markets. We provide innovative services and solutions to unravel the complexities of carbon markets and addressing the prevailing barriers to their success in Africa.
ACCE is unlocking low-carbon Africa by creating a reliable, structured and transparent trading platform for buying and selling compliance and voluntary carbon credits created in Africa – and in doing so, driving environmentally sustainable economic growth on the continent.
...
www.africacce.com...
And if you think the money made by the carbon credits is helping the people or the environment you are really wrong. It is only making people who were rich, richer, and even in third world countries you will find some rich people.
edit on 2-10-2012 by ElectricUniverse because: errors and to add comments and links.
Originally posted by ElectricUniverse
You are cherry-picking, not to mention that there are several other graphs and papers which clearly show the same results, that the Medieval Warm Period was WARMER... Your lies are not going to bury the truth...
The problem with science is that unlike religion, it's constantly changing as new data comes to light. So you always have to look at the most recent research.
The odd thing is, even if some other places were warmer than today during the MWP, at least some parts of the Arctic were not
Summers on the Norwegian archipelago of Svalbard are now warmer than at any other time in the last 1,800 years, including during medieval times when parts of the northern hemisphere were as hot as, or hotter, than today, according to a new study in the journal Geology. "The Medieval Warm Period was not as uniformly warm as we once thought—we can start calling it the Medieval Period again," said the study's lead author, William D'Andrea, a climate scientist at Columbia University's Lamont-Doherty Earth Observatory. "Our record indicates that recent summer temperatures on Svalbard are greater than even the warmest periods at that time."
phys.org...
Add to this the fact that the Baffin Ice Caps have also now retreated further than they were before the start of the MWP and you start to get an intriguing picture build.
www.sciencedaily.com...
Edit: not sure what carbon credits have to do with science or how warm the world is/was, but I do agree that they are just a big scam Politics should never be allowed to mix with scienice. In fact, politics should always stay locked away in a deep, dark dungeon - at least 2 floors below the torture chamber - where it can do the least harm.
edit on 2-10-2012 by AndyMayhew because: (no reason given)
reply to post by 1littlewolf
Thanks for posting the realities that show EU is wrong, but he'll still be denying GW even when the waves are washing over Florida.
It is like a madness that has evolved beyond any chance of a good resolution for some.
Thanks for posting the realities that show EU is wrong, but he'll still be denying GW even when the waves are washing over Florida.
It is like a madness that has evolved beyond any chance of a good resolution for some.
reply to post by AndyMayhew
At this point, it takes a serious level of denial that GW is not a huge looming factor in our live.
More and more information keeps coming out that denial takes real effort.
I agree, the whole carbon credit idea is horribly wrong.
At this point, it takes a serious level of denial that GW is not a huge looming factor in our live.
More and more information keeps coming out that denial takes real effort.
I agree, the whole carbon credit idea is horribly wrong.
Originally posted by AndyMayhew
The problem with science is that unlike religion, it's constantly changing as new data comes to light. So you always have to look at the most recent research.
New data doesn't always mean better, you just have to look at the whole Hockey Stick scam to find that out.
BTW, did you even read the entire article you posted?...
Western Svalbard began to gradually warm in 1600, the researchers found, when the northern arm of the Gulf Stream, known as the West Spitsbergen Current, may have brought more tropical water to the region. In 1890, the warming began to accelerate, with researchers attributing most of the warming since about 1960 to rising industrial greenhouse gas levels. Ice cores from Svalbard, by contrast, show a slight cooling over the last 1,800 years. The conflicting evidence suggests that temperatures may have fluctuated more sharply between winter and summer, said Anne Hormes, a quaternary geologist at the University Centre in Svalbard who was not involved in the study.
...
phys.org...
They even say there is conflicting evidence. Since many other research state that it was warmer, then logic would dictate that the conflicting evidence is the new data these scientists brought up. Either that or as the study suggests temperatures fluctuated sharply between winter and summer, EXACTLY like the ongoing Climate Change has done.
Do you forget how many COLD records have been set during the ongoing Climate Change?... In many parts of the world winters were COLDER than in 100 years or more.
BTW, in the research you posted those scientists studied the unsaturated fat of algae, but the fact is that algae grow faster with higher levels of CO2. Since during the Medieval Warm Period CO2 levels were much LOWER than now algae would have less food to eat hence even the ones that survived would not have as much unsaturated fat as now.
In case you didn't know there is a symbiosis between Algae and coral polyp. The coral polyp gives to the algae CO2 and other substances meanwhile the algae gives off oxygen and other nutrients which the polyp uses. The less CO2 there is, the less food these animals have, hence the less saturated fat that the algae will have.
I just debunked that research paper you gave in 2 minutes.
Originally posted by AndyMayhew
Add to this the fact that the Baffin Ice Caps have also now retreated further than they were before the start of the MWP and you start to get an intriguing picture build.
www.sciencedaily.com...
Kind of funny that new research says quite the contrary to what the above research states. Not to mention that other research made in the past also state that it was WARMER and not cooler than now...
...
A continuous record of marine coastal conditions may be found in the raised beach sequences of Arctic Canada. These beaches have become elevated because of postglacial rebound from removal of the glacial ice load. Raised beaches were searched for the remains of bowhead whales and for former dwelling of Paleoeskimos. When dated by radiocarbon dating methods, whale bones can reveal when summer open water (ice-free Northwest Passage) permitted access to regions not accessible historically. Paleoeskimos tended to camp very close to the shoreline. Therefore, the number and sizes of dwellings on raised beaches are a good indication of former population levels. Dwellings may also be datable by radiocarbon methods using food bones or hearth charcoal.
...
Numerous sites have been surveyed along the length of the Northwest Passage. The eastern and western approaches have become reliably ice-free in summer under historical climatic conditions, whereas in the central part summer sea ice has been persistent. The radiocarbon-dated bowhead whale remains indicate that the whales were able to range along the length of the Passage during two intervals (centered on 9000 years ago and 1000 years ago) and that they were able to access the central part from the east about 4000 years ago. During the first of these intervals (9000 before present) ice cores indicate that summer temperatures were about 3°C warmer than mid 20th Century. Therefore, a warming of 3°C exceeds the opening threshold. Medieval Warm Period temperatures were probably about 1°C warmer than mid-20th Century, which is likely close to threshold conditions for an opening of the passage.
...
www.nrcan.gc.ca...
Read that research.
Since far more research states that it was warmer during the Medieval Warm Period, and since the research you gave clearly has conflicting results, then logic dictates that the Medieval Warm Period was WARMER than the present, even in the Arctic.
edit on 3-10-2012 by ElectricUniverse because: (no reason given)
Originally posted by AndyMayhew
Edit: not sure what carbon credits have to do with science or how warm the world is/was, but I do agree that they are just a big scam Politics should never be allowed to mix with scienice. In fact, politics should always stay locked away in a deep, dark dungeon - at least 2 floors below the torture chamber - where it can do the least harm.edit on 2-10-2012 by AndyMayhew because: (no reason given)
AGW is not based on science, it is based on BELIEF. The BELIEF that the Hockey Stick graph is right, and since it is still extrapolated to the work of other researchers who sold their soul for more money/funding, this extrapolation of data, which includes the Hockey Stick graph is still wrong.
The AGW camp also uses GCMs, which as I have shown several research states are flawed to a fault and are not reliable. This is the reason why the AGW camp has had to recalibrate, and change the results of their GCMs because their predictions have been wrong.
Perhaps you forget that for several years the AGW camp of scientists were claiming for example that "next year there will be no ice in the Arctic/Antarctic" yet they were wrong each, and every time...
As for politics, yes it should not be involved with science, but these days not only is politics involved in science but also business from corporations have increase due to the AGW scam.
edit on 3-10-2012 by ElectricUniverse because: (no reason given)
Originally posted by poet1b
Thanks for posting the realities that show EU is wrong, but he'll still be denying GW even when the waves are washing over Florida.
It is like a madness that has evolved beyond any chance of a good resolution for some.
WRONG again, I showed that your friend is wrong in everything he BELIEVES concerning AGW/Climate Change...
BTW, extreme weather events DOES NOT MAKE THE AGW FARCE REAL...
You obviously have not read any of the research I have posted... In the past NATURAL Climate Changes have caused floods, tunamies, and other NATURAL violent weather which affected entire civilizations to the point of destroying them... We still haven't reached that point in the ongoing NATURAL Climate Change...
edit on 3-10-2012 by ElectricUniverse because: (no reason given)
Originally posted by poet1b
At this point, it takes a serious level of denial that GW is not a huge looming factor in our live.
More and more information keeps coming out that denial takes real effort.
I agree, the whole carbon credit idea is horribly wrong.
Do you forget the fact that as in the past GW/Climate Change has been and is NATURAL?...
The ongoing warming began since the 1600s... It didn't all begin during the industrial revolution, and during the time that NATURAL Global Warming reached it's peak the sun's activities had been reaching record highs not seen in about 1,000 years...
The denial obviously comes from you and the other members who still cling to the religion that is AGW...
Not even when your idols were caught infraganti lying, and posting false data...
Not even when they had to admit they had published false data and flase claims to FORCE governments to jump in the AGW bandwagon...
Not even when the GCMs loved so much by the AGW camp have been shown to be flawed to a fault...
The denial comes from you, and those who believe like you in AGW...
This is an article on a planned expedition to the Beauford Sea to monitor Methane emissions off the coast of Alaska.
m.phys.org...
This group will be lowering down a remote controlled submarine to look at what these plumes are doing to the sea bed. There are concerns that the release of these methane hydrates could also alter the sea bed, create underwater slides and possible tsunamis.
I wonder how much we will learn about this over the next several months.
reply to post by ElectricUniverse
If nothing else Electric Universe I am enjoying this and you will be the first person I've ever added to my list of 'respected rivals' (and I've argued with a lot of people here).
Unfortunately I'm travelling around a bit at the moment and will be unable to respond in a manner your posts truly deserve for at least another 5 days as will only be able to access ATS on my phone. I'll let you know when I'm back.
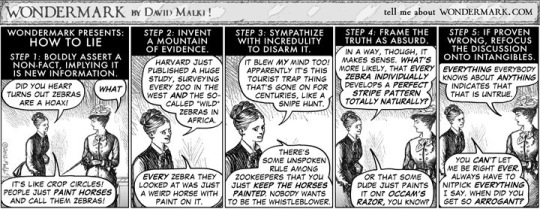
edit on 4/10/2012 by 1littlewolf because: (no reason given)
so we'll have a few thousand years of no arctic ice, then when it starts coming back people will get all worried that humans are causing global
cooling
Originally posted by ElectricUniverse
I just debunked that research paper you gave in 2 minutes.
Wow! You must write to the Journal then. You're a genius.
Originally posted by AndyMayhew
Add to this the fact that the Baffin Ice Caps have also now retreated further than they were before the start of the MWP and you start to get an intriguing picture build.
www.sciencedaily.com...
Kind of funny that new research says quite the contrary to what the above research states. Not to mention that other research made in the past also state that it was WARMER and not cooler than now...
What new research? Has it now been shown that the ice caps are not less extensive
Medieval Warm Period temperatures were probably about 1°C warmer than mid-20th Century, which is likely close to threshold conditions for an opening of the passage.
...
Read that research.
Since far more research states that it was warmer during the Medieval Warm Period, and since the research you gave clearly has conflicting results, then logic dictates that the Medieval Warm Period was WARMER than the present, even in the Arctic.
It says nothing of the sort. It says it was probably warmer in the MWP than it was 60 years ago. But that does not mean it was warmer then than it is now.
Saying carbon credits are being used as an excuse to promote global warming is also silly.
When GW starts creating disasters, it is the governments on every level who have to foot the bill for cleanup. It wrecks the economy. If pandemics are created, it can bring an economy to its knees by debilitating the workforce. Just look how hard industries are hit with minor problems. Imagine what a larger scale will do. Fact is, considering the economic, social, even psychological crush that any country in the world can face, it is the government's best interest to prevent it, not promote it.
In 2011 in the US alone, disasters cost taxpayers $53 billion dollars.
The most that could ever hope to be made off of carbon credits is $50 billion. As GW increases, so will the disasters and other nasties that go with it, and you will see that cost go up significantly.
edit on 4-10-2012 by nixie_nox because: (no reason given)
new topics
-
Big Storms
Fragile Earth: 29 minutes ago -
Where should Trump hold his next rally
2024 Elections: 3 hours ago -
Shocking Number of Voters are Open to Committing Election Fraud
US Political Madness: 3 hours ago -
Gov Kristi Noem Shot and Killed "Less Than Worthless Dog" and a 'Smelly Goat
2024 Elections: 4 hours ago -
Falkville Robot-Man
Aliens and UFOs: 4 hours ago -
James O’Keefe: I have evidence that exposes the CIA, and it’s on camera.
Whistle Blowers and Leaked Documents: 5 hours ago -
Australian PM says the quiet part out loud - "free speech is a threat to democratic dicourse"...?!
New World Order: 6 hours ago -
Ireland VS Globalists
Social Issues and Civil Unrest: 6 hours ago -
Biden "Happy To Debate Trump"
2024 Elections: 7 hours ago -
RAAF airbase in Roswell, New Mexico is on fire
Aliens and UFOs: 7 hours ago
top topics
-
A Warning to America: 25 Ways the US is Being Destroyed
New World Order: 17 hours ago, 21 flags -
Blast from the past: ATS Review Podcast, 2006: With All Three Amigos
Member PODcasts: 9 hours ago, 13 flags -
James O’Keefe: I have evidence that exposes the CIA, and it’s on camera.
Whistle Blowers and Leaked Documents: 5 hours ago, 12 flags -
Biden "Happy To Debate Trump"
2024 Elections: 7 hours ago, 12 flags -
Australian PM says the quiet part out loud - "free speech is a threat to democratic dicourse"...?!
New World Order: 6 hours ago, 12 flags -
Mike Pinder The Moody Blues R.I.P.
Music: 9 hours ago, 8 flags -
What is the white pill?
Philosophy and Metaphysics: 9 hours ago, 6 flags -
Shocking Number of Voters are Open to Committing Election Fraud
US Political Madness: 3 hours ago, 5 flags -
Ireland VS Globalists
Social Issues and Civil Unrest: 6 hours ago, 5 flags -
RAAF airbase in Roswell, New Mexico is on fire
Aliens and UFOs: 7 hours ago, 5 flags
active topics
-
Candidate TRUMP Now Has Crazy Judge JUAN MERCHAN After Him - The Stormy Daniels Hush-Money Case.
Political Conspiracies • 817 • : RazorV66 -
Gov Kristi Noem Shot and Killed "Less Than Worthless Dog" and a 'Smelly Goat
2024 Elections • 31 • : Sookiechacha -
Big Storms
Fragile Earth • 5 • : nugget1 -
"We're All Hamas" Heard at Columbia University Protests
Social Issues and Civil Unrest • 290 • : TheWoker -
Post A Funny (T&C Friendly) Pic Part IV: The LOL awakens!
General Chit Chat • 7137 • : PorkChop96 -
Massachusetts Drag Queen Leads Young Kids in Free Palestine Chant
Social Issues and Civil Unrest • 21 • : ToneD -
Biden "Happy To Debate Trump"
2024 Elections • 49 • : TheMisguidedAngel -
Where should Trump hold his next rally
2024 Elections • 13 • : Edumakated -
Shocking Number of Voters are Open to Committing Election Fraud
US Political Madness • 6 • : marg6043 -
University of Texas Instantly Shuts Down Anti Israel Protests
Education and Media • 312 • : marg6043