It looks like you're using an Ad Blocker.
Please white-list or disable AboveTopSecret.com in your ad-blocking tool.
Thank you.
Some features of ATS will be disabled while you continue to use an ad-blocker.

Quake Watch 2012
page: 254share:
Prov,Date/Time UTC,Latitude,Longitude,Magnitude,Depth(Km),Location
nrcan,2011-09-09 19:41:30, 49.350, -127.220, 6.3, 35.5, 88 Km Wsw Of Gold R..Bc. [F]
nrcan,2011-09-09 19:44:43, 49.360, -127.210, 4.5, 35.1, 88 Km Wsw Of Gold R..Bc
nrcan,2011-09-09 19:59:10, 49.330, -127.200, 3.3, 35.6, 88 Km Wsw Of Gold R..Bc
nrcan,2011-09-09 20:07:25, 49.400, -127.180, 3.3, 29.5, 83 Km Wsw Of Gold R..Bc
nrcan,2011-09-09 20:09:34, 49.360, -127.200, 3.3, 37.2, 86 Km Wsw Of Gold R..Bc
nrcan,2011-09-09 20:12:02, 49.500, -127.180, 3.0, 29.0, 80 Km W Of Gold R..Bc
nrcan,2011-09-09 22:35:40, 49.420, -127.160, 2.9, 35.8, 82 Km Wsw Of Gold R..Bc
nrcan,2011-09-09 22:47:25, 49.420, -127.140, 2.8, 34.7, 80 Km Wsw Of Gold R..Bc
nrcan,2011-09-09 23:08:09, 49.430, -127.170, 2.6, 33.1, 81 Km Wsw Of Gold R..Bc
nrcan,2011-09-10 00:09:02, 49.440, -127.130, 2.0, 33.5, 79 Km Wsw Of Gold R..Bc
nrcan,2011-09-10 00:22:11, 49.440, -127.080, 1.9, 30.5, 75 Km Wsw Of Gold R..Bc
nrcan,2011-09-10 00:31:47, 49.370, -127.180, 1.8, 31.9, 85 Km Wsw Of Gold R..Bc
nrcan,2011-09-10 00:36:32, 49.460, -127.160, 1.8, 30.5, 80 Km Wsw Of Gold R..Bc
nrcan,2011-09-10 00:50:02, 49.430, -127.180, 2.5, 34.9, 82 Km Wsw Of Gold R..Bc
nrcan,2011-09-10 01:04:22, 49.400, -127.190, 2.4, 33.7, 85 Km Wsw Of Gold R..Bc
nrcan,2011-09-10 01:39:15, 49.430, -127.100, 2.1, 34.9, 77 Km Wsw Of Gold R..Bc
nrcan,2011-09-10 02:08:30, 49.440, -127.140, 2.4, 33.3, 79 Km Wsw Of Gold R..Bc
nrcan,2011-09-10 04:02:04, 49.390, -127.150, 3.0, 35.7, 82 Km Wsw Of Gold R..Bc
nrcan,2011-09-10 04:07:31, 49.420, -127.150, 2.0, 33.6, 81 Km Wsw Of Gold R..Bc
nrcan,2011-09-10 04:24:37, 49.430, -127.200, 2.0, 38.8, 84 Km Wsw Of Gold R..Bc
nrcan,2011-09-10 04:37:06, 49.340, -127.220, 2.3, 34.6, 89 Km Wsw Of Gold R..Bc
nrcan,2011-09-10 12:24:12, 49.440, -127.170, 1.5, 35.6, 82 Km Wsw Of Gold R..Bc
nrcan,2011-09-10 13:39:44, 49.480, -127.120, 2.4, 30.0, 77 Km W Of Gold R..Bc
nrcan,2011-09-10 14:00:00, 49.420, -127.180, 2.0, 33.0, 83 Km Wsw Of Gold R..Bc
nrcan,2011-09-10 14:57:24, 49.410, -127.190, 2.0, 28.8, 84 Km Wsw Of Gold R..Bc
nrcan,2011-09-10 15:38:39, 49.370, -127.150, 1.8, 41.8, 83 Km Wsw Of Gold R..Bc
nrcan,2011-09-10 16:45:02, 49.390, -127.150, 2.6, 41.0, 82 Km Wsw Of Gold R..Bc
nrcan,2011-09-10 16:59:50, 49.430, -127.190, 1.6, 38.8, 83 Km Wsw Of Gold R..Bc
nrcan,2011-09-10 17:27:50, 49.430, -127.120, 1.9, 40.3, 79 Km Wsw Of Gold R..Bc
nrcan,2011-09-10 17:31:36, 49.390, -127.140, 1.9, 40.2, 82 Km Wsw Of Gold R..Bc
nrcan,2011-09-10 18:25:51, 49.410, -127.110, 2.0, 42.0, 78 Km Wsw Of Gold R..Bc
nrcan,2011-09-10 19:34:26, 49.420, -127.080, 1.5, 35.3, 77 Km Wsw Of Gold R..Bc
nrcan,2011-09-10 19:35:07, 49.430, -127.190, 2.1, 36.9, 84 Km Wsw Of Gold R..Bc
nrcan,2011-09-10 20:51:35, 49.480, -127.040, 1.9, 16.1, 71 Km Wsw Of Gold R..Bc
nrcan,2011-09-10 21:01:29, 49.410, -127.200, 2.2, 38.3, 85 Km Wsw Of Gold R..Bc
nrcan,2011-09-10 21:29:51, 49.430, -127.150, 2.0, 40.2, 81 Km Wsw Of Gold R..Bc
nrcan,2011-09-10 21:31:44, 49.410, -127.090, 2.1, 41.8, 77 Km Wsw Of Gold R..Bc
nrcan,2011-09-10 21:43:48, 49.410, -127.380, 1.7, 38.0, 97 Km Wsw Of Gold R..Bc
nrcan,2011-09-10 22:48:54, 49.330, -127.190, 1.8, 43.2, 87 Km Wsw Of Gold R..Bc
nrcan,2011-09-10 23:43:12, 49.430, -127.190, 1.7, 36.2, 83 Km Wsw Of Gold R..Bc
nrcan,2011-09-11 01:04:17, 49.430, -127.120, 1.9, 37.4, 78 Km Wsw Of Gold R..Bc
nrcan,2011-09-11 10:52:19, 49.380, -127.150, 3.0, 37.2, 82 Km Wsw Of Gold R..Bc
nrcan,2011-09-12 14:12:20, 49.390, -127.170, 2.4, 35.5, 84 Km Wsw Of Gold R..Bc
nrcan,2011-09-12 15:54:17, 49.350, -127.190, 2.0, 39.0, 87 Km Wsw Of Gold R..Bc
nrcan,2011-09-12 17:06:41, 49.400, -127.230, 1.6, 30.9, 87 Km Wsw Of Gold R..Bc
nrcan,2011-09-12 17:12:36, 49.350, -127.150, 3.2, 38.8, 84 Km Wsw Of Gold R..Bc
nrcan,2011-09-12 19:35:33, 49.390, -127.230, 1.9, 29.1, 88 Km Wsw Of Gold R..Bc
nrcan,2011-09-13 03:35:26, 49.410, -127.210, 2.2, 35.1, 85 Km Wsw Of Gold R..Bc
nrcan,2011-09-13 08:10:44, 49.400, -127.160, 1.7, 32.6, 82 Km Wsw Of Gold R..Bc
nrcan,2011-09-13 09:49:34, 49.430, -127.210, 2.0, 36.5, 85 Km Wsw Of Gold R..Bc
nrcan,2011-09-13 17:13:45, 49.450, -127.190, 2.8, 35.9, 82 Km Wsw Of Gold R..Bc
nrcan,2011-09-13 17:30:25, 49.380, -127.170, 1.9, 37.3, 84 Km Wsw Of Gold R..Bc
nrcan,2011-09-14 00:31:17, 49.390, -127.220, 1.9, 35.0, 87 Km Wsw Of Gold R..Bc
nrcan,2011-09-14 02:56:25, 49.390, -127.200, 1.7, 32.9, 85 Km Wsw Of Gold R..Bc
nrcan,2011-09-14 05:58:46, 49.440, -127.170, 1.8, 36.3, 82 Km Wsw Of Gold R..Bc
nrcan,2011-09-14 09:14:49, 49.160, -128.260, 2.7, 10.0, 167 Km Wsw Of Gold R..Bc
nrcan,2011-09-14 10:13:00, 49.390, -127.140, 1.8, 29.9, 81 Km Wsw Of Gold R..Bc
nrcan,2011-09-14 14:25:38, 49.340, -127.190, 2.1, 35.7, 87 Km Wsw Of Gold R..Bc
nrcan,2011-09-15 05:54:06, 49.420, -127.200, 1.7, 33.9, 84 Km Wsw Of Gold R..Bc
nrcan,2011-09-15 11:02:09, 49.420, -127.190, 4.1, 35.2, 84 Km Wsw Of Gold R..Bc. [F]
Out of space. Get the idea?
reply to post by westcoast
So what I am saying is that maybe these areas do not get many aftershocks. We would need more historical data to be certain of that. I am not concerned about it yet.
So what I am saying is that maybe these areas do not get many aftershocks. We would need more historical data to be certain of that. I am not concerned about it yet.
2.5 M Oklahoma.
earthquake.usgs.gov...
The reason this crap scares the hell out of me is it's not just region and specific to each well and injection site. These earthquakes are connected. This most recent one is in a new area again. Not in a trend all some fault. This is not neccessary from a frack or injection well. The google map is old- what three years or more? So, the area shows no wells but that doesn't mean they popped one up 6 months ago. Also, the depth. It's a bit deeper. I've been watching for apogee which is coming up. Things seem to have not hit a lull, but. nothing. It's damned statistics again.
Anyway. The new quake is about 30 km northeast of the other "trends" closer to Oklahoma City.
Oops. I mean northwest of that other trend. Well, it's not my fault. There's just too many trends. I can't tell which way there leading, coming or going. It's seems so hapzard with no ryhme or reason. It's almost unatural.
That's what spooks me. Things that are unatural. Like artifical sweetners. and twinkies.
sorry, there is kinda pattern i suppose. like that report said, the epicenters kinda seem to be located within a few kilometers of fracking pads or injection wells. so, it's not exactly haphazard. but it sure doesn't act like fault zones like the New Madrid where a clear trend can be distinguished.
earthquake.usgs.gov...
The reason this crap scares the hell out of me is it's not just region and specific to each well and injection site. These earthquakes are connected. This most recent one is in a new area again. Not in a trend all some fault. This is not neccessary from a frack or injection well. The google map is old- what three years or more? So, the area shows no wells but that doesn't mean they popped one up 6 months ago. Also, the depth. It's a bit deeper. I've been watching for apogee which is coming up. Things seem to have not hit a lull, but. nothing. It's damned statistics again.
Anyway. The new quake is about 30 km northeast of the other "trends" closer to Oklahoma City.
Oops. I mean northwest of that other trend. Well, it's not my fault. There's just too many trends. I can't tell which way there leading, coming or going. It's seems so hapzard with no ryhme or reason. It's almost unatural.
That's what spooks me. Things that are unatural. Like artifical sweetners. and twinkies.
edit on 31-10-2012 by ericblair4891 because: (no reason given)
sorry, there is kinda pattern i suppose. like that report said, the epicenters kinda seem to be located within a few kilometers of fracking pads or injection wells. so, it's not exactly haphazard. but it sure doesn't act like fault zones like the New Madrid where a clear trend can be distinguished.
edit on 31-10-2012 by ericblair4891 because: (no reason given)
reply to post by SeekingDepth
What the hell? This doesn't jive with CERI's info. I know the USGS only has 2.5M+. The Oklahoma site doesn't have the most recent 2.5 yet. CERI does keep track of the smaller ones but does not have the 2.0M for today at 10:06 UTC. There's another one listed for the 30th which CERI doesn't have. Are they mine blasts or something or am I tired? My head hurts.
Thanks for the link for the Oklahoma site. I was content on just keeping track on the other maps and watching FCAR. Most for Oklahoma show up there. But not all I see. Naturally occuring. Oklahoma's earthquake average increased tenfold, is it? Or more. And somehow it's all natural and a fluke. Trick or treat.
Had to add. From the FAQ on the Oklahoma Geo site,
"Are all these earthquakes unusual?.
Yes the number of earthquakes felt in 2009 and 2010 are unusual. The frequency of earthquakes has temporarily increased in Oklahoma, these earthquakes do not appear to be inconsistent with what might be called normal seismicity for Oklahoma."
For real? They are not inconsistent. Ha. Wait. You forget to mention that the "temporarily" increased (expoential increase) has continued into 2011 and 2012. Talk about not updating your information.
scary stuff
edit on 31-10-2012 by ericblair4891 because: (no reason given)
reply to post by ericblair4891
Yes I agree I wish they would update their info. It is useful for looking at the smaller quakes in OK.
Not sure what the GeoRSS Atom feed is but this was at the bottom of the recent quakes list:
This data is also available as a GeoRSS Atom feed which means you can subscribe to this information from your favorite news reader which supports GeoRSS. Simply copy the link and subscribe to this link. wichita.ogs.ou.edu...
edit on 31-10-2012 by SeekingDepth because: (no reason given)
reply to post by ericblair4891
The feed that I use from USGS is the 7 day Mag 1+ file but the first Oki quake I checked on the 2nd Oct @0810 is NOT in the list yet it is a 1.9
California, Montana, Alaska all down to Mag 1 but in fact NONE of those quakes are in the USGS listing other than these ones:
It would seem that despite saying the feed is 1 Mag 1+ it is NOT - only for Cali, Alaska and Montana/Yellowstone. Basically all the places where the quakes are NOT fracking induced it seems? That is what it is beginning to look like.
@seekingdepth
That sends the earthquakes to your RSS reader such as your email client (MS Outlook etc) or can also be used in your browser.
In MS Outlook what you end up with is this:
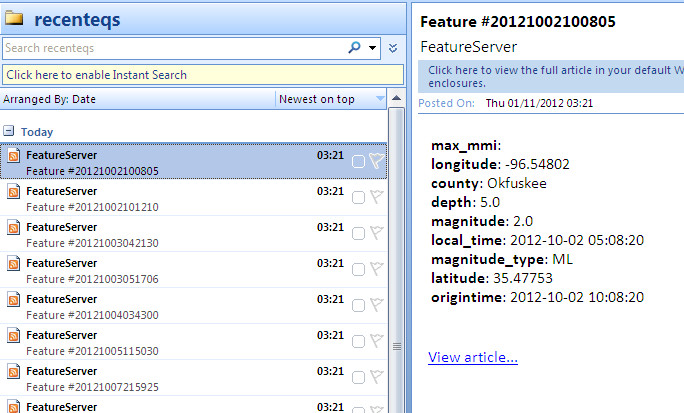
I just tried going to the article however and it tries to install the feed again so I think they have something wrong there.
Looks as if they use an atom file for the details. Not so good as Outlook thinks it is another feed. Sounds like this was designed for browser RSS.
The feed that I use from USGS is the 7 day Mag 1+ file but the first Oki quake I checked on the 2nd Oct @0810 is NOT in the list yet it is a 1.9
California, Montana, Alaska all down to Mag 1 but in fact NONE of those quakes are in the USGS listing other than these ones:
Prov,Date/Time UTC,Latitude,Longitude,Magnitude,Depth(Km),Location
usgs,2012-11-01 00:40:37, 35.908, -96.902, 2.5, 15.5, Oklahoma
usgs,2012-10-29 15:45:25, 35.497, -97.276, 2.2, 5.0, Oklahoma
usgs,2012-10-28 04:00:34, 35.465, -96.581, 3.1, 4.9, Oklahoma
usgs,2012-10-21 10:44:15, 35.653, -97.215, 3.4, 5.0, Oklahoma
usgs,2012-10-17 04:42:40, 35.678, -97.115, 3.2, 5.0, Oklahoma
usgs,2012-10-10 12:41:46, 35.554, -97.366, 2.9, 4.2, Oklahoma City Urban Area. Oklahoma
usgs,2012-10-09 08:49:07, 36.083, -97.386, 3.3, 8.9, Oklahoma
It would seem that despite saying the feed is 1 Mag 1+ it is NOT - only for Cali, Alaska and Montana/Yellowstone. Basically all the places where the quakes are NOT fracking induced it seems? That is what it is beginning to look like.
@seekingdepth
Not sure what the GeoRSS Atom feed is but this was at the bottom of the recent quakes list:
That sends the earthquakes to your RSS reader such as your email client (MS Outlook etc) or can also be used in your browser.
In MS Outlook what you end up with is this:
I just tried going to the article however and it tries to install the feed again so I think they have something wrong there.
Looks as if they use an atom file for the details. Not so good as Outlook thinks it is another feed. Sounds like this was designed for browser RSS.
edit on 1/11/2012 by PuterMan because: (no reason given)
update to post by PuterMan
Just an update: Seems that it is not just Canada who are behind. One for QCI just came through now from EMSC at 1140 UTC but the quakes, a 4.4, was at 03:27.
This follows straight after the 4.9 so it is still popping them off.
Just an update: Seems that it is not just Canada who are behind. One for QCI just came through now from EMSC at 1140 UTC but the quakes, a 4.4, was at 03:27.
This follows straight after the 4.9 so it is still popping them off.
Hey Quakers!! It is only 9:09 central standard time and we have already had 6 5.0+ quakes around the world.
Looks as though it will be a busy day.
earthquake.usgs.gov...
Looks as though it will be a busy day.
earthquake.usgs.gov...
Head is pounding and sinuses ache. Raining. I can't remember when it started. I'm displaced and the first big thing I run into is something big that
ran into me. A freaking hurricane in Oct. The ducks like it. There must be thirty ducks in the backyard right now. Pain. It must be because we're an
hour away from apogee? Day of the Dead. I look and feel like a Mexican Death Doll. Maybe the earth is having some pains with those 5M's.
As for Oklahoma. It pains me to say my study is a flop. I must conclude that Oklahoma is constantly having earthquakes on a daily basis. And therefore, there is no way to correlate them with anything else in the region. There's a wood duck that's hanging out with the mallards.
Oklahoma is a write off. It is the state of tears.
The saddest thing though is that, there's
Many more still to be shed.
I'm a masocist. I went to the Oklahoma site to see if they update the latest 2.5m and to see if the location is indeed correct. Because it's a new area. Yup. It's not clumped with the others. But what's this. The freaking fracking depth is different. Is anyone actually checking anything. I doubt it. That's enough.
Oh, and if you want to know more about the plan behind natural gas, i wrote in my kooky korner(aka robinesque). Trans Can Pipes is spending a billion dollars for a Mexican natural gas pipeline.
Looks like we're really "cooking with gas", and when the glut is over, we'll be back to those bigger quakes like we had last year.
Oh, and this relates. But don't expect me to hook up the wires and connect it. Venice had some major flooding. The tides helped to bring up the water over 100 cm.
www.telegraph.co.uk...
Yes, yes I'm a masocist. The USGS and Oklahoma have different locations. I suppose they're in the same general area so what the heck.
As for Oklahoma. It pains me to say my study is a flop. I must conclude that Oklahoma is constantly having earthquakes on a daily basis. And therefore, there is no way to correlate them with anything else in the region. There's a wood duck that's hanging out with the mallards.
Oklahoma is a write off. It is the state of tears.
The saddest thing though is that, there's
Many more still to be shed.
I'm a masocist. I went to the Oklahoma site to see if they update the latest 2.5m and to see if the location is indeed correct. Because it's a new area. Yup. It's not clumped with the others. But what's this. The freaking fracking depth is different. Is anyone actually checking anything. I doubt it. That's enough.
Oh, and if you want to know more about the plan behind natural gas, i wrote in my kooky korner(aka robinesque). Trans Can Pipes is spending a billion dollars for a Mexican natural gas pipeline.
Looks like we're really "cooking with gas", and when the glut is over, we'll be back to those bigger quakes like we had last year.
edit on 1-11-2012 by ericblair4891 because: (no reason given)
Oh, and this relates. But don't expect me to hook up the wires and connect it. Venice had some major flooding. The tides helped to bring up the water over 100 cm.
www.telegraph.co.uk...
edit on 1-11-2012 by ericblair4891 because: (no reason given)
edit on 1-11-2012 by ericblair4891 because: (no reason
given)
Yes, yes I'm a masocist. The USGS and Oklahoma have different locations. I suppose they're in the same general area so what the heck.
edit on 1-11-2012 by ericblair4891 because: (no reason given)
reply to post by ericblair4891
Yup. I am sorting all their data from 1897 onwards to see what patterns I can see. 2008 is weird - only 2 quakes?
The freaking fracking depth is different. Is anyone actually checking anything. I doubt it. That's enough.
Yup. I am sorting all their data from 1897 onwards to see what patterns I can see. 2008 is weird - only 2 quakes?
New Zealand Earthquakes October Summary
Oct All, interactive Map
Oct 3+, interactive Map
1211 quakes (65 revised), (199 reviewed), (95 felt)
5's= 2 (5.24, 5.54) = 4171.457 TTNT
4's= 24 (4.01 to 4.93) = 1977.728 TTNT
3's= 168 (3.00 to 3.95) = 441.041 TTNT
2's= 749 (2.0 to 2.99) = 89.616 TTNT
1's= 267 (1.01 to 1.99) = 2.066 TTNT
Total Energy Released 6681.909TTNT
Data accessed from Geonet using QVS Data Pro
ETA: you probably need a chart with that info.
*numbers may differ from the charts on my blog, as this here is revised data for Oct, the others are not
FWIW 894,461.548 TTNT released this year, so far
2011= 595,773 TTNT (no mag 7's)
That 7.148 ML South of Taranaki in July this year really blew the figures up for 2012.
All calc's are in ML BTW, for both years
Oct All, interactive Map
Oct 3+, interactive Map
1211 quakes (65 revised), (199 reviewed), (95 felt)
5's= 2 (5.24, 5.54) = 4171.457 TTNT
4's= 24 (4.01 to 4.93) = 1977.728 TTNT
3's= 168 (3.00 to 3.95) = 441.041 TTNT
2's= 749 (2.0 to 2.99) = 89.616 TTNT
1's= 267 (1.01 to 1.99) = 2.066 TTNT
Total Energy Released 6681.909TTNT
Data accessed from Geonet using QVS Data Pro
ETA: you probably need a chart with that info.
*numbers may differ from the charts on my blog, as this here is revised data for Oct, the others are not
edit on 1-11-2012 by muzzy because: (no reason given)
FWIW 894,461.548 TTNT released this year, so far
2011= 595,773 TTNT (no mag 7's)
That 7.148 ML South of Taranaki in July this year really blew the figures up for 2012.
All calc's are in ML BTW, for both years
edit on 1-11-2012 by muzzy because: (no reason given)
reply to post by muzzy
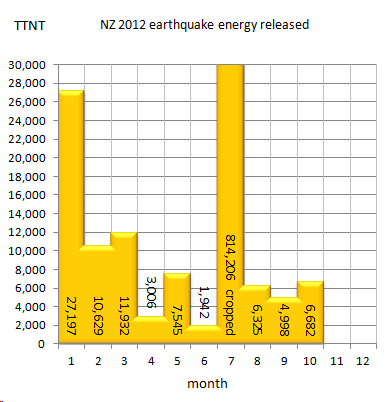
just in case anyone is interested ( I don't get too many hits on my graphs page for NZ) here is the graph by the month for 2011.
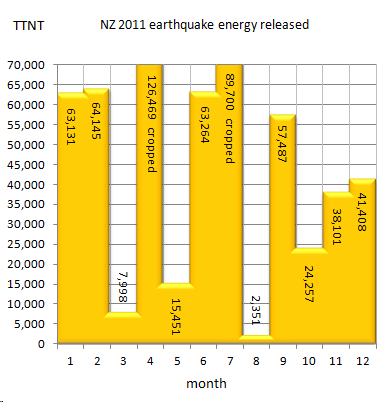
*note the scale is at 70000 versus the 2012 one at 30000
Interesting how the bars are higher but overall the year count is down on 2012, thats what 7's can do.
As I was on this graph track I though hmmm I'll do one for 2010 and 2009 too, but I didn't have the data for 2009 handy so went to Geonet search to get it.
WTF? there is no data after the 20th July for 2009, about 5 days after the Dusky Sound 7.6
I know they said they were re analyzing from 2008 on, but to delete half the years data completely seems a bit drastic, unless;
1. they made a real hash of it back in 2009 and the plots are all wrong
2. they are covering up something (keep in mind that I take the line like some others here that the Dusky Sound 7.6 quake lead to the Christchurch events of 2010/2011 )
As it happens I have a download of all 2009 data taken on 24/07/2011 with 22,280 lines of events on my remote hard drive, so its not lost forever, and of course I have the daily CSV files I processed at the time. I wasn't doing interactive maps at that stage, just static image maps, maybe that is another project needs attending to.
ETA: Its OK don't panic I just found another way to get the data, it must be the Beta version of what they have been working on since Sept 1st 2012.
info.geonet.org.nz...
If you go down to
"All Quakes in a Date Range, Located with More than 60 Phases" and copy and paste that link into Notepad you can change the parameters to when you want the data from.
I changed it to
wfs-beta.geonet.org.nz...:quake&outputFormat=csv&cql_filter=orig intime>='2009-07-20'+AND+origintime8
and got the csv file for the missing 2009 months and in the new format where the year/month/ day time are in the same column and the status of all of them is "reviewed".
I'm wondering what the minimum number of phases are required to get on the list?
Only downside is the 2009 data onlyhas the magnitude to 2 Decimal Points whereas the csv's for 2012 still have to 4 DP if downloaded from here rather than the JSON'S 2 DP
just in case anyone is interested ( I don't get too many hits on my graphs page for NZ) here is the graph by the month for 2011.
*note the scale is at 70000 versus the 2012 one at 30000
Interesting how the bars are higher but overall the year count is down on 2012, thats what 7's can do.
As I was on this graph track I though hmmm I'll do one for 2010 and 2009 too, but I didn't have the data for 2009 handy so went to Geonet search to get it.
WTF? there is no data after the 20th July for 2009, about 5 days after the Dusky Sound 7.6
I know they said they were re analyzing from 2008 on, but to delete half the years data completely seems a bit drastic, unless;
1. they made a real hash of it back in 2009 and the plots are all wrong
2. they are covering up something (keep in mind that I take the line like some others here that the Dusky Sound 7.6 quake lead to the Christchurch events of 2010/2011 )
As it happens I have a download of all 2009 data taken on 24/07/2011 with 22,280 lines of events on my remote hard drive, so its not lost forever, and of course I have the daily CSV files I processed at the time. I wasn't doing interactive maps at that stage, just static image maps, maybe that is another project needs attending to.
ETA: Its OK don't panic I just found another way to get the data, it must be the Beta version of what they have been working on since Sept 1st 2012.
info.geonet.org.nz...
If you go down to
"All Quakes in a Date Range, Located with More than 60 Phases" and copy and paste that link into Notepad you can change the parameters to when you want the data from.
I changed it to
wfs-beta.geonet.org.nz...:quake&outputFormat=csv&cql_filter=orig intime>='2009-07-20'+AND+origintime8
and got the csv file for the missing 2009 months and in the new format where the year/month/ day time are in the same column and the status of all of them is "reviewed".
I'm wondering what the minimum number of phases are required to get on the list?
Only downside is the 2009 data onlyhas the magnitude to 2 Decimal Points whereas the csv's for 2012 still have to 4 DP if downloaded from here rather than the JSON'S 2 DP
edit on 1-11-2012 by muzzy because: (no reason given)
Originally posted by muzzy
As it happens I have a download of all 2009 data taken on 24/07/2011 with 22,280 lines of events on my remote hard drive, so its not lost forever, and of course I have the daily CSV files I processed at the time. I wasn't doing interactive maps at that stage, just static image maps, maybe that is another project needs attending to.
Just did a download of the whole of 2009 using that link/query line and got 22,218 lines, 412 of those had magnitude of -9, this must be the new "blank space" or "undetermined" as there were 415 of those on the original csv file lifted in 2011 too.
Not sure if this stuff is finalfinal but they were ALL "reviewed" under the Status column.
I will change my map tag parameters from "Number of Stations" (which actually had nothing in it since Sept 1st 2012 anyway) to "Number of Phases" now, if that is the way they want to do it.
edit on 1-11-2012 by muzzy because: (no reason given)
Earthquake Details
This event has been reviewed by a seismologist.
Magnitude
6.4
Date-Time
Friday, November 02, 2012 at 18:17:35 UTC
Saturday, November 03, 2012 at 02:17:35 AM at epicenter
Location
9.244°N, 126.245°E
Depth
54.5 km (33.9 miles)
Region
MINDANAO, PHILIPPINES
Distances
87 km (54 miles) ENE (67°) from Butuan, Mindanao, Philippines
102 km (63 miles) N (357°) from Hinatuan, Mindanao, Philippines
103 km (64 miles) SE (126°) from Surigao, Mindanao, Philippines
828 km (515 miles) SE (136°) from MANILA, Philippines
USGS
reply to post by lurksoften
Mr quick draw!
The alarm only just went off and by the time I had copied the details you beat me to it!
EMSC only have 5.8 mb which is ~6.05 Mw. No technical data yet so too early to say.
ETA: Potsdam have 6.0 Mw which would approximately agree with EMSC and is M - manually revised.
USGS gone high again???
edit on 2/11/2012 by PuterMan because: (no reason given)
reply to post by lurksoften
Hmmmmm, fireball over Seattle and 6.4 in Philippines. Just read a post on another thread that some of the booms are coinciding with fireball. I tell you Seattle take note of what just happened on East Coast. I tell you that these fireballs are warnings. The previous years storms on East Coast last year were there warnings. It will not let up the season has not even started yet. Next snow and cold and freezing on top of all the misery. Water levels in cities and streets are creating records of things to come.
Hmmmmm, fireball over Seattle and 6.4 in Philippines. Just read a post on another thread that some of the booms are coinciding with fireball. I tell you Seattle take note of what just happened on East Coast. I tell you that these fireballs are warnings. The previous years storms on East Coast last year were there warnings. It will not let up the season has not even started yet. Next snow and cold and freezing on top of all the misery. Water levels in cities and streets are creating records of things to come.
edit on 2-11-2012 by prophetboy12 because: (no reason
given)
reply to post by lurksoften
They did. Down to 6.1 Mw now.
Scardec also have 6.1
They did. Down to 6.1 Mw now.
Scardec also have 6.1
edit on 2/11/2012 by PuterMan because: (no reason given)
OK Something weird just happened. The Mag 7.7 in Canada came through again, and it is showing on the Canadian site.
There are two different reference numbers and the lat/lon/depth are all slightly different. 2 x Mag 7.7?? or some sort of computer glitch?
Sorry forgot the link: Table of Earthquakes in the last 30 days
2012/10/28 03:38:10 52.51 -132.03 20.0 4.5 No 83 km SSW of Sandspit,BC
2012/10/28 03:32:39 52.52 -131.78 20.0 4.2 No 81 km S of Sandspit,BC
2012/10/28 03:04:06 52.56 -132.29 20.0 7.7 Yes 83 km SW of Sandspit,BC.
2012/10/28 03:04:06 52.55 -132.24 23.2 7.7 No 83 km SSW of Sandspit,BC
2012/10/27 15:45:45 74.10 -70.54 18.0 3.1 No 285 km NE from Pond Inlet,NU
There are two different reference numbers and the lat/lon/depth are all slightly different. 2 x Mag 7.7?? or some sort of computer glitch?
Sorry forgot the link: Table of Earthquakes in the last 30 days
edit on 2/11/2012 by PuterMan because: (no reason given)
new topics
-
Gov Kristi Noem Shot and Killed "Less Than Worthless Dog" and a 'Smelly Goat
2024 Elections: 35 minutes ago -
Falkville Robot-Man
Aliens and UFOs: 49 minutes ago -
James O’Keefe: I have evidence that exposes the CIA, and it’s on camera.
Whistle Blowers and Leaked Documents: 1 hours ago -
Australian PM says the quiet part out loud - "free speech is a threat to democratic dicourse"...?!
New World Order: 2 hours ago -
Ireland VS Globalists
Social Issues and Civil Unrest: 2 hours ago -
Biden "Happy To Debate Trump"
Mainstream News: 3 hours ago -
RAAF airbase in Roswell, New Mexico is on fire
Aliens and UFOs: 3 hours ago -
What is the white pill?
Philosophy and Metaphysics: 4 hours ago -
Mike Pinder The Moody Blues R.I.P.
Music: 5 hours ago -
Putin, Russia and the Great Architects of the Universe
ATS Skunk Works: 8 hours ago
top topics
-
A Warning to America: 25 Ways the US is Being Destroyed
New World Order: 13 hours ago, 21 flags -
Biden "Happy To Debate Trump"
Mainstream News: 3 hours ago, 7 flags -
Mike Pinder The Moody Blues R.I.P.
Music: 5 hours ago, 7 flags -
What is the white pill?
Philosophy and Metaphysics: 4 hours ago, 5 flags -
Australian PM says the quiet part out loud - "free speech is a threat to democratic dicourse"...?!
New World Order: 2 hours ago, 5 flags -
James O’Keefe: I have evidence that exposes the CIA, and it’s on camera.
Whistle Blowers and Leaked Documents: 1 hours ago, 5 flags -
RAAF airbase in Roswell, New Mexico is on fire
Aliens and UFOs: 3 hours ago, 4 flags -
Putin, Russia and the Great Architects of the Universe
ATS Skunk Works: 8 hours ago, 3 flags -
Ireland VS Globalists
Social Issues and Civil Unrest: 2 hours ago, 3 flags -
Falkville Robot-Man
Aliens and UFOs: 49 minutes ago, 1 flags
active topics
-
Biden "Happy To Debate Trump"
Mainstream News • 35 • : WeMustCare -
Gov Kristi Noem Shot and Killed "Less Than Worthless Dog" and a 'Smelly Goat
2024 Elections • 16 • : Athetos -
Candidate TRUMP Now Has Crazy Judge JUAN MERCHAN After Him - The Stormy Daniels Hush-Money Case.
Political Conspiracies • 799 • : matafuchs -
University of Texas Instantly Shuts Down Anti Israel Protests
Education and Media • 297 • : cherokeetroy -
-@TH3WH17ERABB17- -Q- ---TIME TO SHOW THE WORLD--- -Part- --44--
Dissecting Disinformation • 699 • : Thoughtful3 -
Putin, Russia and the Great Architects of the Universe
ATS Skunk Works • 25 • : SchrodingersRat -
Ditching physical money
History • 22 • : StudioNada -
Falkville Robot-Man
Aliens and UFOs • 3 • : KKLOCO -
Krystalnacht on today's most elite Universities?
Social Issues and Civil Unrest • 10 • : xuenchen -
Russia Ukraine Update Thread - part 3
World War Three • 5736 • : YourFaceAgain