It looks like you're using an Ad Blocker.
Please white-list or disable AboveTopSecret.com in your ad-blocking tool.
Thank you.
Some features of ATS will be disabled while you continue to use an ad-blocker.

Michael Mann is a slimy little lying weasel and is getting ripped to shreds.
page: 9share:
a reply to: D8Tee
4.27 stars out of 5 with 198 ratings, not bad.
4.27 stars out of 5 with 198 ratings, not bad.
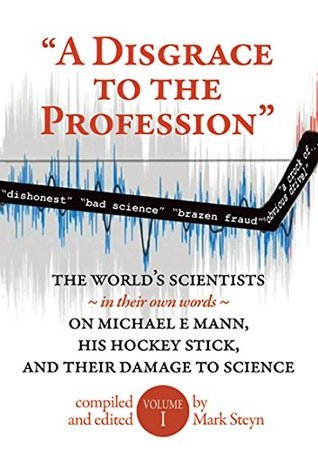
The "hockey stick" graph of global temperatures is the single most influential icon in the global-warming debate, promoted by the UN's transnational climate bureaucracy, featured in Al Gore's Oscar-winning movie, used by governments around the world to sell the Kyoto Accord to their citizens, and shown to impressionable schoolchildren from kindergarten to graduation.
And yet what it purports to "prove" is disputed and denied by many of the world's most eminent scientists. In this riveting book, Mark Steyn has compiled the thoughts of the world's scientists, in their own words, on hockey-stick creator Michael E Mann, his stick and their damage to science. From Canada to Finland, Scotland to China, Belgium to New Zealand, from venerable Nobel Laureates to energetic young researchers on all sides of the debate analyze the hockey stock and the wider climate wars it helped launch.
Judging a scientists credibility via amazon reviews of a think-tank funded journalist's denialist book?
Whatever next? Suppose it's less effort than attempting to grasp the actual science. :p
Whatever next? Suppose it's less effort than attempting to grasp the actual science. :p
originally posted by: D8Tee
Seems the understanding in the first IPCC report was that it wasn't global.
Temperature chart still shows it as visible.
It's disappeared from subsequent charts.
So you accept that even in the First IPCC report it was never suggested to be global.
From whence did the 'chart' come? If we know it wasn't suggested to be global and the data included in FAR showed a notable MWP, there's an obvious conclusion. Was it based on very specific localised data by any chance?
a reply to: melatonin
You are finally getting into the meat of the debate.
I, for one, do not accept that the Medieval Warming Period was not global in nature. Certainly not based on Micheal Mann's work.
In fact, the world and historians have always accepted that the Medieval Warming Period was global in nature.
I am now going to provide with a link to the IPPC report 1990 (The first one and the one within 2 years of Mann's study),
www.ipcc.ch...
You will have to download the report. Click on the link to Section 7.2 This is the executive summary. And it says specifically :
Please note two things about the passage I have quoted. The natural varience of global surface temperature (5.7 degrees) and the natural fluctuation rate of 2 degrees on a time scale of centuries or more.
Also not the word "the shorter Medieval Warm Period around 1000 AD (which may not have been global).
Note - he doesn't say somthing like.....was definitively not global in nature. He makes sure to hedge his statement.
MAY not have been global.
So up to at least 1990, the world believed the MWP was global in nature.
The Excutive Summary concludes:
"a global warming of larger size has almost certain occurred at least once since the end of the last glaciation without any appreciable increase in greenhouse gases". This little statement refers to MWP. A global MWP is proof of natural warming to the extent that we are currently experiencing.
Remember also that Mann testified before that house that the estimate of the warming that is apportioned to increase of greenhouse gases is 0.2 degrees C. and the natural variation is at least 2 degrees over a period of centuries or more.
The up pops Mann's tree ring study that purports to prove that tree rings can be used for temperature proxy. Mann develops the hockey stick graph and "proves" that the MWP was NOT global in nature.
Only Mann knows that he grafted the instrumental readings from 1960s onward to the graph to "hide the decline" in temperature. The "decline" proves that tree rings are not good temperature proxies and the hockey stick graph is pure fraud.
Since that time, the scientific community has debated whether or not the MWP was global in nature or not. You have mentioned studies that validate Mann's conclusions. I have mentioned studies that invalidated Mann's conclusions and provided direct evidence of tree lines where tree lines ought not to be if Mann's conclusions are correct.
It is a strong point of debate among scientists that has not yet been settled.
Remember the natural variation of global temperature appears to be 2 degrees celcius. Man's contribution to global warming appears to be 0.2 degrees C over 70 years!
You said "why don't you listen to the scientists". I have and I am not worried about global warming. And I certainly will not listen to the fraud and the liar that is Micheal Mann.
You are finally getting into the meat of the debate.
I, for one, do not accept that the Medieval Warming Period was not global in nature. Certainly not based on Micheal Mann's work.
In fact, the world and historians have always accepted that the Medieval Warming Period was global in nature.
I am now going to provide with a link to the IPPC report 1990 (The first one and the one within 2 years of Mann's study),
www.ipcc.ch...
You will have to download the report. Click on the link to Section 7.2 This is the executive summary. And it says specifically :
During this time, average global surface temperatures appear to have varied by about 5-7°C. Since the end of the last ice age, about 10,000 BP, globally averaged surface temperatures have fluctuated over a range of up to 2°C on time scales of centuries or more. Such fluctuations include the Holocene Optimum around 5,000-6,000 years ago. the shorter Medieval Warm Period around 1000 AD (which may not have been global) and the Little Ice Age which ended only in the middle to late nineteenth century. Details are often poorly known because palaeo-climatic data are frequently sparse.
Please note two things about the passage I have quoted. The natural varience of global surface temperature (5.7 degrees) and the natural fluctuation rate of 2 degrees on a time scale of centuries or more.
Also not the word "the shorter Medieval Warm Period around 1000 AD (which may not have been global).
Note - he doesn't say somthing like.....was definitively not global in nature. He makes sure to hedge his statement.
MAY not have been global.
So up to at least 1990, the world believed the MWP was global in nature.
The Excutive Summary concludes:
We conclude that despite great limitations in the quantity and quality of the available historical temperature data, the evidence points consistently to a real but irregular warming over the last century. A global warming of larger size has almost certainly occurred at least once since the end of the last glaciation without any appieciable increase in greenhouse gases. Because we do not understand the reasons for these past warming events it is not yet possible to attribute a specific proportion ol the recent, smaller, warming to an increase of greenhouse gases.
"a global warming of larger size has almost certain occurred at least once since the end of the last glaciation without any appreciable increase in greenhouse gases". This little statement refers to MWP. A global MWP is proof of natural warming to the extent that we are currently experiencing.
Remember also that Mann testified before that house that the estimate of the warming that is apportioned to increase of greenhouse gases is 0.2 degrees C. and the natural variation is at least 2 degrees over a period of centuries or more.
The up pops Mann's tree ring study that purports to prove that tree rings can be used for temperature proxy. Mann develops the hockey stick graph and "proves" that the MWP was NOT global in nature.
Only Mann knows that he grafted the instrumental readings from 1960s onward to the graph to "hide the decline" in temperature. The "decline" proves that tree rings are not good temperature proxies and the hockey stick graph is pure fraud.
Since that time, the scientific community has debated whether or not the MWP was global in nature or not. You have mentioned studies that validate Mann's conclusions. I have mentioned studies that invalidated Mann's conclusions and provided direct evidence of tree lines where tree lines ought not to be if Mann's conclusions are correct.
It is a strong point of debate among scientists that has not yet been settled.
Remember the natural variation of global temperature appears to be 2 degrees celcius. Man's contribution to global warming appears to be 0.2 degrees C over 70 years!
You said "why don't you listen to the scientists". I have and I am not worried about global warming. And I certainly will not listen to the fraud and the liar that is Micheal Mann.
a reply to: TiredofControlFreaks
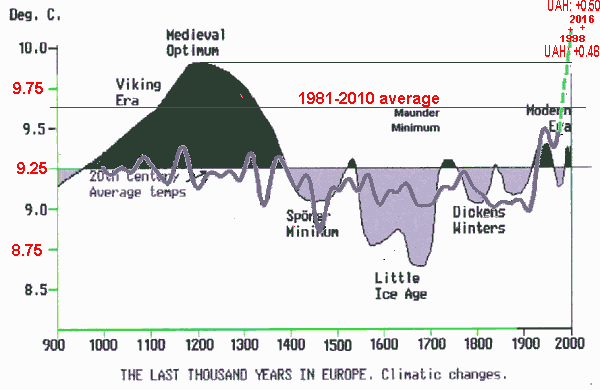
oh and the graph showing the MWP is a little further down on the page marked as 202.
oh and the graph showing the MWP is a little further down on the page marked as 202.
As you mentioned earlier, data is important.
Where is the data for the supposed global MWP? Of course temperatures vary naturally across time and space. We have seasons and day and night, for instance. Where I live we see temperature vary almost 20''C across a year due to seasons and day and night. This is due to natural influences.
No climate scientist worth the label would suggest that only human-induced influences affect climate. Not sure you're making a mind blowing point here. It's not a zero-sum game, we can have solar (natural etc) and human influences. We have El Nino and La NIna effects. Indeed, picking them apart has clarified the importance of human influences since the industrial era began.
One of the most destructive periods of historical climate change occurred when future humans were still picking ticks from each others fur in the African plains. The PETM event led to massive destruction of organisms due to a rapid increase in global temps of around 6-8'C. This was due to rapid carbon release into the atmosphere. We are currently releasing carbon faster than has been found during that extinction event.
Releasing massive amounts of carbon into the atmosphere has obvious effects that have been known about since Arrhenius in the late 19th century. The carbon we are burning has been locked up out of the ecosystem for millions of years. This really isn't rocket surgery.
And give up the fraud/lying BS. You can't even accept your own basic errors, haha.
1. Fraud dude to divergence problem. False
2. Global MWP. False.
3. Deming quote. False.
Not going well thus far, no?
a reply to: melatonin
yeah well so far, so far all the evidence you have provided consists in sum total:
YOU SAY SO
Up your game just a little to make this interesting for me.
Explain why you think "divergence" is false? Did the tree ring proxy data diverge from instrument data from about 1960?
Well yes! It did! What do you think the phrase "hide the decline is all about"?
originally posted by: TiredofControlFreaks
a reply to: melatonin
yeah well so far, so far all the evidence you have provided consists in sum total:
YOU SAY SO
Up your game just a little to make this interesting for me.
Explain why you think "divergence" is false? Did the tree ring proxy data diverge from instrument data from about 1960?
Well yes! It did! What do you think the phrase "hide the decline is all about"?
Heh, I can provide data. I also know it won't make a blindest bit of difference to you. So I'm allowing you to show the flaws in your own data.
1. Divergence problem. Has been known about since the original Mann study was published. If you read Britta et al 1998 you'll see it clearly discussed. Therefore it was not fraud and your claim was false. Just find the Britta paper, should be accessible to you. False. Now wee have the 'hide the decline' trope. They hid the decline so well it was obvious in Mann's original paper and has been discussed and understood since 1998. Hiding in plain sight, haha. Another False, but based on same divergence problem.
2. Global MWP. As your friend showed even the FAR never said it was global. So they disappeared a global MWP problem that wasn't suggested to be global. False.
3. Deming's supposed Overpeck quote. Again, your own information showed this to be a misrepresentation. False.
0/3. Going well.
edit on 4-4-2017 by melatonin because: extra added blah
Here, took me less than 5 minutes to find this for you...
Jacoby & D'Arrigo 1995
You are even more wrong, no? The divergence problem was noted in 1995, before the original Mann study was published.
'They' hide the decline so well, they've been publishing papers on it for over 20 years.
False
Ring width and density measurements from the same trees can produce distinctly different climatic information. Ring width variations and recorded data in central and northern Alaska indicate annual temperatures increased over the past century, peaked in the 1940s, and are still near the highest level for the past 3 centuries. Density variations indicate summer temperatures are now warm but not above some previous levels occurring prior to this century. The early cooler period, corresponding to the Little Ice Age, was interrupted by brief warm intervals. The recent increase in temperatures combined with drier years may be changing the tree response to climate and raising the potential for some forest changes in Alaskan and other boreal forests.
Jacoby & D'Arrigo 1995
You are even more wrong, no? The divergence problem was noted in 1995, before the original Mann study was published.
'They' hide the decline so well, they've been publishing papers on it for over 20 years.
False
originally posted by: TiredofControlFreaks
a reply to: melatonin
It is a strong point of debate among scientists that has not yet been settled.
Of course! Because it's constantly repeated in denialist arguments in books and on websites, that means there is still a 'strong' scientific debate over particular issues.
Sadly, as you kindly pointed out just saying something doesn't make it so.
To simplify, the plot that keeps getting posted from early IPCC reports is based on a study by Lamb from 1965. That's over 40 years ago. The data is focused on Central England. I doubt that any of you can dare to make the argument that such a dataset is, firstly, global (although many did think England the centre of the universe) and, secondly, a very robust analysis. Science moves on and improves. Stuck in a rut, much much.
So the 'chart' was never global and attempting to compare it to the wider ranging (still not global, though!) dendro data of Mann et al. is about as useful as comparing NFL to 'real' Football. Both have a world 'cup', of course, but one is more worldly than the other...
a reply to: melatonin
You know what - you are correct. I must withdraw my accusation of fraud based solely on the addition of the instrumental data to the tail end of the tree ring proxy data.
However, there are still some severe problems. Although "Mike's Nature Trick" was known in scientific circles, it was not known to the public. The movie by Al Gore did not make any explanations of the temperature reconnstruction that created the hockey stick.
Further, Mann's study is not considered reliable before 1400 and the MWP happened between 1100 and 1300 or so. On what basis was it decided that the MWP was not global in nature?
You mention other temperature proxies and as I have told you, I have other studies with other proxies that say different. Further, direct evidence of extended tree lines above where they are supposed to be have been found in Canada and Siberia as well as proxy studies in Antartica. This is clear evidence of a global MWP.
originally posted by: D8Tee
How complete do you think the instrumental record is for Africa in the 1930's?
originally posted by: amazing
originally posted by: TiredofControlFreaks
a reply to: amazing
1934 was the hottest year on record for the United states.
If you can't stand it now with air conditionings so freely availablle, it must of been hell back then.
My point is that so far - after 30 years of climate alarmism - we still haven't seen anything outside the normal natural variation of earths climate
Except that according to NASA 2005 remains the warmest year globally in the instrumental record, followed by 1998 and according to NASA, all 10 of the warmest years globally in the instrumental record have occurred after 1989. Keeping in mind that this is global average and that for certain areas like Las Vegas each year is breaking records. It's hell on earth now. Come visit me in July and we'll drive around and do some yard work and you can share my $400 a month power bill.
We have some idea. They study that...world tempuratures. One way is ice cores.
a reply to: TiredofControlFreaks
But you still miss the big picture. I don't think he is, but let's say that Michael Mann is a fraud and he's just saying what he's saying for the money.
What about the thousands of other scientists, hundreds of scientific organizations and associations, colleges, etc. Many of them privately funded or just doing good research.
Are they all in on Michael Mann's conspiracy? Because that would be the biggest conspiracy in the history of the earth.
Occum's razor would tell us that that is highly unlikely.
originally posted by: TiredofControlFreaks
a reply to: melatonin
On what basis was it decided that the MWP was not global in nature?
You mention other temperature proxies and as I have told you, I have other studies with other proxies that say different. Further, direct evidence of extended tree lines above where they are supposed to be have been found in Canada and Siberia as well as proxy studies in Antartica. This is clear evidence of a global MWP.
Sure, but they are still predominately northern hemisphere based. Plus, we'd have to have coherent temporal & spatial data to fully compare (i.e. did these warm periods happen concurrently?). That's exactly what studies like Mann's and those following have attempted to provide. The northern hemisphere proxy studies show some evidence of an MWP, but not so pronounced. The fewer southern hemisphere studies show no such MWP.
As I said earlier, actually a very valid criticism of most scientific fields - western, northern hemisphere, and English language bias. Improving, though.
edit on 4-4-2017 by melatonin because: naff italics
originally posted by: amazing
originally posted by: D8Tee
How complete do you think the instrumental record is for Africa in the 1930's?
originally posted by: amazing
originally posted by: TiredofControlFreaks
a reply to: amazing
1934 was the hottest year on record for the United states.
If you can't stand it now with air conditionings so freely availablle, it must of been hell back then.
My point is that so far - after 30 years of climate alarmism - we still haven't seen anything outside the normal natural variation of earths climate
Except that according to NASA 2005 remains the warmest year globally in the instrumental record, followed by 1998 and according to NASA, all 10 of the warmest years globally in the instrumental record have occurred after 1989. Keeping in mind that this is global average and that for certain areas like Las Vegas each year is breaking records. It's hell on earth now. Come visit me in July and we'll drive around and do some yard work and you can share my $400 a month power bill.
We have some idea. They study that...world tempuratures. One way is ice cores.
How complete do you think the instrumental record is for Africa in the 1930's was the question.
If the claim is going to be made that he 1930's, according to the instrumental record, were the hottest years only in the USA, and not globally, do you not see anything wrong with this, knowing that the African continent has virtually no instrumental record from that time frame?
edit on 4-4-2017 by D8Tee because: (no reason given)
The most recent collection of global paleoclimate data can be found in the 5th AR (2013). Figure 5-07 contains plots of the numerous proxy studies.
5th AR Paleo data
The northern hemi studies generally show a minor MWP, not so southern hemi. Global data summary, again, a minor MWP.
The early Mann study was a good effort, but there are many better studies which effectively provide the same interpretation. Attacking Mann for his early work is little more than political theatre and not actually helpful in understanding the science. Good if the aim is to throw polemic smoke bombs in an attempt to obscure the issues, though.
a reply to: melatonin
The MWP not being “global” is a red herring. In past epochs when the arctic was ice free (and thus many degrees warmer) the tropics were only a few degrees warmer. Climate models indeed predict that warming will be mainly at higher latitudes. At the MWP the slight warming in the north has been observed across Canada, Greenland, Europe, Japan, and Siberia. Pretty much covers it. Until very recently there has been very little data from the S. hemisphere, so that can’t be evaluated, and short-term the arctic and antarctic exhibit a see-saw. If there was less warming in the tropics at the MWP it would probably not even be detectable over noise.
The MWP not being “global” is a red herring. In past epochs when the arctic was ice free (and thus many degrees warmer) the tropics were only a few degrees warmer. Climate models indeed predict that warming will be mainly at higher latitudes. At the MWP the slight warming in the north has been observed across Canada, Greenland, Europe, Japan, and Siberia. Pretty much covers it. Until very recently there has been very little data from the S. hemisphere, so that can’t be evaluated, and short-term the arctic and antarctic exhibit a see-saw. If there was less warming in the tropics at the MWP it would probably not even be detectable over noise.
new topics
-
Mike Pinder The Moody Blues R.I.P.
Music: 34 minutes ago -
Putin, Russia and the Great Architects of the Universe
ATS Skunk Works: 3 hours ago -
A Warning to America: 25 Ways the US is Being Destroyed
New World Order: 8 hours ago
top topics
-
President BIDEN's FBI Raided Donald Trump's Florida Home for OBAMA-NORTH KOREA Documents.
Political Conspiracies: 13 hours ago, 31 flags -
A Warning to America: 25 Ways the US is Being Destroyed
New World Order: 8 hours ago, 13 flags -
Is AI Better Than the Hollywood Elite?
Movies: 15 hours ago, 4 flags -
Mike Pinder The Moody Blues R.I.P.
Music: 34 minutes ago, 2 flags -
Maestro Benedetto
Literature: 15 hours ago, 1 flags -
Putin, Russia and the Great Architects of the Universe
ATS Skunk Works: 3 hours ago, 1 flags
active topics
-
Alternate Electors vs Fake Electors - What is the Difference.
2024 Elections • 120 • : Threadbarer -
Gaza Terrorists Attack US Humanitarian Pier During Construction
Middle East Issues • 58 • : matafuchs -
Putin, Russia and the Great Architects of the Universe
ATS Skunk Works • 12 • : RussianTroll -
Truth Social goes public, be careful not to lose your money
Mainstream News • 132 • : matafuchs -
New whistleblower Jason Sands speaks on Twitter Spaces last night.
Aliens and UFOs • 67 • : Ophiuchus1 -
Mike Pinder The Moody Blues R.I.P.
Music • 1 • : RussianTroll -
Mood Music Part VI
Music • 3106 • : TheWoker -
University of Texas Instantly Shuts Down Anti Israel Protests
Education and Media • 275 • : Vermilion -
President BIDEN's FBI Raided Donald Trump's Florida Home for OBAMA-NORTH KOREA Documents.
Political Conspiracies • 22 • : 320MPH -
A Warning to America: 25 Ways the US is Being Destroyed
New World Order • 19 • : Cvastar