It looks like you're using an Ad Blocker.
Please white-list or disable AboveTopSecret.com in your ad-blocking tool.
Thank you.
Some features of ATS will be disabled while you continue to use an ad-blocker.

Michael Mann is a slimy little lying weasel and is getting ripped to shreds.
page: 10share:
a reply to: melatonin
Look at your figure 5.09 in the link you have provided.
Notice there is next to no proxy data for Africa?
It covers the same surface as 13 countries - including the United States, China and India - and the whole of Eastern Europe.
Same can be said of South America, Australia and most of Asia, there is virtually no proxy data from these places, how can you expect to recreate anything?
It's the same as saying the 1930's weren't the hottest years globally on instrumental record, that they were only the hottest years for the USA.
Well we don't have hardly any instrumental record for Africa ffs, how could we know what temperature it was?
edit on 4-4-2017 by D8Tee because: (no reason given)
originally posted by: D8Tee
originally posted by: amazing
originally posted by: D8Tee
How complete do you think the instrumental record is for Africa in the 1930's?
originally posted by: amazing
originally posted by: TiredofControlFreaks
a reply to: amazing
1934 was the hottest year on record for the United states.
If you can't stand it now with air conditionings so freely availablle, it must of been hell back then.
My point is that so far - after 30 years of climate alarmism - we still haven't seen anything outside the normal natural variation of earths climate
Except that according to NASA 2005 remains the warmest year globally in the instrumental record, followed by 1998 and according to NASA, all 10 of the warmest years globally in the instrumental record have occurred after 1989. Keeping in mind that this is global average and that for certain areas like Las Vegas each year is breaking records. It's hell on earth now. Come visit me in July and we'll drive around and do some yard work and you can share my $400 a month power bill.
We have some idea. They study that...world tempuratures. One way is ice cores.
How complete do you think the instrumental record is for Africa in the 1930's was the question.
If the claim is going to be made that he 1930's, according to the instrumental record, were the hottest years only in the USA, and not globally, do you not see anything wrong with this, knowing that the African continent has virtually no instrumental record from that time frame?
What scientists are telling us is that we've had some of the hottest temperatures, globally, on record. I don't know how far and how complete the records are but that's all we've got. Scientists work with the data they have. That's all they can do. Right?
And it's not just Ice Cores but sediments on the ocean floor, Coral and many other things where they can get an approximation of average global temperatures. You can look that up.
So it goes back to you. Are all of those scientists stupid, where as you can see the truth or are they in on some conspiracy? It has to be one or the other...or as I believe, they're giving us good data and telling us what's really happening.
What is more likely or probable? Every scientist is wrong...stupid...or right? That's the really question.
edit on 4-4-2017 by amazing
because: (no reason given)
Heh, at least it's a new argument with some degree of validity!
There is no absolute perfection in data. The proxy data needs to meet very specific criteria which limits from where they will be based. So, no, we don't have proxy data for very single region of the earth. We do have proxy data for many regions of the earth - and we can still make very valid conclusions from them.
Same applies to the instrumental record. No, we sadly don't have a time machine to go back 100 years and start collecting direct instrumental data from every worthwhile location across the globe. Such is life.
What this means is that we have to live with a degree of uncertainty in data. Not anything new or limiting our ability to make conclusions with a degree of tentativeness.
Given we've moved from you relying on a 52 year old dataset from Central England to argue for a global MWP and even comparing it to a more reliable, modern spatially diverse proxy in an effort to shout 'fraud' at a scientist, while your point has some minor weight I'm not sure you really care that much apart from having another minor pebble to throw at the science. Very much like how creationists use the 'god of the gaps' argument - just picking at leaves while ignoring the forest around you
You were happy to rely on a dataset about which you didn't have any idea of its scientific provenance of just a page ago...
a reply to: melatonin
Mann etal 09
It is worth going back to assess Mann’s publications ‘showing’ that the MWP (Medieval Warm Period) was ‘cooler than the present’.
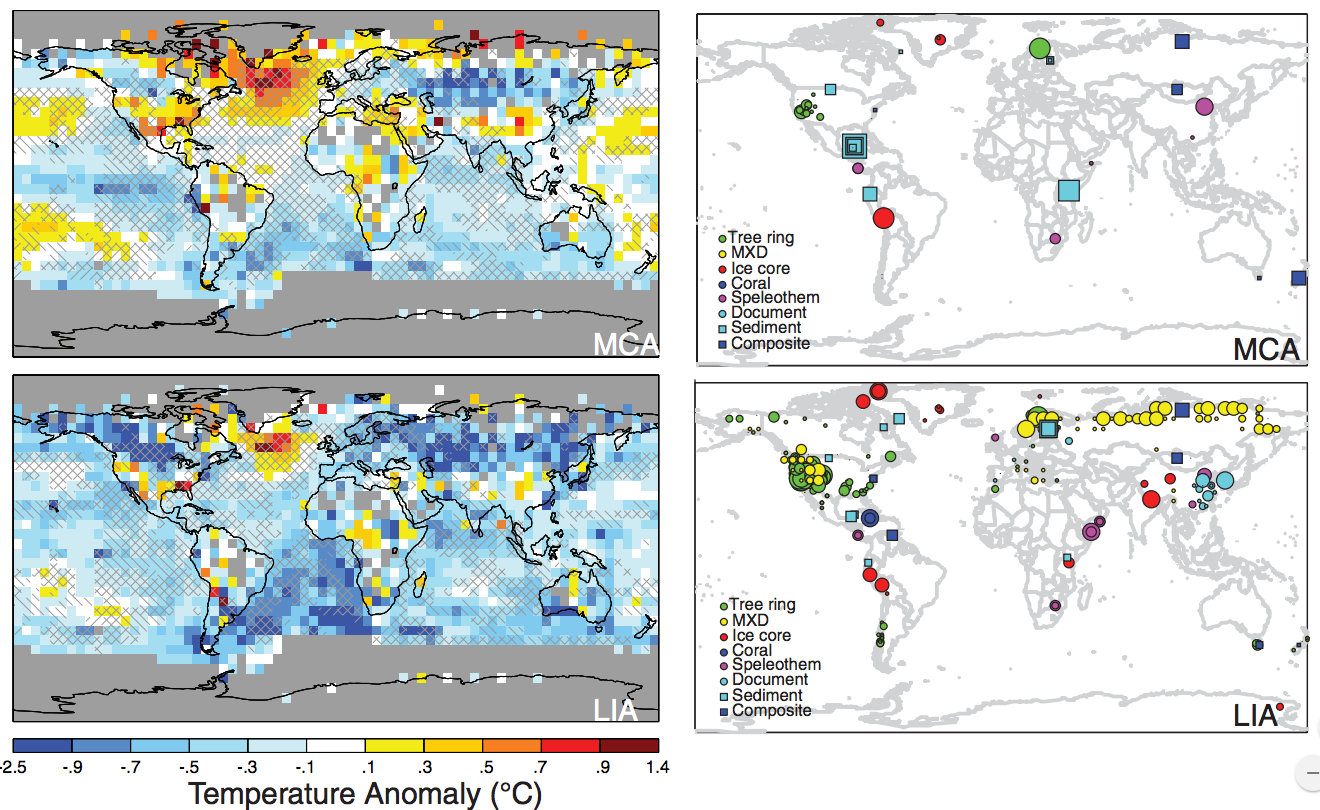
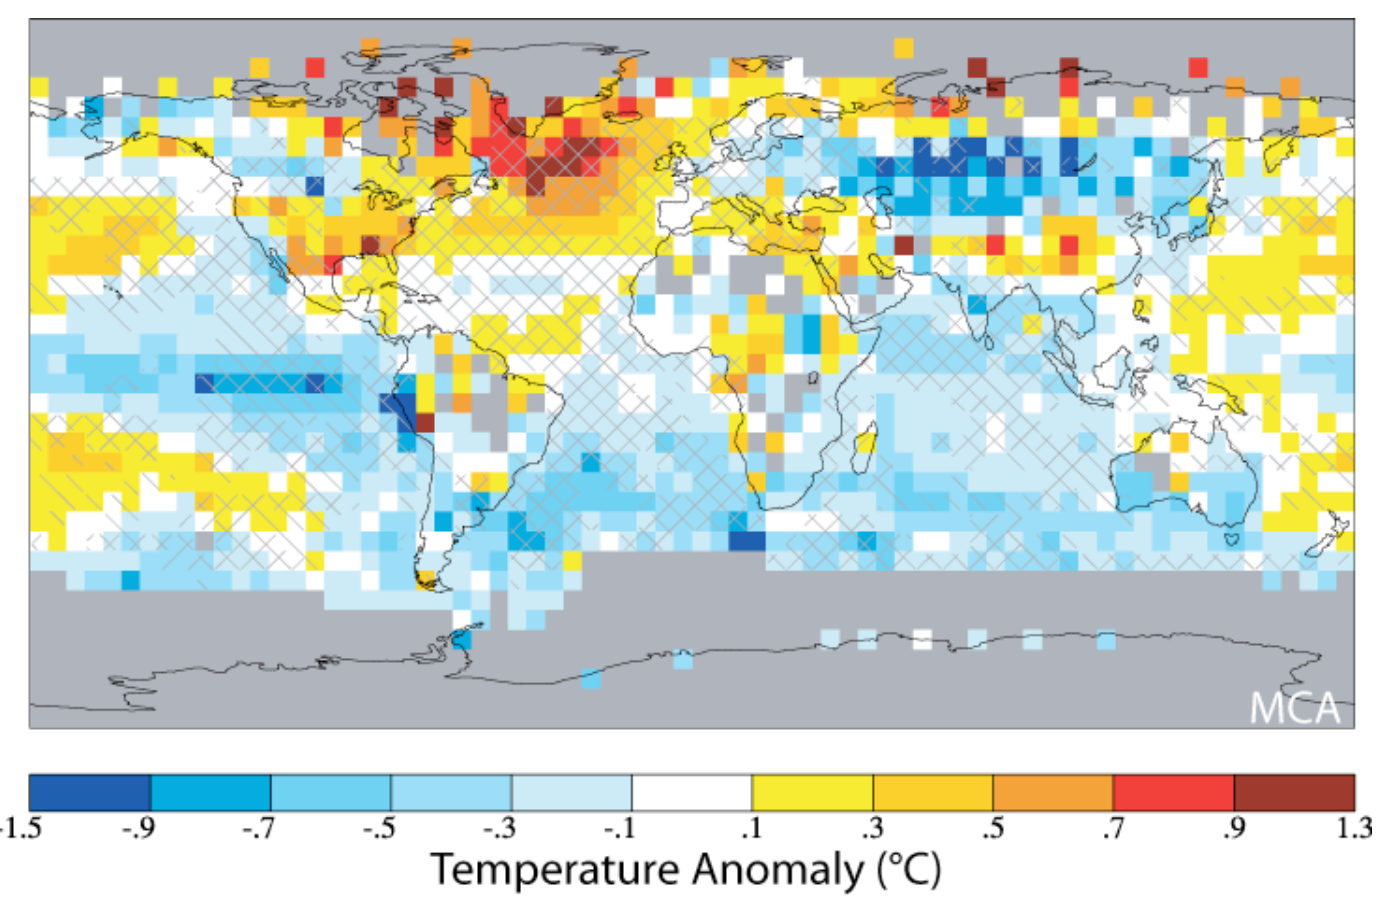
Note Figure 2 – the top figures showing the temperature anomaly map of the world for the MCA (compared to the 1961 to 1990 period)…..and the weighted proxies on the right……
Note all the blue (cooler than recent times) on that map. There is cooling shown across all of central Asia, the entire Indian ocean, the entire southern Atlantic, the area of the Eastern Pacific. Note these are all proxy-free areas. (Three proxies across central Asia, none in any of the remarkably cool oceans.
However, warming is indicated (yellow, orange or red) in the immediate area of the vast majority of the proxies locations which are shown.
The whole conclusion is (of course) a modeled output …. which I think should have prompted someone to go back and check the model.
Why has the Medieval Warm Period been renamed? Reminds me of when when went from Global Warming to Climate Change.
Mann etal 09
It is worth going back to assess Mann’s publications ‘showing’ that the MWP (Medieval Warm Period) was ‘cooler than the present’.
Note Figure 2 – the top figures showing the temperature anomaly map of the world for the MCA (compared to the 1961 to 1990 period)…..and the weighted proxies on the right……
Note all the blue (cooler than recent times) on that map. There is cooling shown across all of central Asia, the entire Indian ocean, the entire southern Atlantic, the area of the Eastern Pacific. Note these are all proxy-free areas. (Three proxies across central Asia, none in any of the remarkably cool oceans.
However, warming is indicated (yellow, orange or red) in the immediate area of the vast majority of the proxies locations which are shown.
The whole conclusion is (of course) a modeled output …. which I think should have prompted someone to go back and check the model.
Why has the Medieval Warm Period been renamed? Reminds me of when when went from Global Warming to Climate Change.
Our reconstructions span two climatologically interesting periods, the so-called Little Ice Age (LIA) and Medieval Climate Anomaly (MCA).
All data analysis can be seen as a model from a certain perspective! Some models are better than others.
Anyway, this study does use a simulation in an attempt to understand the spatial variations. Take it or leave it. It is what it is.
It's not fraud, though, haha. Just scientists trying to do their best to understand phenomena. I'm pretty sure that Mann's work has attracted more attention than the vast majority of scientists in the history of science. Wouldn't surprise me if his daily farts are captured by the illuminati for analysis.
a reply to: melatonin
Assasanation of Science
I have issues with a close knit group of scientists trying to manipulate the community and set an agenda.
I don't trust how they get published and I don't trust their peer review.
They stand alone, a virtual monopoly that can review and publish anything they want.
If you don't agree thats fine.
Around the 2003 time frame, Michael, Scott, Tom, Phil, Malcolm, Raymond, Keith, and another Tom, get together to redefine the WMP and LIA, and the dates these occurred.
1047485263.txt and 1062618881.txt
Phil says:
” I agree with all the points being made and the multi-authored article would be a good idea, but how do we go about not letting it get buried somewhere. Can we not address the misconceptions by finally coming up with definitive dates for the LIA and MWP and redefining what we think the terms really mean? With all of us and more on the paper, it should carry a lot of weight. In a way we will be setting the agenda for what should be being done over the next few years.”
What we want to write is NOT the scholarly review a la Jean Grove (bless her soul) that just reviews but doesn't come to anything firm. We want a critical review that enables agendas to be set. Ray's recent multi-authored piece goes a lot of the way so we need to build on this. cheers, Phil
Michael E. Mann wrote:
HI Malcolm,
Thanks for the feedback--I largely concur. I do, though, think there is a particular problem with "Climate Research". This is where my colleague Pat Michaels now publishes exclusively, and his two closest colleagues are on the editorial board and review editor board. So I promise you, we'll see more of this there.
I will be emailing the journal to tell them I'm having nothing more to do with it until they rid themselves of this troublesome editor. A CRU person is on the editorial board, but papers get dealt with by the editor assigned by Hans von Storch. Cheers Phil
Dear all,
Tim Osborn has just come across this. Best to ignore probably, so don't let it spoil your day. I've not looked at it yet. It results from this journal having a number of editors. The responsible one for this is a well-known skeptic in NZ. He has let a few papers through by Michaels and Gray in the past. I've had words with Hans von Storch about this, but got nowhere.
Cheers
Phil
Scientists unhappy with questionable journal practices shocker!
As Phil (Jones?) mentions best to accept and ignore. However, I guess you are a fan of the free market and therefore scientists can take their manuscripts to another journal if they are unhappy, no?
If a journal is likely to be publishing low quality articles, you can't really blame them. And journals allowing well-known industry funded 'contrarians' (like Pat Michaels) to publish are going to be viewed as borderline trashy. Are you surprised that scientists get a bit edgy when particular journals start publishing tripe?
Bit like deciding whether to publish an article in the Daily Mail vs The Times.
If you are really interested in Climate Science rather than merely trying to pick at minor issues, I always thought this talk by the beautifully whacky Richard Alley is worth the hour. Good to get out our bubbles now and again (:
edit on 4-4-2017 by melatonin because: extra added blah
a reply to: melatonin
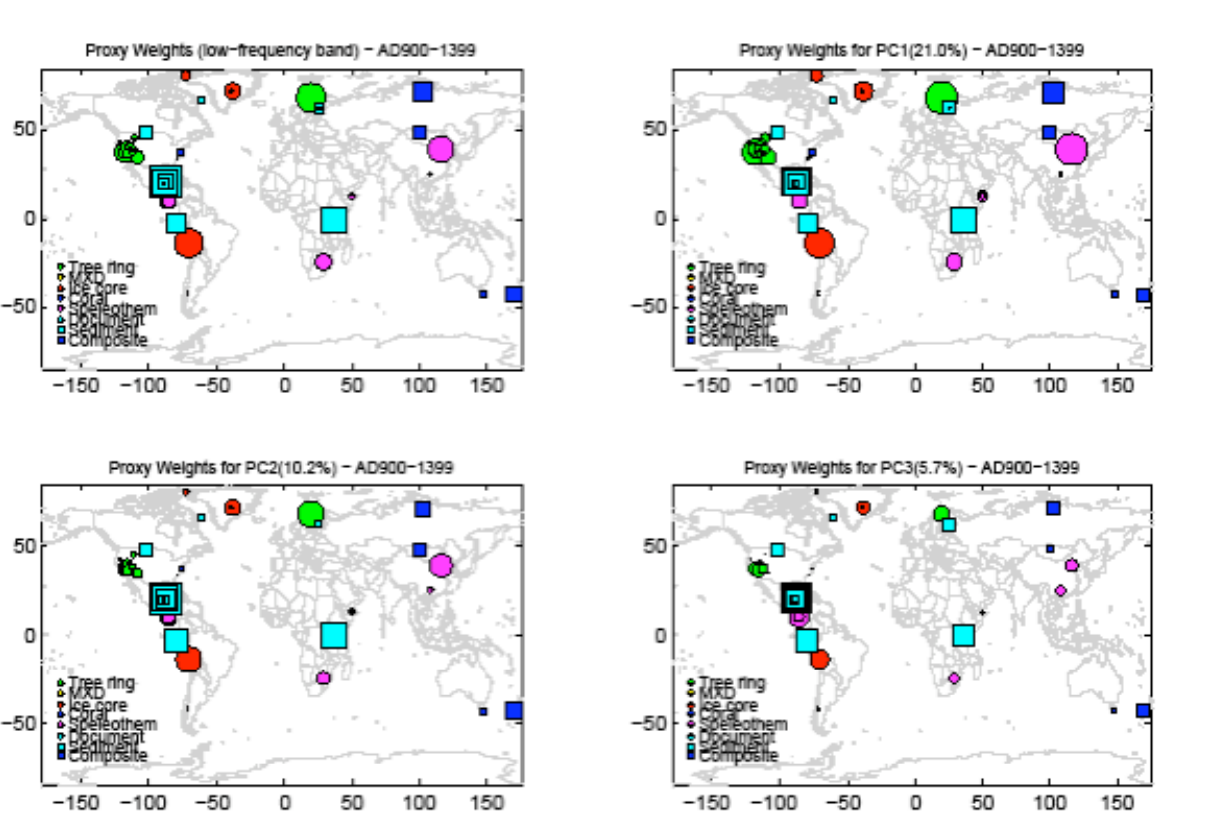
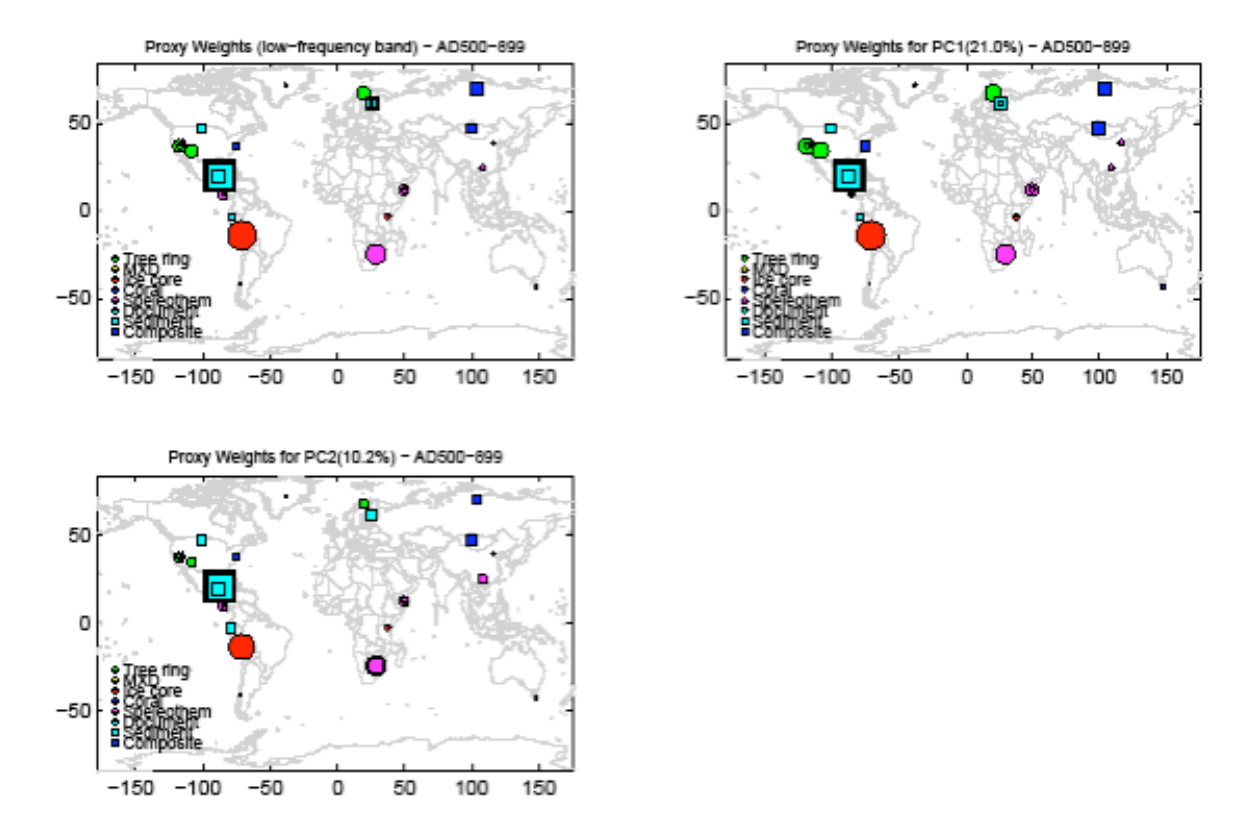
Looking at Mann etal supplemental data, it does seem fraudulent to model the global climate from so few data points.
These are supposedly experts in the field, anyone knows you can't model the earths climate from that puny set of proxy data.
And tell me again why Mann decided to change the name to the Medieval Climate Anomaly?

Becomes this??
Seems a stretch don't ya think?
 Note all the blue (cooler than recent times) on that map. There is cooling shown across all of central Asia, the entire
Indian ocean, the entire southern Atlantic, the area of the Eastern Pacific. Note these are all proxy-free areas. (Three proxies across central Asia,
none in any of the remarkably cool oceans.
Note all the blue (cooler than recent times) on that map. There is cooling shown across all of central Asia, the entire
Indian ocean, the entire southern Atlantic, the area of the Eastern Pacific. Note these are all proxy-free areas. (Three proxies across central Asia,
none in any of the remarkably cool oceans.
Looking at Mann etal supplemental data, it does seem fraudulent to model the global climate from so few data points.
These are supposedly experts in the field, anyone knows you can't model the earths climate from that puny set of proxy data.
And tell me again why Mann decided to change the name to the Medieval Climate Anomaly?
Becomes this??
Seems a stretch don't ya think?
edit on 4-4-2017 by D8Tee because: (no reason given)
As a simulation, they use the localised proxies as a basis for the model. The simulation fills in the gaps.
No other way to assess it at the moment. When Elon Musk turns his attention to time machines perhaps that will change.
You may not agree with the method, and that's fine. But you'll be surprised what simulations can do with modern computing.
As for the labelling of MWP - who cares? Call it either...
And as I mentioned in the last post, spend an hour out your bubble and watch Richard Alley's presentation. Think it's worth it if you really want to understand why the issue of CO2 is a cause for concern. At the moment, you're just picking at minor issues, most of which have little impact really. The real problem is pretty easy to understand if time and open mind is applied (:
edit on 4-4-2017 by melatonin because: (no reason
given)
nevermind, i will let the charts speak for themselves.
edit on 4-4-2017 by D8Tee because: (no reason given)
originally posted by: D8Tee
nevermind, i will let the charts speak for themselves.
As I said, the proxies are used in the model to constrain the simulation. The study is using a climate model simulation to model spatial variations during the periods deemed the MWP and LIA.
It's explained in the paper. You may question the ability of the simulation to effectively model such phenomena, and that's fine. Really it is.
Would it be better if we had proxies from a wider network of regions during that period - of course! But we don't at this point.
If wishes and buts were candy and nuts...
originally posted by: D8Tee
a reply to: melatonin
Looking at Mann etal supplemental data, it does seem fraudulent to model the global climate from so few data points.
These are supposedly experts in the field, anyone knows you can't model the earths climate from that puny set of proxy data.
I have more time and attention, so lets dig deeper...
Yet you were happy not so long back to rely on a study using data from Central England to make conclusions about global climate? What is more puny - using data from numerous global regions or using data from a single global region?
You are also conflating the aim of the 2009 Mann study and the general use of proxy data to understand paleoclimate. The 2009 study is assessing the spatial variations across the globe using a climate model simulation. The other proxy studies merely use the proxy data points without the simulation aspects.
There's an important distinction there. But one you fail to grasp in an effort to throw more smoke bombs.
And tell me again why Mann decided to change the name to the Medieval Climate Anomaly?
Perhaps just to irritate climate change deniers.
Or it may be a better description gives anomaly means change without the warming label. And given not everywhere warmed at the same time, with some places cooling, as your own information stated, it is a better description, no?
Note all the blue (cooler than recent times) on that map. There is cooling shown across all of central Asia, the entire Indian ocean, the entire southern Atlantic, the area of the Eastern Pacific. Note these are all proxy-free areas. (Three proxies across central Asia, none in any of the remarkably cool oceans.
And? The 2009 study is as I described. A simulation in an effort to grasp in more detail changes across the globe during these particular times that seem of neverending interest to some people. Better than taking a 52 year old study based on one minor region of the globe as indicative of a worldwide change.
However, warming is indicated (yellow, orange or red) in the immediate area of the vast majority of the proxies locations which are shown.
However, the studies which underpin paleoclimate data (Mann et al., 1998 etc, and those in the subsequent IPCC reports, e.g.) do not use the method in the 2009 study you are now focusing on. They actually just use the proxy data with no simulation. This is what you seem to be suggesting makes a difference in the above quote - it makes no difference. There is still no notable global MWP, heh.
Neither method shows a notable MWP/MCA. That only really appears if you fail to use spatially and temporally coherent proxy data. For instance, taking data from one minor region of the globe and leaping from Central England to global interpretations.
Which is more puny?
You can keep picking at uncertainties. Interestingly, climate scientists accept that there are uncertainties. They do understand the data and its limitations. They also understand the big obvious picture which you readily fail to grasp.
If we decided to remove all of Michael Mann's work just to humour your personal grievances - it makes no difference (:
edit on 5-4-2017 by
melatonin because: extra added blah
a reply to: melatonin
I would like to go back to the MWP, if you don't mind.
We all read in the IPCC report that CO2 levels were high in the MWP (higher than they are now at 500 ppm). Further, we know that CO2 is mixable and that the concentration around the globe really doesn't change from location to location.
Why weren't the temperatures of the MWP not higher than today and why were some locations cooler.
Mann theorized (in an unproven theory) that CO2 started messing with the tree rings in the 1960s but seems to have forgotten the CO2 levels during the MWP and how it could have messed with the tree ring growth then. Or does his theory not hold for different times.
The following is an edit: Sorry it was the mid-Holocene period about 6,000 BP that had high CO2.
I am referring to the 1990 IPPC report, page 202
What has changed about the MWP which showed warming with increased CO2?
I would like to go back to the MWP, if you don't mind.
We all read in the IPCC report that CO2 levels were high in the MWP (higher than they are now at 500 ppm). Further, we know that CO2 is mixable and that the concentration around the globe really doesn't change from location to location.
Why weren't the temperatures of the MWP not higher than today and why were some locations cooler.
Mann theorized (in an unproven theory) that CO2 started messing with the tree rings in the 1960s but seems to have forgotten the CO2 levels during the MWP and how it could have messed with the tree ring growth then. Or does his theory not hold for different times.
The following is an edit: Sorry it was the mid-Holocene period about 6,000 BP that had high CO2.
I am referring to the 1990 IPPC report, page 202
We conclude that despite great limitations in the quantity and quality of the available historical temperature data, the evidence points consistently to a real but irregular warming over the last century. A global warming of larger size has almost certainly occurred at least once since the end of the last glaciation without any appieciable increase in greenhouse gases. Because we do not understand the reasons for these past warming events it is not yet possible to attribute a specific proportion ol the recent, smaller, warming to an increase of greenhouse gases.
What has changed about the MWP which showed warming with increased CO2?
edit on 6-4-2017 by TiredofControlFreaks because: I misinterpreted the
information about MWP for mid-Halocene references
a reply to: melatonin
I don't accept that so few proxy data sites can provide in any way an accurate model of the global climate at the time and I am far from the only one that feels this way.
There is evidence the MWP was global.
Again, if you wish to believe a dozen proxy data sites can provide enough data to model the earths climate, thats up to you.
There are many people with more credentials than either of us that disagree.
www.co2science.org...
The IPCC report label indicated it was a global temperature graph, not local to Central England. I guess they are allowed to make mistakes.
Yet you were happy not so long back to rely on a study using data from Central England to make conclusions about global climate?
I don't accept that so few proxy data sites can provide in any way an accurate model of the global climate at the time and I am far from the only one that feels this way.
There is evidence the MWP was global.
Again, if you wish to believe a dozen proxy data sites can provide enough data to model the earths climate, thats up to you.
There are many people with more credentials than either of us that disagree.
www.co2science.org...
edit on 6-4-2017 by D8Tee because: (no reason given)
edit on
6-4-2017 by D8Tee because: (no reason given)
originally posted by: TiredofControlFreaks
a reply to: melatonin
I would like to go back to the MWP, if you don't mind.
Cool.
What has changed about the MWP which showed warming with increased CO2?
Not sure it was associated with CO2. Again, it also doesn't seem to be global. Given, there was some changes across the globe - just not notable on the global scale from what the data says.
But once you accept that CO2 is a driver of climate change and global warming, just take that one step further...
What happens when we burn a #-ton of fossil fuels?
edit on 6-4-2017 by melatonin because: (no reason given)
originally posted by: D8Tee
a reply to: melatonin
The IPCC report label indicated it was a global temperature graph, not local to Central England. I guess they are allowed to make mistakes.
We all are, really. Given that particularly poor set of data was all we had to rely on to understand paleoclimate, lucky that Michael Mann put in some effort to improve our understanding, no?
I don't accept that so few proxy data sites can provide in any way an accurate model of the global climate at the time and I am far from the only one that feels this way.
There is evidence the MWP was global.
Again, if you wish to believe a dozen proxy data sites can provide enough data to model the earths climate, thats up to you.
There are many people with more credentials than either of us that disagree.
www.co2science.org...
To be fair, more data is always better. But we have a fairly decent global understanding of paleoclimate. Did you watch the Alley presentation? Check out the big picture perspective. Pretty clear and somewhat troubling.
edit on 6-4-2017 by melatonin because: removed funny
a reply to: melatonin
"the records aren't as good as we like and there's work to be done here".
"the sun doesn't change much but the sun modulates the cosmic rays, the cosmic rays modulate the clouds, the clouds modulate the temperature, so the sun is amplified hugely. It's a really interesting hypothesis and there's really good science to be done on this, but we have reason to think it's a fine tuning knob."
"I don't believe that this story is done yet, many people have been developing these arguments and strengthening them"
"We must seriously improve our records of climate and C02 on common time scales and our model tests"
"the Greenland ice core records need work, as they show blips of C02, for now the ice core record is from antartica and we will stay with that"
This presentation just says more of the same, the science is far from settled.
I do know one thing, 97 out of 100 C02 molecules will agree, they are not man made.
We get a huge increase in plant growth.
What happens when we burn a #-ton of fossil fuels?
Yes I did.
Did you watch the Alley presentation?
"the records aren't as good as we like and there's work to be done here".
"the sun doesn't change much but the sun modulates the cosmic rays, the cosmic rays modulate the clouds, the clouds modulate the temperature, so the sun is amplified hugely. It's a really interesting hypothesis and there's really good science to be done on this, but we have reason to think it's a fine tuning knob."
"I don't believe that this story is done yet, many people have been developing these arguments and strengthening them"
"We must seriously improve our records of climate and C02 on common time scales and our model tests"
"the Greenland ice core records need work, as they show blips of C02, for now the ice core record is from antartica and we will stay with that"
This presentation just says more of the same, the science is far from settled.
I do know one thing, 97 out of 100 C02 molecules will agree, they are not man made.
edit on 6-4-2017 by D8Tee because: (no reason given)

new topics
-
Slow moving ufo over Mexico volcano Popocatepetl 8 May 2024
Aliens and UFOs: 6 hours ago -
A new Why Files How CRISPR and AI Destroy the World
Science & Technology: 7 hours ago -
Ask AI Is A Hot Mess
Links & Other Resources: 7 hours ago
top topics
-
Christianity superior to other faiths for very specific reasons. Awaken to true FREEDOM..!!
Conspiracies in Religions: 14 hours ago, 7 flags -
A new Why Files How CRISPR and AI Destroy the World
Science & Technology: 7 hours ago, 6 flags -
Ask AI Is A Hot Mess
Links & Other Resources: 7 hours ago, 5 flags -
Battle of the Bay 2024 ; Tampa, Florida Special Forces Demonstration
Military Projects: 12 hours ago, 4 flags -
Tschugger
Movies: 13 hours ago, 3 flags -
Slow moving ufo over Mexico volcano Popocatepetl 8 May 2024
Aliens and UFOs: 6 hours ago, 3 flags
active topics
-
Social Security projected to cut benefits in 2035 barring a fix
Global Meltdown • 50 • : annonentity -
It's all Kicking off at Eurovision 2024
Music • 11 • : angelchemuel -
Russia Ukraine Update Thread - part 3
World War Three • 5781 • : gortex -
"The Fool" - A short video featuring a harmonica-playing guy blasted by a UFO
Aliens and UFOs • 18 • : Arbitrageur -
A new Why Files How CRISPR and AI Destroy the World
Science & Technology • 7 • : andy06shake -
Bibi’s Dilemma
Middle East Issues • 212 • : KrustyKrab -
Christianity superior to other faiths for very specific reasons. Awaken to true FREEDOM..!!
Conspiracies in Religions • 24 • : andy06shake -
Scientists Find 7 potential Dyson spheres after Scanning 5 million Objects
Space Exploration • 40 • : gortex -
StormyD Accused of Falsification of Business Records to Hide Money From Trump
US Political Madness • 47 • : F2d5thCavv2 -
The Acronym Game .. Pt.3
General Chit Chat • 7827 • : F2d5thCavv2