It looks like you're using an Ad Blocker.
Please white-list or disable AboveTopSecret.com in your ad-blocking tool.
Thank you.
Some features of ATS will be disabled while you continue to use an ad-blocker.

Hotter, weirder: How climate has changed Earth
page: 1share:
How have things changed? Well, for one, we seem to keep breaking the World's heat record every other year if not every year. According to the
article:
"It's almost a sure thing that 2014 will go down as the hottest year in 135 years of record keeping, meteorologists at NOAA's National Climatic Data Center say. If so, this will be the sixth time since 1992 that the world set or tied a new annual record for the warmest year.
The globe has broken six monthly heat records in 2014 and 47 since 1992. The last monthly cold record set was in 1916.
"From 1983 to 1992 the world averaged 147 climate, water and weather disasters each year. Over the past 10 years, that number has jumped to an average 306 a year."
There isn't a great description of what's happening, the article does put the reality in perspective. Oceans rising, acidic oceans, and an increase in wild weather.
Wow, we are in bad shape, environmentally, and it's going to get worse Researchers measure the climate in ten year intervals because changes in climate are hard to discern on a yearly scale, I wonder what this latest 10 year cycle will tell us......What says ATS?
www.businessweek.com...
"It's almost a sure thing that 2014 will go down as the hottest year in 135 years of record keeping, meteorologists at NOAA's National Climatic Data Center say. If so, this will be the sixth time since 1992 that the world set or tied a new annual record for the warmest year.
The globe has broken six monthly heat records in 2014 and 47 since 1992. The last monthly cold record set was in 1916.
"From 1983 to 1992 the world averaged 147 climate, water and weather disasters each year. Over the past 10 years, that number has jumped to an average 306 a year."
There isn't a great description of what's happening, the article does put the reality in perspective. Oceans rising, acidic oceans, and an increase in wild weather.
The numbers are stark. Carbon dioxide emissions: up 60 percent. Global temperature: up six-tenths of a degree. Population: up 1.7 billion people. Sea level: up 3 inches. U.S. extreme weather: up 30 percent. Ice sheets in Greenland and Antarctica: down 4.9 trillion tons of ice.
"Simply put, we are rapidly remaking the planet and beginning to suffer the consequences," says Michael Oppenheimer, professor of geosciences and international affairs at Princeton University.
Wow, we are in bad shape, environmentally, and it's going to get worse Researchers measure the climate in ten year intervals because changes in climate are hard to discern on a yearly scale, I wonder what this latest 10 year cycle will tell us......What says ATS?
www.businessweek.com...
some different numbers
www.crh.noaa.gov...
Although seems to be more hotter than colder records being set.
www.crh.noaa.gov...
ERE IS A LIST OF THIS YEARS DECEMBER THROUGH MARCH AVERAGE
TEMPERATURE RELATED TO THE OTHER COLDEST SUCH PERIODS ON RECORD
IN CHICAGO:
RANK AVERAGE YEAR
DEC-MAR TEMP
--------------------------------------------------
1. 22.0 2013-14
2. 22.3 1903-04
3. 22.5 1977-78
22.5 1892-93
5. 22.7 1978-79
Although seems to be more hotter than colder records being set.
edit on 3-12-2014 by johnb because: (no reason given)
Yes it's getting bad out there!
I'm thinking of getting a h1 hummer for myself and an h3 for the wife to combat climate change. With all the snow and floods were going to need some really big SUVs to get around.
I'm thinking of getting a h1 hummer for myself and an h3 for the wife to combat climate change. With all the snow and floods were going to need some really big SUVs to get around.
I will start to believe in AGW when Canadians stop heading south for the heat .Until then I will keep throwing logs on the fire and keep denying . :>)
originally posted by: lostbook
How have things changed? Well, for one, we seem to keep breaking the World's heat record every other year if not every year. According to the article:
"It's almost a sure thing that 2014 will go down as the hottest year in 135 years of record keeping, meteorologists at NOAA's National Climatic Data Center say. If so, this will be the sixth time since 1992 that the world set or tied a new annual record for the warmest year.
The globe has broken six monthly heat records in 2014 and 47 since 1992. The last monthly cold record set was in 1916.
"From 1983 to 1992 the world averaged 147 climate, water and weather disasters each year. Over the past 10 years, that number has jumped to an average 306 a year."
There isn't a great description of what's happening, the article does put the reality in perspective. Oceans rising, acidic oceans, and an increase in wild weather.
The numbers are stark. Carbon dioxide emissions: up 60 percent. Global temperature: up six-tenths of a degree. Population: up 1.7 billion people. Sea level: up 3 inches. U.S. extreme weather: up 30 percent. Ice sheets in Greenland and Antarctica: down 4.9 trillion tons of ice.
"Simply put, we are rapidly remaking the planet and beginning to suffer the consequences," says Michael Oppenheimer, professor of geosciences and international affairs at Princeton University.
Wow, we are in bad shape, environmentally, and it's going to get worse Researchers measure the climate in ten year intervals because changes in climate are hard to discern on a yearly scale, I wonder what this latest 10 year cycle will tell us......What says ATS?
www.businessweek.com...
I disagree that we are in bad shape, i am still unconvinced we are the major contributor.
Actually, they didn't. While the Met Office seems keen on saying "since records began in 1914" to describe any kind of record-busting weather (such as 2007's "wettest summer"), it has records that go back much further.
The England and Wales Precipitation series, which measures rainfall and snow, goes back to 1766, and the Central England Temperature series, which covers the temperature from the south Midlands to Lancashire, is the longest-running record in the world, dating from 1659.
lets go on the best case that records of some sort began in 1659, we have only 355 years worth of weather data for earth and only 100 yrs of modern data recording methods.
the Earth is 4.5bn years old so out of a total of Earths weather we know a fraction of a percentage and that's being generous, how can we possibly link these things with such limited information, it could just be a natural cycle
its just my opinion of course
Q
Via my email account, I get daily updates from climate depot I don't know if the guy who runs it is selective, but most of the second party reports
posted are usually of lower temperatures, like great lakes ice a month earlier than normal, sea ice more than normal, Antarctic sea ice more and
thicker than normal, Americas east coast below average hurricanes, 4 years of crap summers in Europe, two in a row of north America's polar
vortices, global temperature the same for 16 years, on and on and on...
a reply to: lostbook I do not denie the weather has some changes. But I do have a disagreement with scientist saying it is
caused by man. We are such a puny speck on the surface of this huge planet. What we cause can be measured but it is insignificant in the total about
of weather and atmosphere world wide. I have seen extremely hot and extremely cold weather in my 64 years. I just chalk it all up to the fact it
cycles, and what mother earth wants to do. We can not influence her decisions. IMO
I'd go with this guy in what he says about Climate Change / Global Warming:
Now that's a good excuse to make up the Global Warming Scam! Wouldn't you say?
It's funny how many actual Scientists and Researchers have been shut down, lost grants, lost jobs and basically silenced. Especially the ones that have said with documented evidence that it was hotter in the medieval times than it is now. This is a Solar Cycle and not a man made climate change!
Global Warming Is A $22 Billion Scam
Scientist Confesses: Global Warming is a $22 Billion Scam
‘You’re about to take a bite of your New York strip when one of the men, a top U.S. intelligence agent, slams a 164-page document in the middle of the table.
This document, you soon find out, contains damning evidence that a network of politicians, corporations, and scientists have conspired together to promote the fear of “global warming” . . . despite evidence clearly stating no such “global warming” exists.
The motive: $22 billion per year.’
Now that's a good excuse to make up the Global Warming Scam! Wouldn't you say?
It's funny how many actual Scientists and Researchers have been shut down, lost grants, lost jobs and basically silenced. Especially the ones that have said with documented evidence that it was hotter in the medieval times than it is now. This is a Solar Cycle and not a man made climate change!
Global Warming Is A $22 Billion Scam
I wish someone could post a timeline of temps from all the planets in out solar system...and quit yelling that the sky is falling..
I heard an interview recently with a U2 pilot who flew them in the late sixties into the seventies. He flew a lot of low altitude passes over the
North Pole to collect air samples for radiation.
He mentioned how the ice levels back then look much the same as the pics they present us today. He doesn't have a website and isn't selling a book, just a guy who had a cool job and some first hand knowledge offering evidence to a possible misinformation campaign by establishment oriented people.
Take it or leave it
While most of the world has seen higher temperatures, large parts of the U.S. have seen cooler temperatures this year.
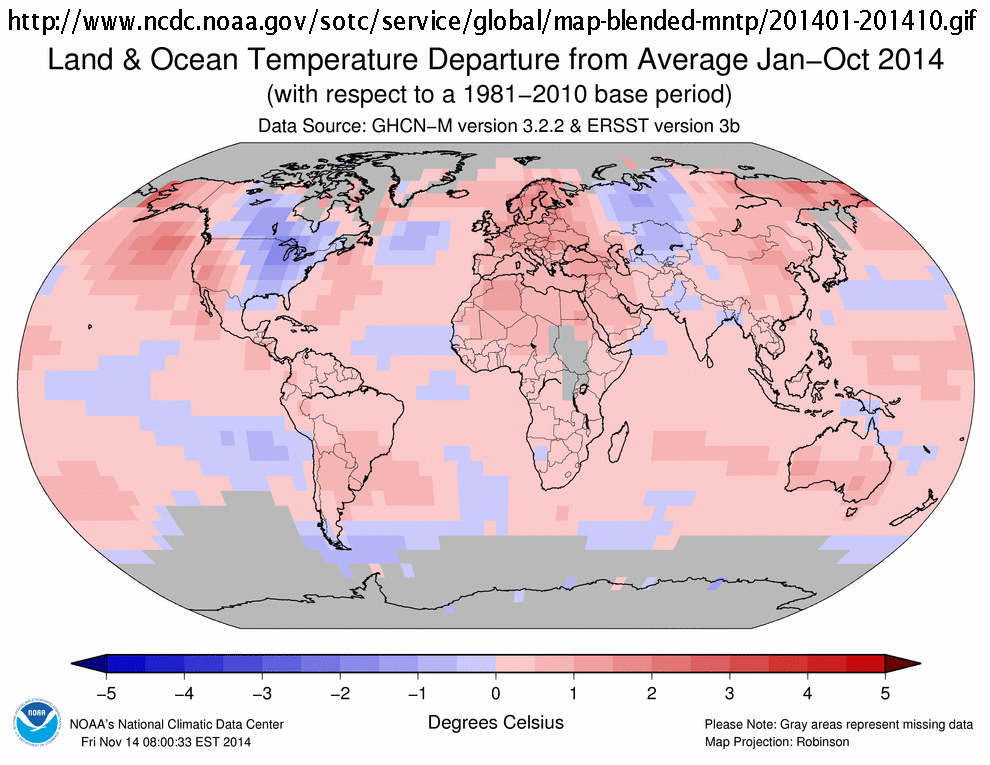
With all of the record heat, 2014 is shaping up to be the hottest recorded year.
NOAA - Global Analysis - October 2014
We won't know for sure for a few months, but it's pretty likely.
With all of the record heat, 2014 is shaping up to be the hottest recorded year.
NOAA - Global Analysis - October 2014
The first ten months of 2014 (January–October) were the warmest such period since record keeping began in 1880, with a combined global land and ocean average surface temperature 0.68°C (1.22°F) above the 20th century average of 14.1°C (57.4°F), surpassing the previous record set in 1998 and tied in 2010 by 0.02°C (0.04°F). 2014 is currently on track to be the warmest year on record.
The most recent 12-month period, November 2013–October 2014, broke the record (set just last month) for the all-time warmest 12-month period in the 135-year period of record, at 0.68°C (1.22°F) above average, with November 2013 and May, June, August, September, and October 2014 all record warm for their respective months. (originally published as 0.69°C, corrected 20 Nov 2014)
We won't know for sure for a few months, but it's pretty likely.
a reply to: pikestaff
Yes, they are being very selective.
For several years now I have been running a weather news blog (see my sig) listing stories from around the world - hot, cold, wet, windy and everything in between. It gives a far more balanced view of what is happening. Though I couldnt comment on whether extreme weather events are becoming more common or just being reported more widely, as I dont think my records go back nearly far enough.
When looking at all the data, it really does appear that the earth is getting hotter.
Our Military is noticing that too and wanted to take some steps to mitigate the effect on bases and operations and also to mitigate any fossil fuel issues in the future, but congress told them there was nothing to see and not to worry about it. LOL
Our Military is noticing that too and wanted to take some steps to mitigate the effect on bases and operations and also to mitigate any fossil fuel issues in the future, but congress told them there was nothing to see and not to worry about it. LOL
Yaaaaay! Another AWG is true thread. Keep posting them and eventually you'll start to believe it yourself. Until then I'm hunkering down in my
igloo during one of the coldest years on record for my state.
originally posted by: Deveron
It's funny how many actual Scientists and Researchers have been shut down, lost grants, lost jobs and basically silenced. Especially the ones that have said with documented evidence that it was hotter in the medieval times than it is now.
Globally, this is false. Medieval warm period was not a global warm period. And even in Europe it was not substantially warmer than today, though it was warmer than intermediate periods between then and now.
This is a Solar Cycle and not a man made climate change!
This hypothesis has been studied extensively for decades. It is not justified by the data.
originally posted by: caterpillage
I heard an interview recently with a U2 pilot who flew them in the late sixties into the seventies. He flew a lot of low altitude passes over the North Pole to collect air samples for radiation.
He mentioned how the ice levels back then look much the same as the pics they present us today. He doesn't have a website and isn't selling a book, just a guy who had a cool job and some first hand knowledge offering evidence to a possible misinformation campaign by establishment oriented people.
Take it or leave it
There have been satellites and aircraft taking more precise measurements than the mark 1 eyeball.
What really matters is ice thickness, and that can't be estimated from the air by just looking, especially in glaciated Greenland.
neven1.typepad.com...
Research confirms how global warming links to carbon emissions
A trillion tonnes seems like a lot until you realize that the atmospheric concentration of CO2 has risen by the equivalent of 1/10th of that in just the last 6 years.
Summary: Research has identified, for the first time, how global warming is related to the amount of carbon emitted. A team of researchers has derived the first theoretical equation to demonstrate that global warming is a direct result of the build-up of carbon emissions since the late 1800s when human-made carbon emissions began. The results are in accord with previous data from climate models.
(further down)
The results show every million-million tonnes of carbon emitted will generate one degree Celsius of global warming. They also show that the build-up of carbon emitted over the last 200 years will then last for many centuries to millennia, even if carbon emissions are subsequently phased out.
A trillion tonnes seems like a lot until you realize that the atmospheric concentration of CO2 has risen by the equivalent of 1/10th of that in just the last 6 years.
new topics
-
President BIDEN's FBI Raided Donald Trump's Florida Home for OBAMA-NORTH KOREA Documents.
Political Conspiracies: 4 hours ago -
Maestro Benedetto
Literature: 6 hours ago -
Is AI Better Than the Hollywood Elite?
Movies: 6 hours ago -
Las Vegas UFO Spotting Teen Traumatized by Demon Creature in Backyard
Aliens and UFOs: 10 hours ago -
2024 Pigeon Forge Rod Run - On the Strip (Video made for you)
Automotive Discussion: 10 hours ago -
Gaza Terrorists Attack US Humanitarian Pier During Construction
Middle East Issues: 11 hours ago
top topics
-
President BIDEN's FBI Raided Donald Trump's Florida Home for OBAMA-NORTH KOREA Documents.
Political Conspiracies: 4 hours ago, 26 flags -
Krystalnacht on today's most elite Universities?
Social Issues and Civil Unrest: 16 hours ago, 9 flags -
Supreme Court Oral Arguments 4.25.2024 - Are PRESIDENTS IMMUNE From Later Being Prosecuted.
Above Politics: 16 hours ago, 8 flags -
Weinstein's conviction overturned
Mainstream News: 14 hours ago, 8 flags -
Gaza Terrorists Attack US Humanitarian Pier During Construction
Middle East Issues: 11 hours ago, 8 flags -
Massachusetts Drag Queen Leads Young Kids in Free Palestine Chant
Social Issues and Civil Unrest: 13 hours ago, 7 flags -
Las Vegas UFO Spotting Teen Traumatized by Demon Creature in Backyard
Aliens and UFOs: 10 hours ago, 6 flags -
Meadows, Giuliani Among 11 Indicted in Arizona in Latest 2020 Election Subversion Case
Mainstream News: 13 hours ago, 5 flags -
2024 Pigeon Forge Rod Run - On the Strip (Video made for you)
Automotive Discussion: 10 hours ago, 4 flags -
Is AI Better Than the Hollywood Elite?
Movies: 6 hours ago, 3 flags
active topics
-
Is AI Better Than the Hollywood Elite?
Movies • 14 • : 5thHead -
President BIDEN's FBI Raided Donald Trump's Florida Home for OBAMA-NORTH KOREA Documents.
Political Conspiracies • 17 • : BingoMcGoof -
Gaza Terrorists Attack US Humanitarian Pier During Construction
Middle East Issues • 29 • : 19Bones79 -
Supreme Court Oral Arguments 4.25.2024 - Are PRESIDENTS IMMUNE From Later Being Prosecuted.
Above Politics • 90 • : Lumenari -
Las Vegas UFO Spotting Teen Traumatized by Demon Creature in Backyard
Aliens and UFOs • 12 • : KrustyKrab -
SHORT STORY WRITERS CONTEST -- April 2024 -- TIME -- TIME2024
Short Stories • 23 • : DontTreadOnMe -
Truth Social goes public, be careful not to lose your money
Mainstream News • 130 • : Astyanax -
Hate makes for strange bedfellows
US Political Madness • 47 • : 19Bones79 -
-@TH3WH17ERABB17- -Q- ---TIME TO SHOW THE WORLD--- -Part- --44--
Dissecting Disinformation • 689 • : daskakik -
University of Texas Instantly Shuts Down Anti Israel Protests
Education and Media • 265 • : Astrocometus