It looks like you're using an Ad Blocker.
Please white-list or disable AboveTopSecret.com in your ad-blocking tool.
Thank you.
Some features of ATS will be disabled while you continue to use an ad-blocker.
share:
It's kind of weird, but lately i have been using the EMSC website (from Europe) which tracks earthquakes around the world, and it is tracking
earthquakes that the USGS website is not tracking at all even though they are magnitude 4.0+.
For example. There was a magnitude 4.1 earthquake in Sonara, Mexico.
www.emsc-csem.org...
Or what about the one in Oaxaca, Mexico?
www.emsc-csem.org...
Even when setting the USGS website to track earthquakes for the last 7 days of at least magnitude 2.5+ it is not showing earthquakes like these.
Latest Earthquakes
www.usgs.gov...
For example. There was a magnitude 4.1 earthquake in Sonara, Mexico.
Magnitude M 4.1
Region SONORA, MEXICO
Date time 2016-12-01 02:26:22.0 UTC
Location 30.86 N ; 109.32 W
Depth 5 km
Distances 287 km W of Ciudad Juárez, Mexico / pop: 1,513,000 / local time: 19:26:22.0 2016-11-30
255 km NE of Hermosillo, Mexico / pop: 596,000 / local time: 19:26:22.0 2016-11-30
87 km SE of Bisbee, United States / pop: 5,600 / local time: 19:26:22.0 2016-11-30
30 km NE of Esqueda, Mexico / pop: 6,200 / local time: 19:26:22.0 2016-11-30
www.emsc-csem.org...
Or what about the one in Oaxaca, Mexico?
Magnitude M 4.2
Region OAXACA, MEXICO
Date time 2016-11-30 08:18:18.0 UTC
Location 17.05 N ; 95.47 W
Depth 94 km
Distances 364 km SE of Puebla de Zaragoza, Mexico / pop: 1,591,000 / local time: 02:18:18.0 2016-11-30
133 km E of Oaxaca de Juárez, Mexico / pop: 263,000 / local time: 02:18:18.0 2016-11-30
38 km E of San Miguel Quetzaltepec, Mexico / pop: 3,700 / local time: 02:18:18.0 2016-11-30
www.emsc-csem.org...
Even when setting the USGS website to track earthquakes for the last 7 days of at least magnitude 2.5+ it is not showing earthquakes like these.
Latest Earthquakes
www.usgs.gov...
edit on 1-12-2016 by ElectricUniverse because: add link and correct comment.
a reply to: ElectricUniverse
Could that be to do with differences in measuring techniques, or significance parameters are ascribed to the task?
Just a thought.
Could that be to do with differences in measuring techniques, or significance parameters are ascribed to the task?
Just a thought.
You know...there were some pretty significant discrepancies among the various reporting agencies when that whopper hit NZ, too. Some event activity
was absent from one source, yet posted on the others or vice versa, the magnitude of the big one completely inconsistent, etc. That caught my
attention right away, and I thought it seemed very strange, but I am not familiar with this in any technical sense so it might be perfectly normal to
see such disparities.
There are expert opinions on another thread regarding unusual readings across North America that they were consistent with telemetry error, which makes sense. However, I wonder if they are also consistent with anything else. I've got a healthy level of trepidation about all of this, but I cannot say exactly why. Something just doesn't feel right.
Three nights in a row, a deep rumbling vibration has occurred that is heard and felt in every area of the city. It's happened between 2 and 4am and lasted for nearly an hour each time. It is not an earthquake, although someone who has never experienced one could easily believe it was. And although a significant number of people heard and felt it, there was no reported seismic activity. So then I read this thread and the topic is eerily synchronous with that weirdness...and I don't know what to think. The only thing I know is that bad feeling isn't going away.
a reply to: tigertatzen
Hour long rumbles and no reported activity on any seismograph?
That sounds fishy as hell to me. Any action significant enough to replicate a quake like feeling ought to register SOMETHING on such a device!
Hour long rumbles and no reported activity on any seismograph?
That sounds fishy as hell to me. Any action significant enough to replicate a quake like feeling ought to register SOMETHING on such a device!
Always possible someone aint replaced the batteries on the detectors or something like that, could of been major earth works going on nearby to the
sensor so they turned them off to save false readings?
a reply to: TrueBrit
I know!! It gets even weirder than that, but I would derail the thread if I expounded further...but I will say this: it's getting damned creepy the way almost everyone is able to just shrug that kind of thing off and not question it even one bit. And in an area where seismic activity is not common, to boot. I just don't get it.
I know!! It gets even weirder than that, but I would derail the thread if I expounded further...but I will say this: it's getting damned creepy the way almost everyone is able to just shrug that kind of thing off and not question it even one bit. And in an area where seismic activity is not common, to boot. I just don't get it.
Why are there “missing” earthquakes?
There is an earthquake on another website; why is it not here?
We may not rapidly locate earthquakes smaller than 5.0 outside the US unless they have caused significant damage or are widely felt. Earthquakes this small rarely cause significant damage. At times, some other agency may report an earthquake with a larger magnitude than what we compute from our data, especially for non-US events near magnitude 5.0. If our magnitude for the event is less than magnitude 5.0, we may not issue a rapid report for it.
Earthquakes occurring outside the US and smaller than about magnitude 4.5 can be difficult for the USGS to locate if there are not enough data. The USGS continues to receive data from observatories throughout the world for several months after the events occur. Using those data, we add new events and revise existing events in later publications. For a description of these later publications and the data available, see Data.
Data Availability
Don't forget the "US" part of "USGS."
The regulars in quakewatch use several networks and often times deride USGS for it's lack of information that can be found elsewhere.
a reply to: jadedANDcynical
IMO, the USGS website is not reporting earthquakes, perhaps in an attempt by officials to not corroborate the findings of other seismologists, including from USGS, that the amount of earthquakes worldwide has been increasing.
Not that long ago I posted the findings from two USGS seismologists who combed through the ANSS (Advanced National Seismic System) composite catalog, which "is a world-wide earthquake catalog that is created by merging the master earthquake catalogs from contributing ANSS institutions and then removing duplicate solutions for the same event."
profile.usgs.gov...
The two USGS seismologists who posted their findings are Tom Parsons and Eric L. Geist.
BTW, yes I do know that these two earthquakes from Mexico I posted are not magnitude 5>, but it seems that the same thing is happening to lower magnitude earthquakes not being accurately reported by the official USGS website.
You will see some posters, whom I won't mention, who in the past when any evidence of this increase in worldwide earthquake activity has been shown they immediately point to the "official USGS website" which claim there is no such increase. I did not check all other earthquakes, it would take a while to do that, but this could be the reason why "officially" the USGS website does not show what the two USGS seismologists say is happening because the USGS website is, for some reason, not accurately posting all earthquakes.
IMO, the USGS website is not reporting earthquakes, perhaps in an attempt by officials to not corroborate the findings of other seismologists, including from USGS, that the amount of earthquakes worldwide has been increasing.
Not that long ago I posted the findings from two USGS seismologists who combed through the ANSS (Advanced National Seismic System) composite catalog, which "is a world-wide earthquake catalog that is created by merging the master earthquake catalogs from contributing ANSS institutions and then removing duplicate solutions for the same event."
The 2010–2014.3 global earthquake rate increase
Tom Parsons 1 and Eric L. Geist 1
1 U. S. Geological Survey, Menlo Park, California, USA
...
1. Introduction
Obvious increases in the global rate of large (M ≥ 7.0) earthquakes happened after 1992, 2010, and especially during the first quarter of 2014 (Table 1 and Figure 1). Given these high rates, along with suggestions that damaging earthquakes may be causatively linked at global distance [e.g., Gomberg and Bodin, 1994; Pollitz et al., 1998; Tzanis and Makropoulos, 2002; Bufe and Perkins, 2005; Gonzalez-Huizar et al., 2012; Pollitz et al., 2012, 2014], we investigate whether there is a significant departure from a random process underlying these rate changes. Recent studies have demonstrated that M ≥ 7.0 earthquakes (and also tsunamis) that occurred since 1900 follow a Poisson process [e.g., Michael, 2011; Geist and Parsons, 2011; Daub et al., 2012; Shearer and Stark, 2012; Parsons and Geist, 2012; Ben-Naim et al., 2013]. Here we focus on the period since 2010, which has M ≥ 7.0 rates increased by 65% and M ≥ 5.0 rates up 32% compared with the 1979 – present average. The first quarter of 2014 experienced more than double the average M ≥ 7.0 rate, enough to intrigue the news media [e.g., www.nbcnews.com...]. We extend our analysis to M ≥ 5.0 levels, as many of these lower magnitude events convey significant hazard, and global catalogs have not generally been tested down to these thresholds.
2. Methods and Data
We work with the Advanced National Seismic System (ANSS) catalog of M≥ 5.0 global earthquakes for the period between 1979 and 2014.3 with a primary focus on the recent interval between 2010 and 2014.3 that shows the highest earthquake rates (Table 1 and Figure 1). A variety of tests suggest that the catalog is complete down to magnitudes between M=4.6 and M=5.2, depending on the method used to assess it (see supporting information). We examine a range of lower magnitude thresholds above M =5.0 to account for this uncertainty.
...
profile.usgs.gov...
The two USGS seismologists who posted their findings are Tom Parsons and Eric L. Geist.
BTW, yes I do know that these two earthquakes from Mexico I posted are not magnitude 5>, but it seems that the same thing is happening to lower magnitude earthquakes not being accurately reported by the official USGS website.
You will see some posters, whom I won't mention, who in the past when any evidence of this increase in worldwide earthquake activity has been shown they immediately point to the "official USGS website" which claim there is no such increase. I did not check all other earthquakes, it would take a while to do that, but this could be the reason why "officially" the USGS website does not show what the two USGS seismologists say is happening because the USGS website is, for some reason, not accurately posting all earthquakes.
edit on 1-12-2016 by ElectricUniverse because: add comment.
originally posted by: jadedANDcynical
...
Don't forget the "US" part of "USGS."
...
The USGS website does not just post earthquakes that occur in the U.S. In fact, other earthquakes in Mexico are posted by the USGS website, check the link I gave and set settings to find earthquakes for the past 7 days of at least magnitude 2.5>.
The USGS website is supposed to report all earthquakes just like the EMSC doesn't just post earthquakes for Europe alone.
edit on 1-12-2016 by
ElectricUniverse because: correct comment.
originally posted by: GoShredAK
Does it show a 4.3 in Alaska from yesterday?
For Alaska it is showing on 11/30/16
M 3.1 - 7km WNW of Y, Alaska
Today on 12/1/16 it is showing in Alaska a
M 3.3 - 18km NW of Willow, Alaska
Looking at the EMSC website they are listing the 3.3 that occurred today in Alaska as a 3.4 magnitude.
Magnitude ML 3.4
Region SOUTHERN ALASKA
Date time 2016-12-01 23:55:55.0 UTC
Location 61.87 N ; 150.28 W
Depth 7 km
Distances 2188 km NW of Vancouver, Canada / pop: 1,838,000 / local time: 15:55:55.0 2016-12-01
824 km W of Whitehorse, Canada / pop: 23,300 / local time: 15:55:55.0 2016-12-01
69 km NW of Palmer, United States / pop: 6,000 / local time: 14:55:55.0 2016-12-01
19 km NW of Willow, United States / pop: 2,200 / local time: 14:55:55.0 2016-12-01
www.emsc-csem.org...
edit on 1-12-2016 by ElectricUniverse because: add and correct comment.
I just found another earthquake the USGS website is not showing, this time in California.
According to the EMSC website there was an earthquake on northern california at 23:48:17 (UTC) today 12/01/2016.
www.emsc-csem.org...
But the USGS website does not have that earthquake either. You have to set settings for "contiguous U.S." and to show all earthquakes of all magnitudes, but it does not appear.
Link
I even put the settings on the USGS website to show all earthquakes of all magnitudes in the continuous US for the past 30 days but this earthquake does not appear at the USGS website. Will keep looking for more earthquakes they are not showing.
According to the EMSC website there was an earthquake on northern california at 23:48:17 (UTC) today 12/01/2016.
Magnitude MD 2.4
Region NORTHERN CALIFORNIA
Date time 2016-12-01 23:48:17.2 UTC
Location 38.79 N ; 122.79 W
Depth 21 km
Distances 665 km NW of Los Angeles, United States / pop: 3,793,000 / local time: 15:48:17.2 2016-12-01
115 km W of Sacramento, United States / pop: 467,000 / local time: 15:48:17.2 2016-12-01
30 km S of Lakeport, United States / pop: 4,800 / local time: 15:48:17.2 2016-12-01
7 km SW of Cobb, United States / pop: 1,800 / local time: 15:48:17.2 2016-12-01
www.emsc-csem.org...
But the USGS website does not have that earthquake either. You have to set settings for "contiguous U.S." and to show all earthquakes of all magnitudes, but it does not appear.
Link
edit on 1-12-2016 by ElectricUniverse because: add link.
I even put the settings on the USGS website to show all earthquakes of all magnitudes in the continuous US for the past 30 days but this earthquake does not appear at the USGS website. Will keep looking for more earthquakes they are not showing.
edit on 1-12-2016 by ElectricUniverse because: add and correct comment.
edit on 1-12-2016 by ElectricUniverse because: add
comment.
Another earthquake in California the USGS website apparently is not showing.
www.emsc-csem.org...
Link
Magnitude MD 2.0
Region SAN FRANCISCO BAY AREA, CALIF.
Date time 2016-12-01 19:02:34.8 UTC
Location 37.32 N ; 122.11 W
Depth 0 km
Distances 504 km NW of Los Angeles, United States / pop: 3,793,000 / local time: 11:02:34.8 2016-12-01
150 km S of Sacramento, United States / pop: 467,000 / local time: 11:02:34.8 2016-12-01
19 km W of San Jose, United States / pop: 946,000 / local time: 11:02:34.8 2016-12-01
4 km S of Loyola, United States / pop: 3,300 / local time: 11:02:34.8 2016-12-01
www.emsc-csem.org...
Link
Another earthquake in California the USGS website is apparently not showing.
www.emsc-csem.org...
Link
Magnitude ML 2.2
Region GREATER LOS ANGELES AREA, CALIF.
Date time 2016-12-01 16:51:47.9 UTC
Location 34.19 N ; 118.84 W
Depth 28 km
Distances 57 km W of Los Angeles, United States / pop: 3,793,000 / local time: 08:51:47.9 2016-12-01
43 km E of Ventura, United States / pop: 96,800 / local time: 08:51:47.9 2016-12-01
2 km N of Thousand Oaks, United States / pop: 127,000 / local time: 08:51:47.9 2016-12-01
www.emsc-csem.org...
Link
Anyway, just to make sure to document the earthquakes being shown on the USGS website, took a couple pictures showing the earthquakes for today
12/1/16.
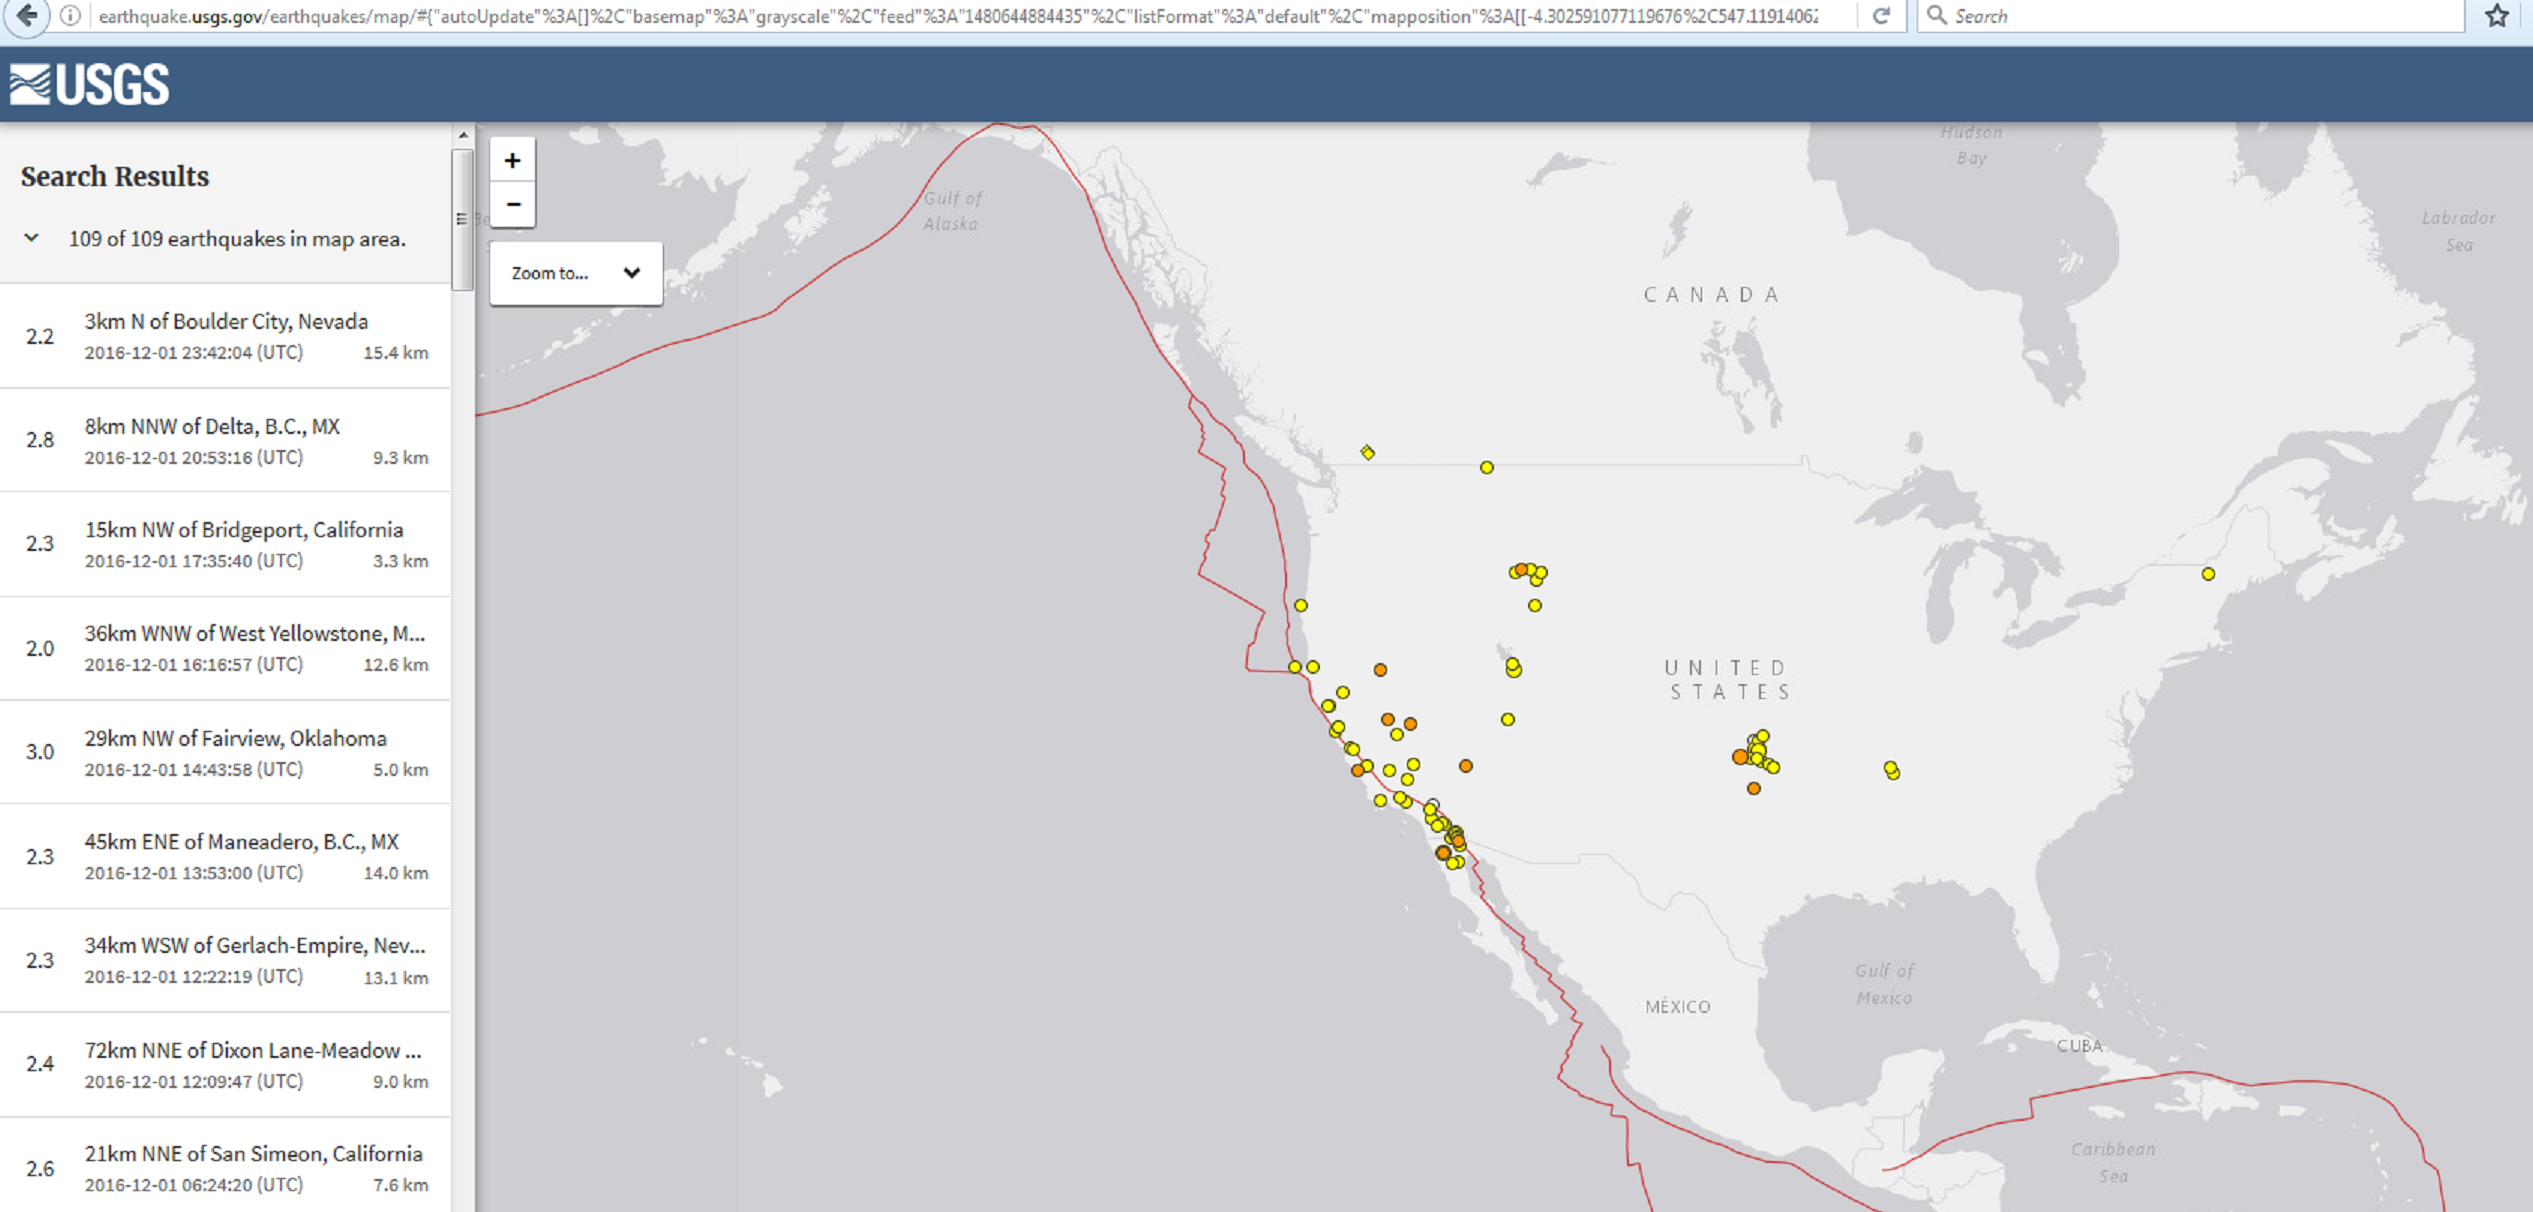
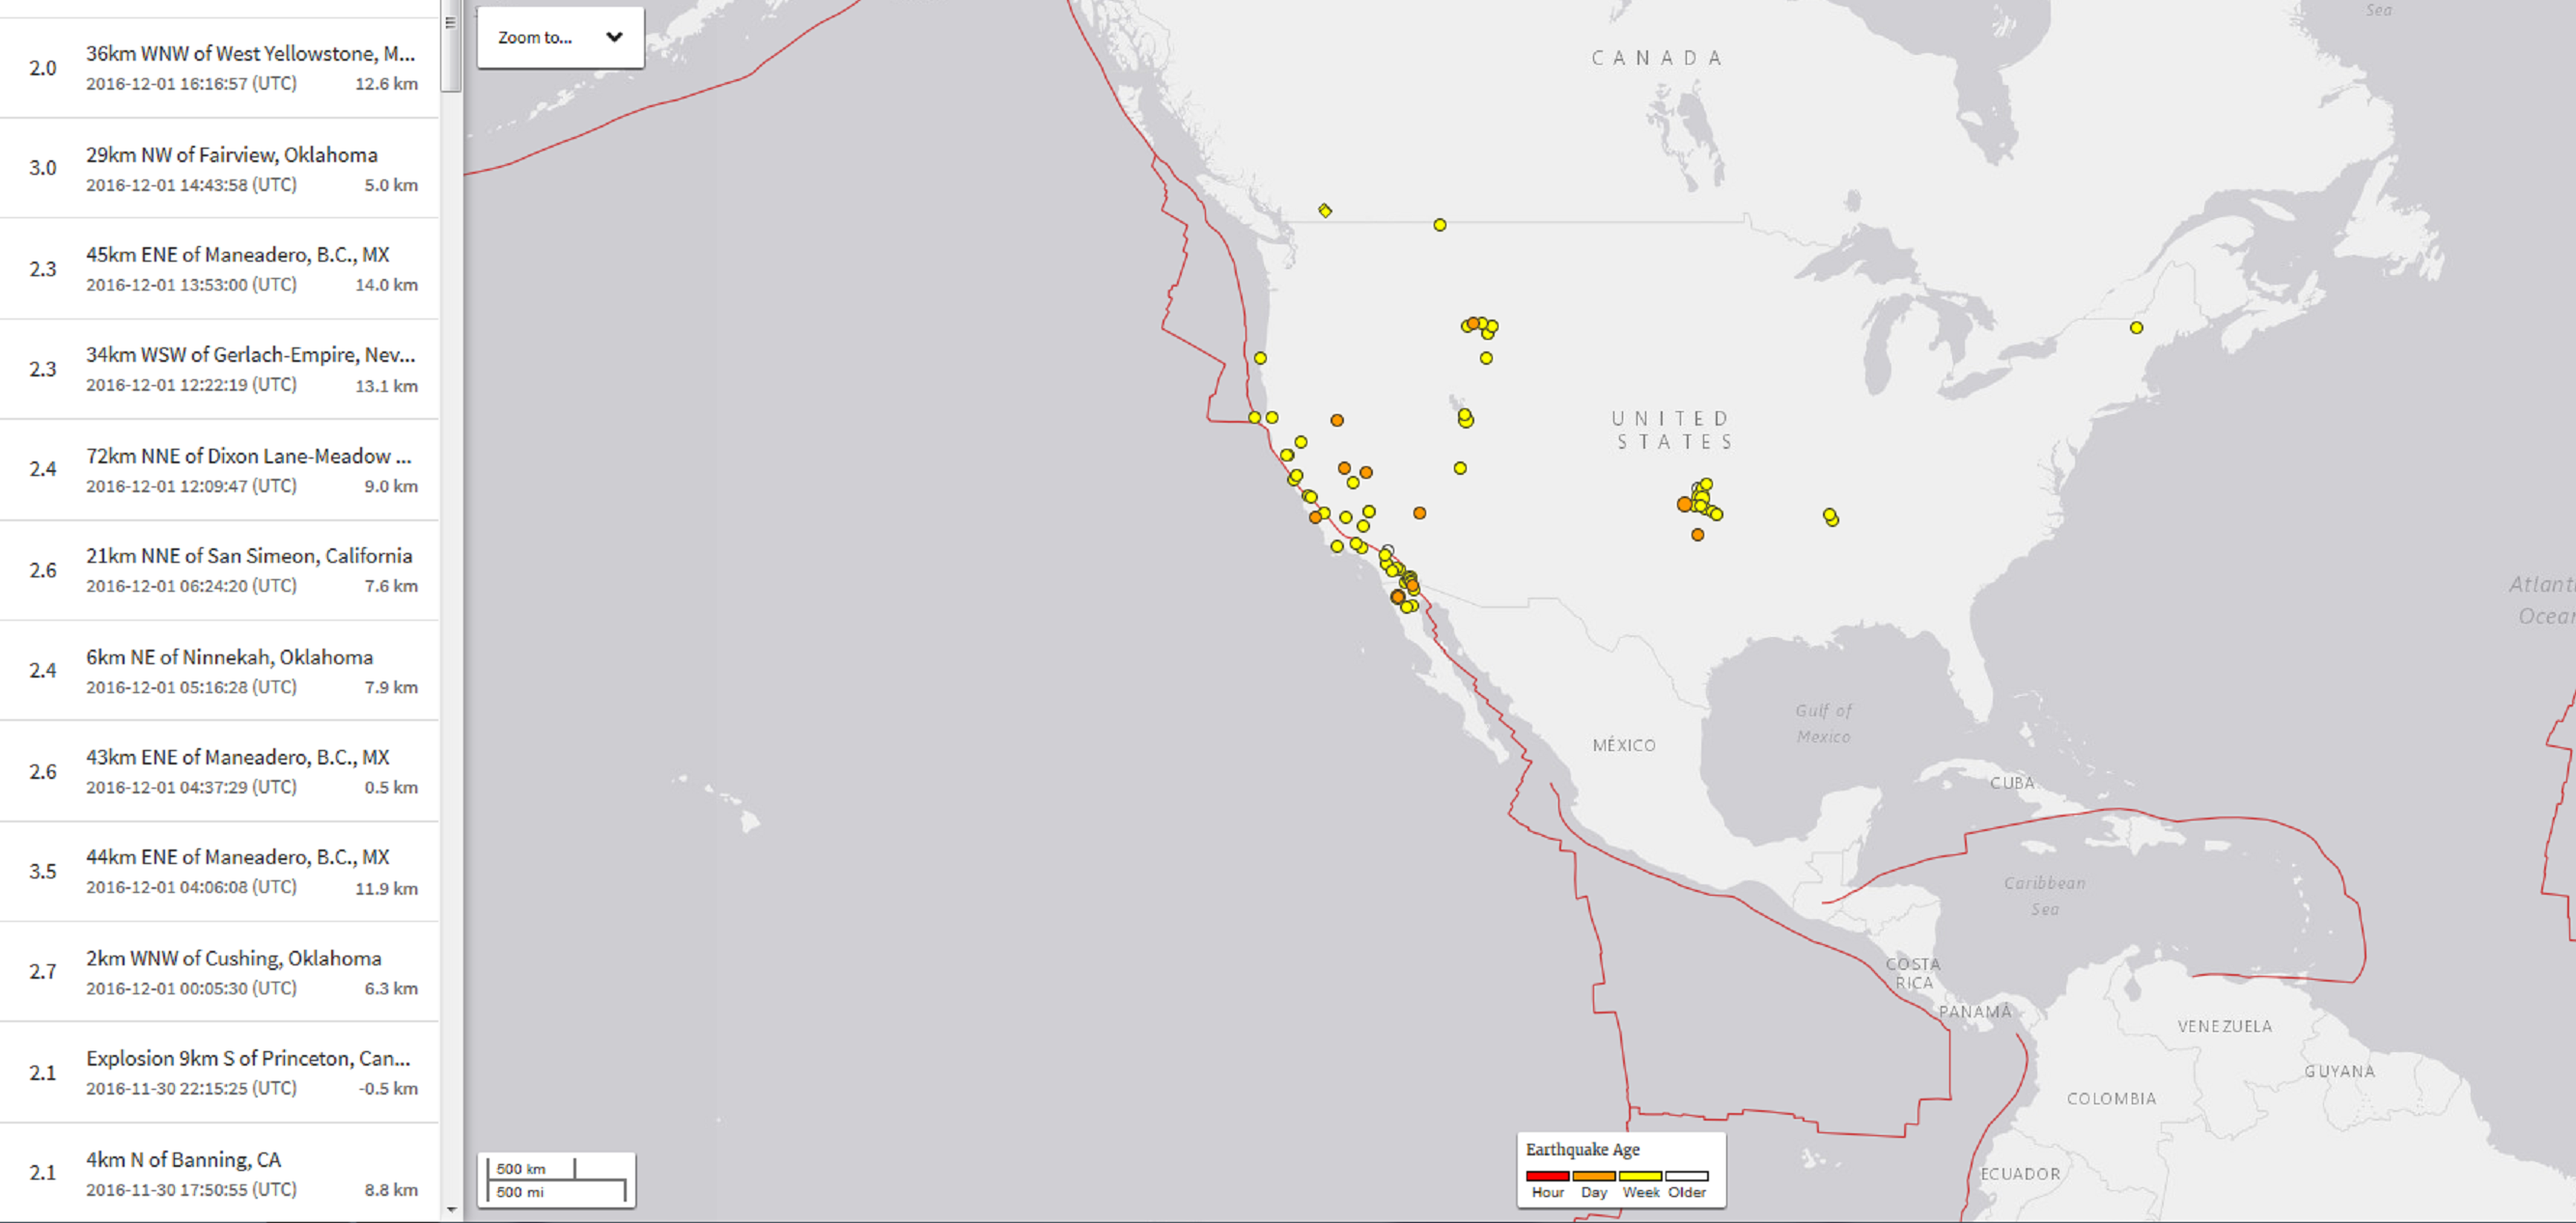
Just in case anything is changed on their website.
Had to cut the above two images to be able to increase the size of the pics and be able to read what it says.
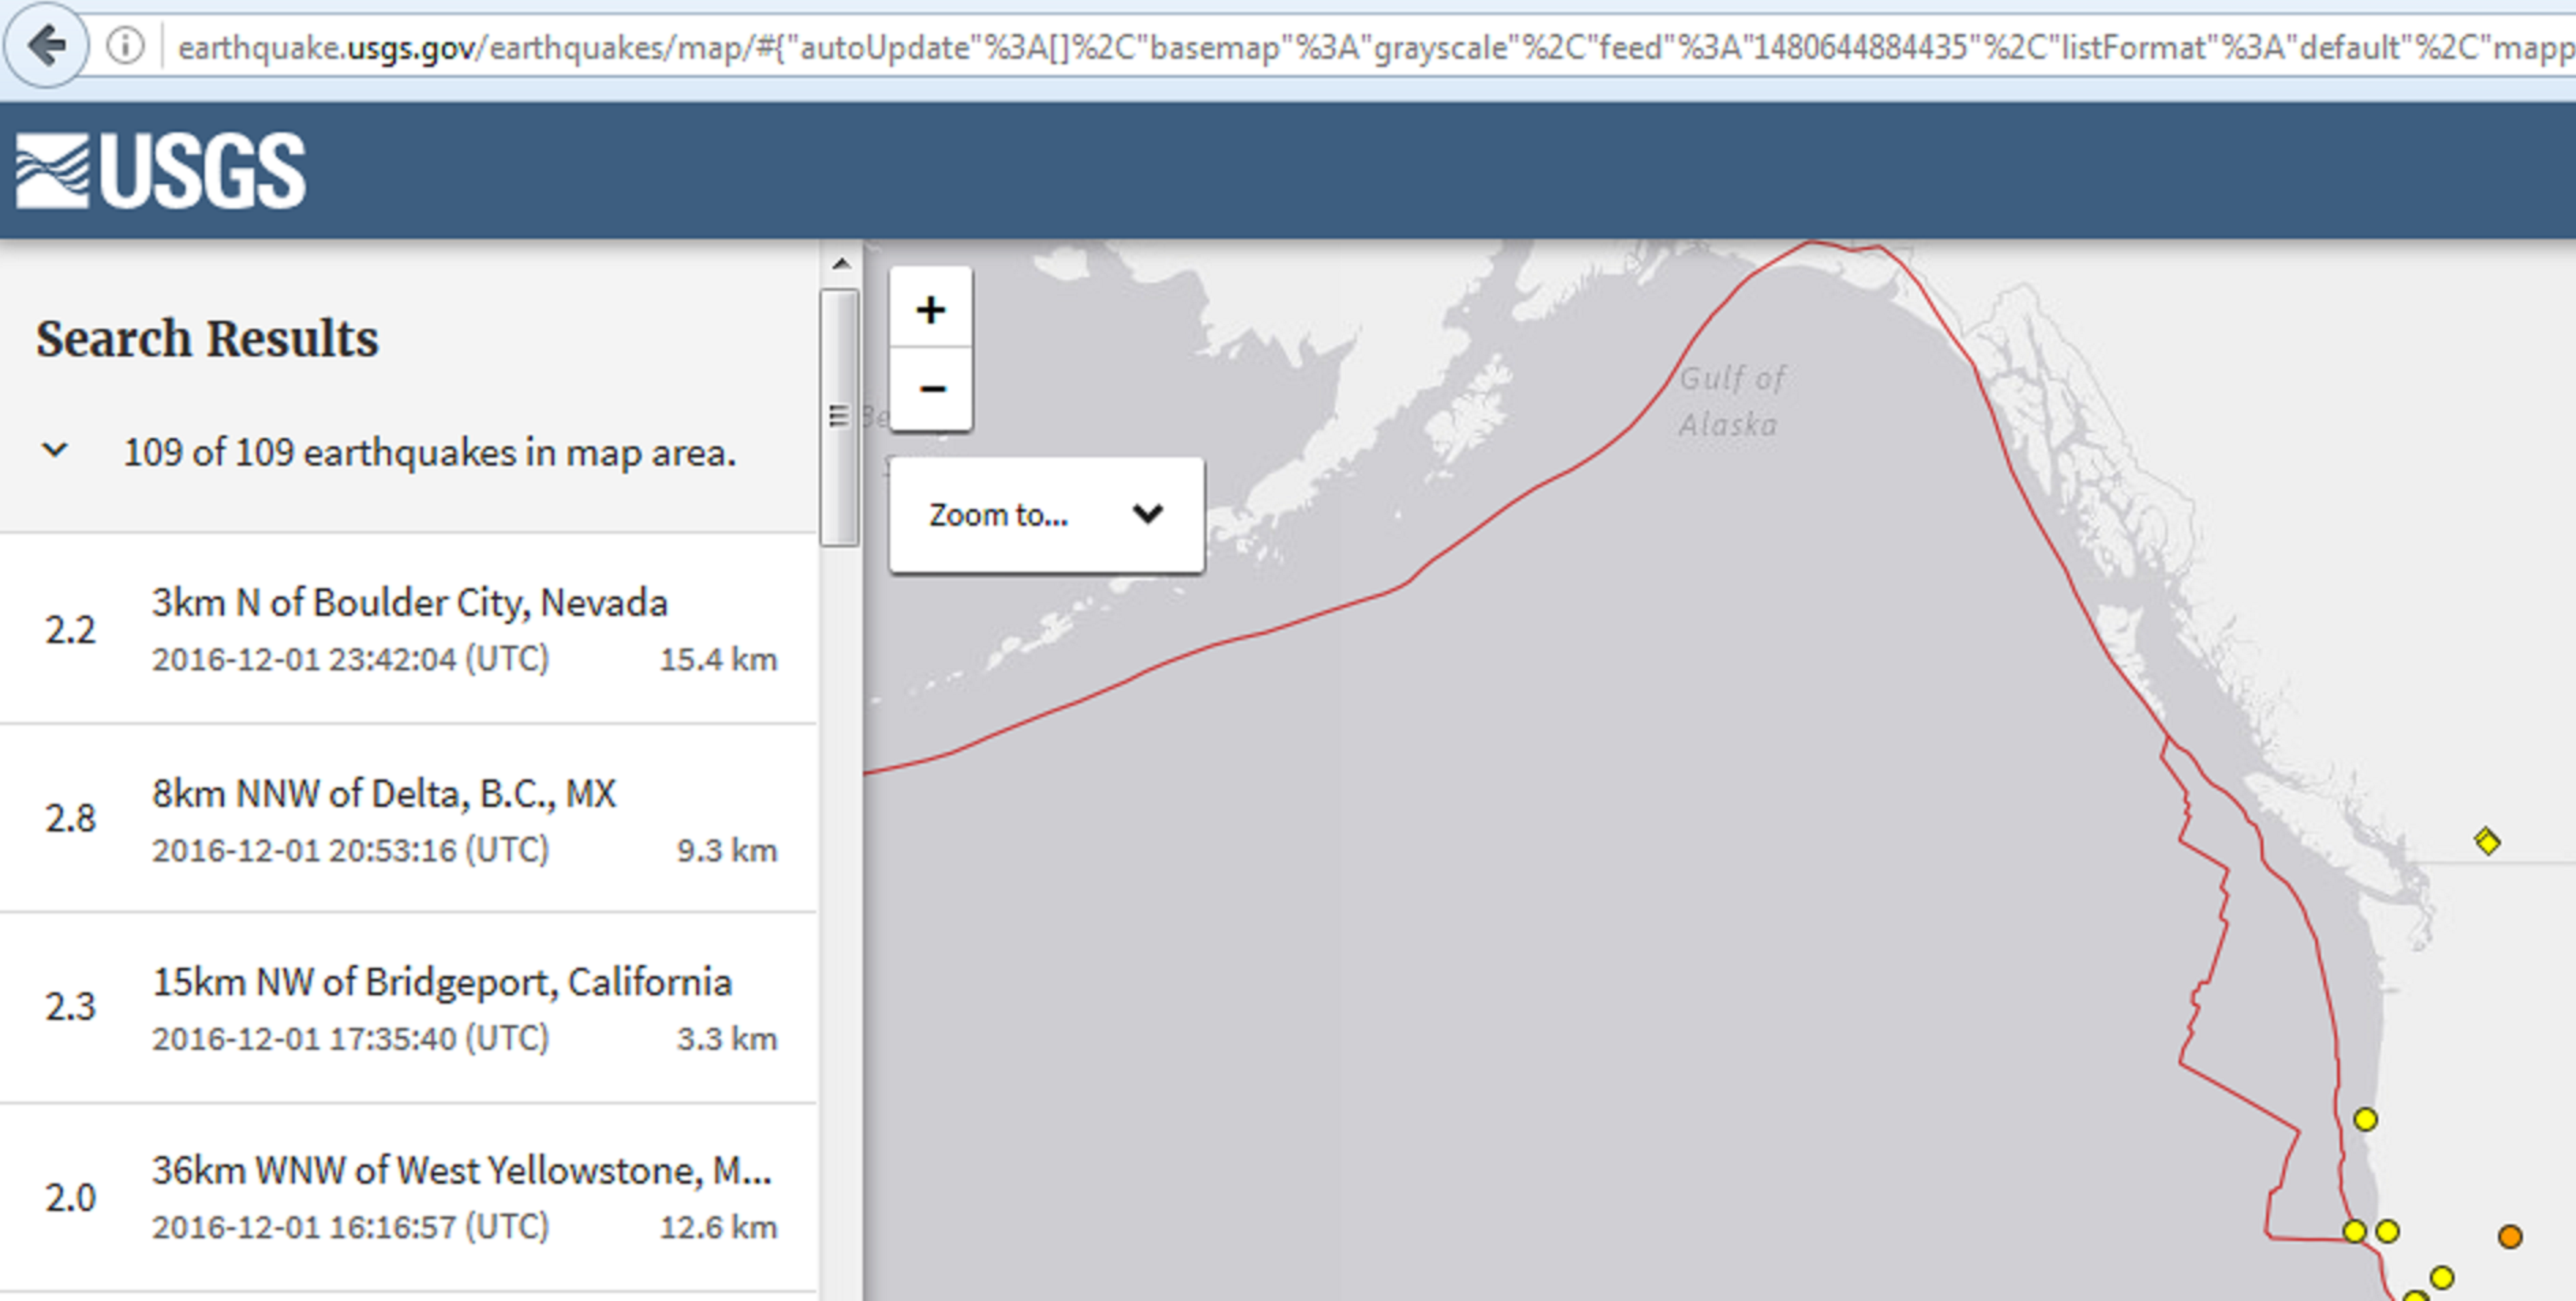

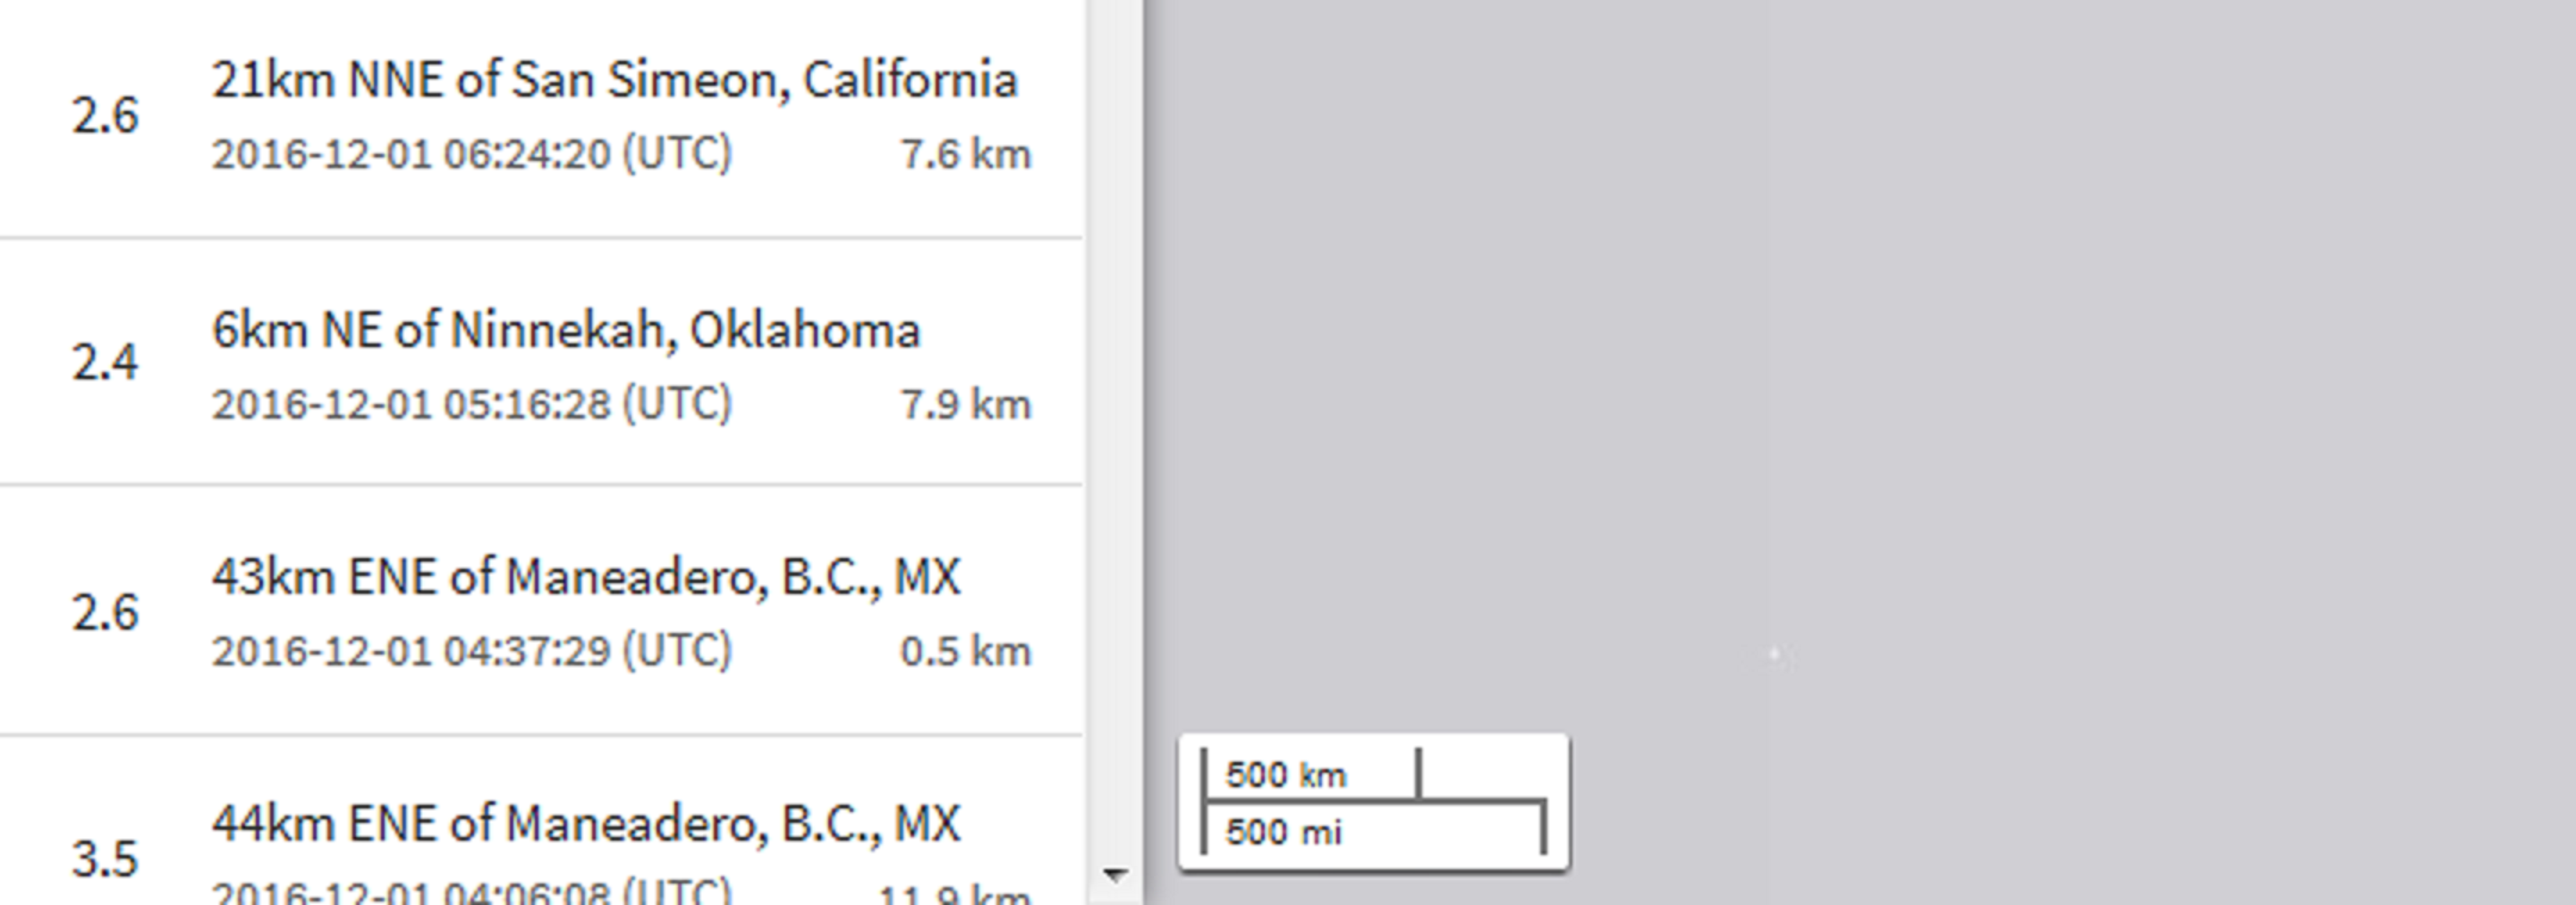

Also included the last earthquake reported for 11/30/16 so no one can claim I didn't take pictures of all earthquakes being reported in the USGS website for 12/01/16.
One more thing, all those earthquakes in the pictures are only 2.0> Didn't search for smaller than 2.0 magnitude earthquakes.


Just in case anything is changed on their website.
Had to cut the above two images to be able to increase the size of the pics and be able to read what it says.


Also included the last earthquake reported for 11/30/16 so no one can claim I didn't take pictures of all earthquakes being reported in the USGS website for 12/01/16.
One more thing, all those earthquakes in the pictures are only 2.0> Didn't search for smaller than 2.0 magnitude earthquakes.
edit on 1-12-2016 by ElectricUniverse because: add and correct comment.
edit on 1-12-2016 by ElectricUniverse because: add
comment.
a reply to: ElectricUniverse
Thanks for looking that up. I am trying to find some info on that other EQ.
There it is, 30 miles from a volcano and located on the ring of fire.
Thanks for looking that up. I am trying to find some info on that other EQ.
Moderate earthquake - Anchor Point, Alaska on November 30, 2016
Magnitude : 4.5 Local Time (conversion only below land) : 2016-11-30 09:57:07 GMT/UTC Time : 2016-11-30 18:57:07 Depth (Hypocenter) : 98.2 km
earthquake-report.com...
There it is, 30 miles from a volcano and located on the ring of fire.
edit on 1-12-2016 by GoShredAK because: (no reason given)
a reply to: GoShredAK
That one is being reported on the EMSC website but as a 4.4 magnitude quake.
www.emsc-csem.org...
That one is being reported on the EMSC website but as a 4.4 magnitude quake.
Magnitude ML 4.4
Region SOUTHERN ALASKA
Date time 2016-11-30 18:57:07.5 UTC
Location 60.01 N ; 152.68 W
Depth 99 km
Distances 2225 km NW of Vancouver, Canada / pop: 1,838,000 / local time: 10:57:07.5 2016-11-30
973 km W of Whitehorse, Canada / pop: 23,300 / local time: 10:57:07.5 2016-11-30
203 km SW of Anchorage, United States / pop: 292,000 / local time: 09:57:07.5 2016-11-30
54 km NW of Anchor Point, United States / pop: 2,000 / local time: 09:57:07.5 2016-11-30
www.emsc-csem.org...
edit on 1-12-2016 by ElectricUniverse because: correct excerpt.
a reply to: TrueBrit
The problem is that these earthquakes should appear on the search parameters of the USGS website. Sometimes earthquakes reported in different earthquake websites will have a small difference in magnitude. But these earthquakes are not appearing at all. Both sites report the earthquakes on UTC (Coordinated Universal Time), but the USGS website is not reporting a lot of earthquakes the (European) EMSC website is reporting in the U.S. and Mexico. Haven't checked any other areas, but this seems to be corroborating the fact that the USGS seems to be officially under-reporting earthquakes.
This in turn would be why when "certain ATS member/s" post the graphs of worldwide earthquakes from the USGS website, it "appears" as if there hasn't been an increase in earthquake activity, which is false. If it wasn't because of the research from the two USGS seismologists Tom Parsons and Eric L. Geist we would probably never have found out evidence that worldwide earthquake activity is in fact increasing.
edit on 1-12-2016 by ElectricUniverse because: add comment.
Actually doing a search, trying to find the link a...particular ATS member loves to post trying to dismiss the increase in earthquake activity, I
found out that another member, tauristercus, posted his findings that corroborate my statements that the USGS website is under-reporting
earthquakes.
Here is a link to his ATS thread.
www.abovetopsecret.com...
BTW, that "particular" ATS member that loves to dismiss the increase in global earthquake activity did the same thing to ATS member tauristercus's thread.
That "particular ATS member" can dismiss any evidence ATS members will post by posting "official links to USGS", but he can't dismiss the research from actual USGS seismologists who corroborate the fact that global earthquake activity is increasing, although he will try.
edit on 1-12-2016 by ElectricUniverse because: add comment.
Here is one of the pictures "the particular ATS member" loves to post to dismiss the global increase in earthquake activity.
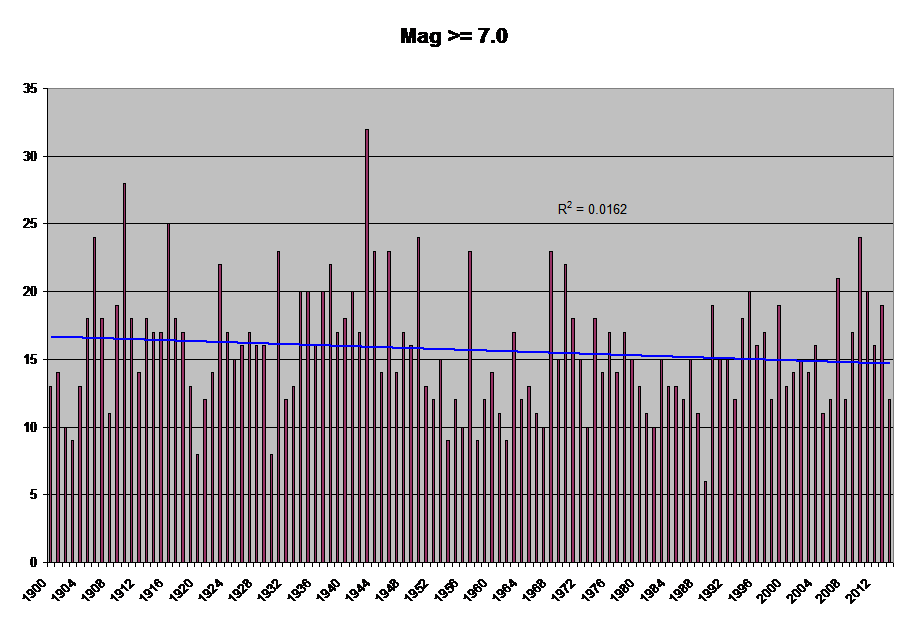
earthquake.usgs.gov...
But the thing is, it seems the USGS is "officially" not reporting some earthquakes. This way they can make it look like there is no global increase in earthquake activity.
Except when some of their own seismologists do proper research and find that there has been indeed a global increase in earthquake activity.
profile.usgs.gov...

earthquake.usgs.gov...
But the thing is, it seems the USGS is "officially" not reporting some earthquakes. This way they can make it look like there is no global increase in earthquake activity.
Except when some of their own seismologists do proper research and find that there has been indeed a global increase in earthquake activity.
The 2010–2014.3 global earthquake rate increase
Tom Parsons 1 and Eric L. Geist 1
1 U. S. Geological Survey, Menlo Park, California, USA
...
1. Introduction
Obvious increases in the global rate of large (M ≥ 7.0) earthquakes happened after 1992, 2010, and especially during the first quarter of 2014 (Table 1 and Figure 1). Given these high rates, along with suggestions that damaging earthquakes may be causatively linked at global distance [e.g., Gomberg and Bodin, 1994; Pollitz et al., 1998; Tzanis and Makropoulos, 2002; Bufe and Perkins, 2005; Gonzalez-Huizar et al., 2012; Pollitz et al., 2012, 2014], we investigate whether there is a significant departure from a random process underlying these rate changes. Recent studies have demonstrated that M ≥ 7.0 earthquakes (and also tsunamis) that occurred since 1900 follow a Poisson process [e.g., Michael, 2011; Geist and Parsons, 2011; Daub et al., 2012; Shearer and Stark, 2012; Parsons and Geist, 2012; Ben-Naim et al., 2013]. Here we focus on the period since 2010, which has M ≥ 7.0 rates increased by 65% and M ≥ 5.0 rates up 32% compared with the 1979 – present average. The first quarter of 2014 experienced more than double the average M ≥ 7.0 rate, enough to intrigue the news media [e.g., www.nbcnews.com...]. We extend our analysis to M ≥ 5.0 levels, as many of these lower magnitude events convey significant hazard, and global catalogs have not generally been tested down to these thresholds.
2. Methods and Data
We work with the Advanced National Seismic System (ANSS) catalog of M≥ 5.0 global earthquakes for the period between 1979 and 2014.3 with a primary focus on the recent interval between 2010 and 2014.3 that shows the highest earthquake rates (Table 1 and Figure 1). A variety of tests suggest that the catalog is complete down to magnitudes between M=4.6 and M=5.2, depending on the method used to assess it (see supporting information). We examine a range of lower magnitude thresholds above M =5.0 to account for this uncertainty.
...
profile.usgs.gov...
new topics
-
Only two Navy destroyers currently operational as fleet size hits record low
Military Projects: 3 hours ago -
George Stephanopoulos and ABC agree to pay $15 million to settle Trump defamation suit
Mainstream News: 8 hours ago
top topics
-
George Stephanopoulos and ABC agree to pay $15 million to settle Trump defamation suit
Mainstream News: 8 hours ago, 17 flags -
Light from Space Might Be Travelling Instantaneously
Space Exploration: 16 hours ago, 9 flags -
The MSM has the United Healthcare assassin all wrong.
General Conspiracies: 17 hours ago, 8 flags -
More Bad News for Labour and Rachel Reeves Stole Christmas from Working Families
Regional Politics: 14 hours ago, 8 flags -
2025 Bingo Card
The Gray Area: 17 hours ago, 7 flags -
Only two Navy destroyers currently operational as fleet size hits record low
Military Projects: 3 hours ago, 6 flags
active topics
-
George Stephanopoulos and ABC agree to pay $15 million to settle Trump defamation suit
Mainstream News • 11 • : WeMustCare -
President-Elect DONALD TRUMP's 2nd-Term Administration Takes Shape.
Political Ideology • 331 • : WeMustCare -
-@TH3WH17ERABB17- -Q- ---TIME TO SHOW THE WORLD--- -Part- --44--
Dissecting Disinformation • 3684 • : duncanagain -
Nov 2024 - Former President Barack Hussein Obama Has Lost His Aura.
US Political Madness • 15 • : WeMustCare -
Former DNI-Congressman John Ratcliffe says the U.S. Government is Intimidated by UFOs.
Aliens and UFOs • 41 • : WeMustCare -
The Mystery Drones and Government Lies
Political Conspiracies • 71 • : cherokeetroy -
One out of every 20 Canadians Dies by Euthanasia
Medical Issues & Conspiracies • 23 • : Daughter2v2 -
Drones everywhere in New Jersey
Aliens and UFOs • 165 • : Zaphod58 -
Mass UAP events. DC. Machester Airport, UFOs over sub base in CT, Nuke bases.
Aliens and UFOs • 57 • : WeMustCare -
FBI Director CHRISTOPHER WRAY Will Resign Before President Trump Takes Office on 1.20.2025.
US Political Madness • 26 • : WeMustCare
