It looks like you're using an Ad Blocker.
Please white-list or disable AboveTopSecret.com in your ad-blocking tool.
Thank you.
Some features of ATS will be disabled while you continue to use an ad-blocker.

"Weird Winter Weather Plot Thickens as Arctic Swiftly Warms"
page: 5share:
a reply to: Rezlooper
Yes, there is deforestation, but there has also been regrowth of plant life.
www.newscientist.com...
It has been shown time and again that higher atmospheric CO2 increases plant growth, and harvests. But there is no real evidence whatsoever that CO2 causes the warming claimed by the AGW camp. If it was true, their GCMs wouldn't be so wrong.
Yes, there is deforestation, but there has also been regrowth of plant life.
Carbon emissions helping to make Earth greener
05 June 2013 by Fred Pearce
Magazine issue 2920. Subscribe and save
For similar stories, visit the Climate Change Topic Guide
THE planet is getting lusher, and we are responsible. Carbon dioxide generated by human activity is stimulating photosynthesis and causing a beneficial greening of the Earth's surface.
For the first time, researchers claim to have shown that the increase in plant cover is due to this "CO2 fertilisation effect" rather than other causes. However, it remains unclear whether the effect can counter any negative consequences of global warming, such as the spread of deserts.
Recent satellite studies have shown that the planet is harbouring more vegetation overall, but pinning down the cause has been difficult. Factors such as higher temperatures, extra rainfall, and an increase in atmospheric CO2 – which helps plants use water more efficiently – could all be boosting vegetation.
To home in on the effect of CO2, Randall Donohue of Australia's national research institute, the CSIRO in Canberra, monitored vegetation at the edges of deserts in Australia, southern Africa, the US Southwest, North Africa, the Middle East and central Asia. These are regions where there is ample warmth and sunlight, but only just enough rainfall for vegetation to grow, so any change in plant cover must be the result of a change in rainfall patterns or CO2 levels, or both.
...
www.newscientist.com...
It has been shown time and again that higher atmospheric CO2 increases plant growth, and harvests. But there is no real evidence whatsoever that CO2 causes the warming claimed by the AGW camp. If it was true, their GCMs wouldn't be so wrong.
edit on 22-2-2015 by ElectricUniverse because: add comment.
a reply to: ElectricUniverse
You mean TSI being on the weaker side? How would that account for increased water vapor? According to the sun, we should have less water vapor in the atmosphere.
You mean TSI being on the weaker side? How would that account for increased water vapor? According to the sun, we should have less water vapor in the atmosphere.
edit on 2/22/2015 by Kali74 because: (no reason given)
Here is a new study that definitely adds to the debate: The overall takeaway from the study is that planets can indeed gravitationally influence each
other in compact solar systems in ways that heavily influence climate and therefore habitability. Much more work needs to be done in this area, said
Bolmont, to better learn how orbital shapes and distances change over time.
Read more at: phys.org...
Read more at: phys.org...
a reply to: eriktheawful
My sentiments exactly.
Now suddenly the well-known jet stream meridional flow is "rare", "unusual", "abnormal", and "unprecedented".
The jet stream has been bouncing back and forth between the zonal and meridional flows since the development of a fricken atmosphere.
Since when does something that happens all the time, year after year, suddenly become "unprecedented" ?? Do climatologists not own a Webster's dictionary ??
And until this so-called nonstop meridional flow lasts for another 29 1/2 years, how can they possibly claim that this is the new "climate trend" ?!
It's "climate" when it suits their needs, and "weather" when it doesn't.
My perspective on the Jet Stream?
It moves, it bends, it dips, it curves. Always has.
It looks to me like they're trying to say that the very cold temps we've been having in the east and warm temps in the west, are due to the Jet Stream.
They're right.
However, they seem to be acting like it never does this, that it's something abnormal.
My sentiments exactly.
Now suddenly the well-known jet stream meridional flow is "rare", "unusual", "abnormal", and "unprecedented".
The jet stream has been bouncing back and forth between the zonal and meridional flows since the development of a fricken atmosphere.
Since when does something that happens all the time, year after year, suddenly become "unprecedented" ?? Do climatologists not own a Webster's dictionary ??
unprecedented [uhn-pres-i-den-tid]
adjective
1. without previous instance; never before known or experienced; unexampled or unparalleled:
And until this so-called nonstop meridional flow lasts for another 29 1/2 years, how can they possibly claim that this is the new "climate trend" ?!
It's "climate" when it suits their needs, and "weather" when it doesn't.
edit on 22-2-2015 by CranialSponge because: (no reason given)
a reply to: CranialSponge
Its a natural eb and flow, its the sine wave climate pattern that the world has been following and it looks a lot like a heartbeat when you put it on a graph.
The weather is in a constant state of flux swinging back and forth and sometimes it swinges more than other times its pretty damn simple.
Now suddenly the well-known jet stream meridional flow is "rare", "unusual", "abnormal", and "unprecidented".
Its a natural eb and flow, its the sine wave climate pattern that the world has been following and it looks a lot like a heartbeat when you put it on a graph.
The weather is in a constant state of flux swinging back and forth and sometimes it swinges more than other times its pretty damn simple.
edit
on 2/22/2015 by onequestion because: (no reason given)
a reply to: ElectricUniverse
You would have to be crazy to think that C02 is the ONLY variable involved in a set of variables that affecting the climate. There are many many many other variables involved. Its crazy to think that. Its totally uneducated perspective spout by people who want to believe an agenda without doing the proper research.
It has been shown time and again that higher atmospheric CO2 increases plant growth, and harvests. But there is no real evidence whatsoever that CO2 causes the warming claimed by the AGW camp. If it was true, their GCMs wouldn't be so wrong.
You would have to be crazy to think that C02 is the ONLY variable involved in a set of variables that affecting the climate. There are many many many other variables involved. Its crazy to think that. Its totally uneducated perspective spout by people who want to believe an agenda without doing the proper research.
a reply to: onequestion
if the folks you spoke to would read the article I posted above, you wouldn't be wasting your breath.
The carbon issue is much more about plants, trees etc...and a lack of natural carbon sequestration. We have less then 60 years of topsoil left by some studies...I keep saying Climate Change enthusiasts are really having the wrong argument. We need to discuss improving our relationship with our environment, not trying to shame others people into paying taxes and avoiding the real problem...too damn many roads and buildings and corporate farms, not enough viable organic material to continue respiring CO2, making oxygen and soil.
Boneheads like AL Gore, DONT get their own premise, neither do most who parrot their thoughts.
a reply to: onequestion
Not necessarily but the point of my post was to state that if the sun were the only factor in climate we would have less water vapor (because we'd be cooling as TSI is lower).
Not necessarily but the point of my post was to state that if the sun were the only factor in climate we would have less water vapor (because we'd be cooling as TSI is lower).
originally posted by: MystikMushroom
Can confirm it warming in the Arctic...it's raining here in Alaska. In February. Normally this would be a very cold month for us. We haven't had much in the way of snow, or cold temps all winter.
Isn't it like the second year in a row for you guys now, for unseasonably warm weather?
One thing I really do not see many talk about is the fact that we were in a mini ice age for about 500 years.
People do not really understand just how cold it use to be. The Hudson river use to freeze over every year as did many others while not doing the same in 150 plus years, there was a reason that it was a harsh environment for European settlers that resulted in many dying. So sometime after 1850s we started to come out of it, and since we been in it for 500 years I do not think we have much historical data to tell us just what is normal, but we are now about equal to the Medieval Warm Period.
4 large volcano eruptions with in a short period of time followed by a period of low sun spots is what is suggested caused it. I'm not suggesting that man has zero influence in what is going on but I think it is much lower than what many would like us to believe with the invention of carbon credits...
from about 1350 to about 1850,[6] though climatologists and historians working with local records no longer expect to agree on either the start or end dates of this period, which varied according to local conditions. NASA defines the term as a cold period between AD 1550 and 1850 and notes three particularly cold intervals: one beginning about 1650, another about 1770, and the last in 1850, each separated by intervals of slight warming.
People do not really understand just how cold it use to be. The Hudson river use to freeze over every year as did many others while not doing the same in 150 plus years, there was a reason that it was a harsh environment for European settlers that resulted in many dying. So sometime after 1850s we started to come out of it, and since we been in it for 500 years I do not think we have much historical data to tell us just what is normal, but we are now about equal to the Medieval Warm Period.
4 large volcano eruptions with in a short period of time followed by a period of low sun spots is what is suggested caused it. I'm not suggesting that man has zero influence in what is going on but I think it is much lower than what many would like us to believe with the invention of carbon credits...
edit on 22-2-2015 by Xtrozero because: (no reason given)
originally posted by: safetymeeting
As of right now it's 50 degrees in Palmer, AK. Snow has been completely gone for days. It's like we are living in Seattle, WA with all this warm damp weather. I need my snow!
a reply to: Realtruth
You can go to Boston... Portland OR has been a very mild winter with 50s to 60s in temp and not the typical rain. Not much skying this year in the Mountains.
originally posted by: onequestion
Were not even remotely close to the Roman warming period and we have ice core sample data thats goes back 10-15,000 years ago.
I meant historical data as in what people think is the norm...
a reply to: Kali74
Ok, i guess we are going to have to go over this again.
First of all, if what you are claiming were true then we wouldn't have seen the Sun's activity increase like it had been doing during the time that the AGW camp keep claiming that "the sun was quiet"...
The sun had been quiet?... Really?...
physicsworld.com...
That was back in 2003.
Then we also have observational evidence that demonstrate that the Sun hadn't been quiet despite claims of the contrary from the AGW camp. Such as.
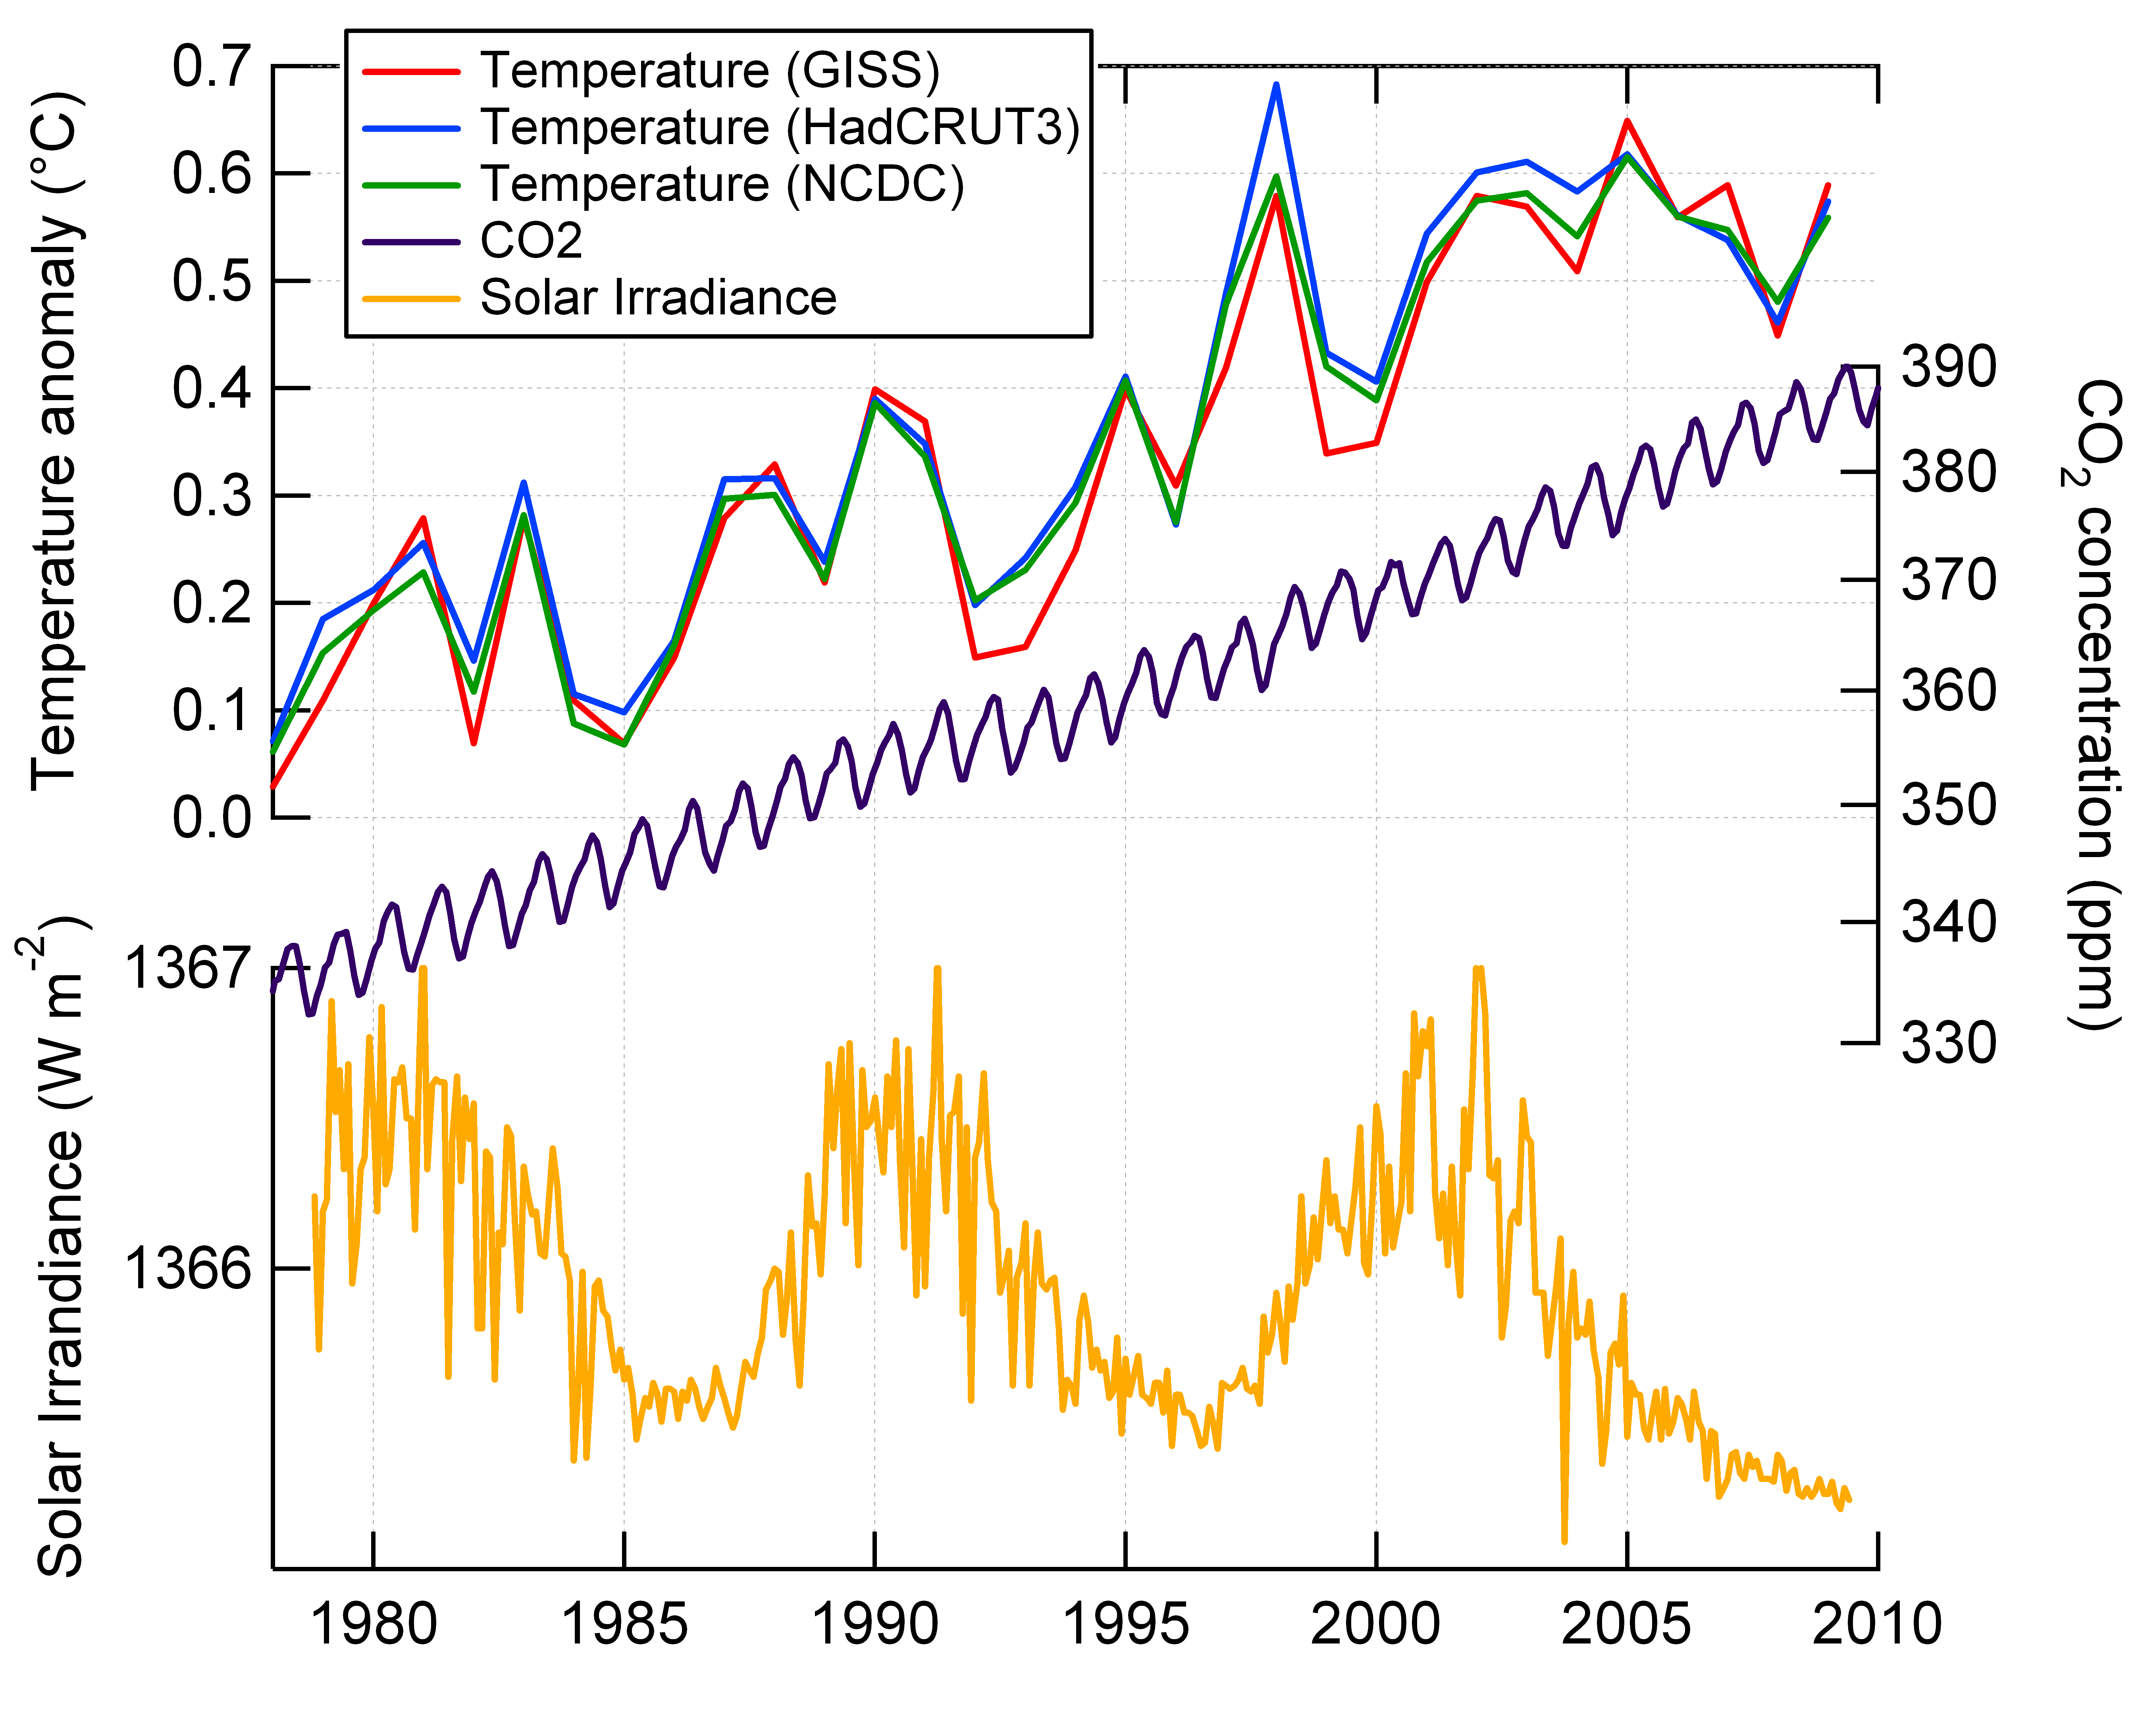
We know the Sun's activity had been increasing because there is evidence that the magnetic storm activity on the sun had been increasing as well.
The blue data set below the TSI graph shows how the solar magnetic storm strength had been increasing.
www.ngdc.noaa.gov...
Now, there has been a controversy because the data from six different satellites had to be overlapped to put together a long-term dataset of the sun's total output. The initial dataset seemed to show the results that can be seen in your graph. However, later investigations found that there have been errors made in the overlapping of the six satellite data.
But first, take a look at what NASA says would happen if there had been an increase in TSI of just 0.25% per decade.
earthobservatory.nasa.gov...
Systematic changes in TSI of just 0.25% per decade ca cause the complete range of climate variations. From global tropical conditions, to events like the"little Ice Age", to Ice Ages.
Below i will show what the evidence says on how TSI trend had been increasing, then we can form an opinion on whether or not these changes could have caused the "climate change" we have been seeing.
Ok, i guess we are going to have to go over this again.
First of all, if what you are claiming were true then we wouldn't have seen the Sun's activity increase like it had been doing during the time that the AGW camp keep claiming that "the sun was quiet"...
The sun had been quiet?... Really?...
Solar activity reaches new high
Dec 2, 2003
Geophysicists in Finland and Germany have calculated that the Sun is more magnetically active now than it has been for over a 1000 years. Ilya Usoskin and colleagues at the University of Oulu and the Max-Planck Institute for Aeronomy say that their technique – which relies on a radioactive dating technique - is the first direct quantitative reconstruction of solar activity based on physical, rather than statistical, models (I G Usoskin et al. 2003 Phys. Rev. Lett. 91 211101)
...
Using modelling techniques, the Finnish team was able to extend data on solar activity back to 850 AD. The researchers found that there has been a sharp increase in the number of sunspots since the beginning of the 20th century. They calculated that the average number was about 30 per year between 850 and 1900, and then increased to 60 between 1900 and 1944, and is now at its highest ever value of 76.
“We need to understand this unprecedented level of activity,” Usoskin told PhysicsWeb. “Is it is a rare event that happens once a millennium - which means that the Sun will return to normal - or is it a new dynamic state that will keep solar activity levels high?” The Finnish-German team also speculates that increased solar activity may be having an effect on the Earth’s climate, but more work is needed to clarify this.
physicsworld.com...
That was back in 2003.
Then we also have observational evidence that demonstrate that the Sun hadn't been quiet despite claims of the contrary from the AGW camp. Such as.
We know the Sun's activity had been increasing because there is evidence that the magnetic storm activity on the sun had been increasing as well.
The blue data set below the TSI graph shows how the solar magnetic storm strength had been increasing.
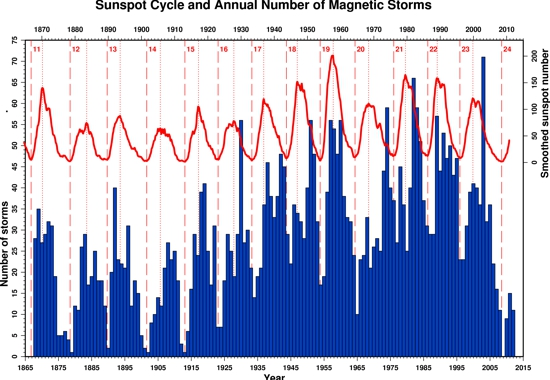
Major Magentic Storms 1868-2007
According to the AA* criteria
...
Because of the difference in units of presentation, the values of AA* and Ap* are not the same so that different major magnetic storm onset and end threshold values are used for the two series. However their comparison for the years of overlapping coverage show that relative frequency of occurrence of major storms per year are similar. Another reason for differences is that an index derived from magnetic perturbation values at only two observatories easily experiences larger extreme values if either input site is well situated to the overhead ionospheric and.or field aligned current systems producing the magnetic storm effects. Although not documented here, it is interesting to note that the overall level of magnetic disturbance from year to year has increased substantially from a low around 1900 Also, the level of mean yearly aa is now much higher so that a year of minimum magnetic disturbances now is typically more disturbed than years at maximum disturbance levels before 1900.
...
www.ngdc.noaa.gov...
www.ngdc.noaa.gov...
Now, there has been a controversy because the data from six different satellites had to be overlapped to put together a long-term dataset of the sun's total output. The initial dataset seemed to show the results that can be seen in your graph. However, later investigations found that there have been errors made in the overlapping of the six satellite data.
But first, take a look at what NASA says would happen if there had been an increase in TSI of just 0.25% per decade.
Variations in Total Solar Irradiance
The ACRIM I instrument was the first to clearly demonstrate that the total radiant energy emanating from the sun was not a constant, and varied in proportion to solar magnetic activity. However, the sun’s output changes so slowly and solar variability is so slight (less than 0.00425% of the total energy per year on time scales of days), that continuous monitoring by state-of-the-art instrumentation is necessary to detect changes with climate significance. Scientists theorize that as much as 25% of the 20th century anticipated global warming of the Earth may be due to changes in the sun’s energy output. Systematic changes in irradiance as little as 0.25% per century can cause the complete range of climate variations that have occurred in the past, ranging from ice ages to global tropical conditions. For example, scientists believe the "Little Ice Age" that occured in Europe in the late 17th century could have been related to the minimum in sunspot activity (and a correlated minimum in total solar irradiance) that occured during the same period.
earthobservatory.nasa.gov...
Systematic changes in TSI of just 0.25% per decade ca cause the complete range of climate variations. From global tropical conditions, to events like the"little Ice Age", to Ice Ages.
Below i will show what the evidence says on how TSI trend had been increasing, then we can form an opinion on whether or not these changes could have caused the "climate change" we have been seeing.
March 20, 2003 (date of web publication)
NASA Study Finds Increasing Solar Trend That Can Change Climate
Since the late 1970s, the amount of solar radiation the sun emits, during times of quiet sunspot activity, has increased by nearly .05 percent per decade, according to a NASA funded study.
"This trend is important because, if sustained over many decades, it could cause significant climate change," said Richard Willson, a researcher affiliated with NASA's Goddard Institute for Space Studies and Columbia University's Earth Institute, New York. He is the lead author of the study recently published in Geophysical Research Letters.
...
Although the inferred increase of solar irradiance in 24 years, about 0.1 percent, is not enough to cause notable climate change, the trend would be important if maintained for a century or more. Satellite observations of total solar irradiance have obtained a long enough record (over 24 years) to begin looking for this effect.
...
In this study, Willson, who is also Principal Investigator of NASA's ACRIM experiments, compiled a TSI record of over 24 years by carefully piecing together the overlapping records. In order to construct a long-term dataset, he needed to bridge a two-year gap (1989 to 1991) between ACRIM1 and ACRIM2. Both the Nimbus7/ERB and ERBS measurements overlapped the ACRIM 'gap.' Using Nimbus7/ERB results produced a 0.05 percent per decade upward trend between solar minima, while ERBS results produced no trend. Until this study, the cause of this difference, and hence the validity of the TSI trend, was uncertain. Willson has identified specific errors in the ERBS data responsible for the difference. The accurate long-term dataset, therefore, shows a significant positive trend (.05 percent per decade) in TSI between the solar minima of solar cycles 21 to 23 (1978 to present). This major finding may help climatologists to distinguish between solar and man-made influences on climate.
...
www.nasa.gov...
The above study by Wilson covered only 24 years, from 1978 until 2002, and the trend he found is that the Sun's activity had been increasing in times of quiet sunspot activity. Even though Wilson's study was from 1978 until 2002, we also have other research from Geophysicists in Finland and Germany which shows that solar activity has been increasing. The average sunspot number was about 30 per year between 850 and 1900, and then increased to 60 between 1900 and 1944, and is now (2002-2003) at its highest ever value of 76.
But it doesn't end there.
ACRIM-gap and TSI trend issue resolved using a surface magnetic
flux TSI proxy model
Nicola Scafetta
1
and Richard C. Willson
2
Received 10 October 2008; revised 12 December 2008; accepted 13 January 2009; published 3 March 2009.
[1] TheACRIM-gap(1989.5–1991.75) continuitydilemma for satellite TSI observations is resolved by bridging the satellite TSI monitoring gap between ACRIM1 and ACRIM2 results with TSI derived from Krivova et al.’s (2007) proxy model based on variations of the surface distribution of solar magnetic flux. ‘Mixed’ versions of ACRIM and PMOD TSI composites are constructed with their composites’ original values except for the ACRIM gap, where Krivova modeled
TSI is used to connect ACRIM1 and ACRIM2 results. Both ‘mixed’ composites demonstrate a significant TSI increase of 0.033 %/decade between the solar activity minima of 1986 and 1996, comparable to the 0.037 % found in the ACRIM composite. The finding supports the contention of Willson (1997) that the ERBS/ERBE results are flawed by uncorrected degradation during the ACRIM gap and refutes the Nimbus7/ERB ACRIM gap adjustment Fröhlich and Lean (1998) employed in constructing the PMOD.
Citation:
Scafetta, N., and R. C. Willson (2009), ACRIM-gap and
TSI trend issue resolved using a surface magnetic flux TSI proxy
model,
Geophys. Res. Lett.,36, L05701, doi:10.1029/2008GL036307.
...
This finding has evident repercussions for climate change and solar physics. Increasing TSI between 1980 and 2000 could have contributed significantly to global warming during the last three decades [Scafetta and West, 2007, 2008]. Current climate models [Intergovernmental Panel on Climate Change, 2007] have assumed that the TSI did not vary significantly during the last 30 years and have therefore underestimated the solar contribution and overestimated the anthropogenic contribution to global warming.
...
onlinelibrary.wiley.com...
Here is a graph showing the difference from the ACRIM Composite, and the PMOD Composite published in 2014.
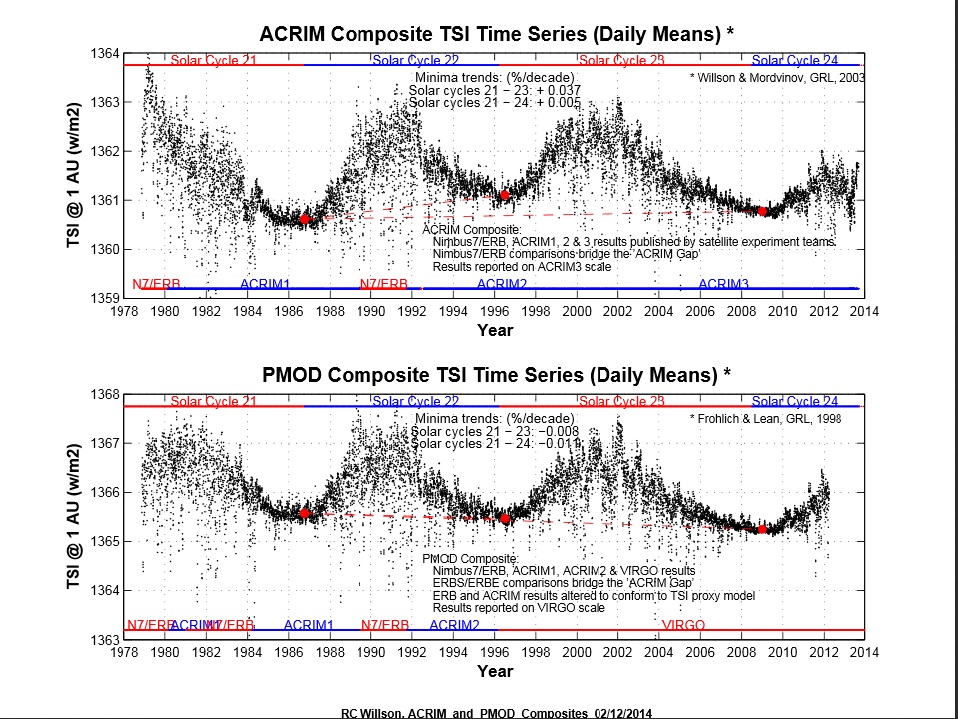
acrim.com...
acrim.com...
As for what has been the Sun's activity lately? It seems to be going haywire again up and down.
You also have to remember that the problem is not only the "number" of sunspots. Sunspot strength also influences how they will affect Earth's climate and of course even it's weather.
www.ips.gov.au...
www.astro.cf.ac.uk...
Again, the above is from 2003. Since then the strength of sunspots have been going even more haywire from very low, to stronger than those from 2003 and before.
Sunspot explosion causes largest radiation storm since 2003
One of the latest being.
www.washingtonpost.com...
Also remember that right here on Earth our oceans store large amount of heat that our sun sends our way. All that energy doesn't just disappear, and during times when our sun's activity lowers considerably our oceans react to the change which also contributes to changes in climate, and weather, releasing more stored energy.
Then we also have to take into consideration that our solar system is not in a static environment. It moves throughout the universe and seems to be moving into a different region of space which is a million degrees hotter than the one we are in. Our solar system has been already encountering small cloudlets of this region of space and this has consequences on our climate, and weather as well. Not to mention the increase volcanic and seismic activity which is becoming more and more common.
You also have to remember that the problem is not only the "number" of sunspots. Sunspot strength also influences how they will affect Earth's climate and of course even it's weather.
A Remarkable Period of Space Weather October-November 2003
Up until October 2003, solar cycle 23 was quite ordinary and there were few periods of intense space weather activity (notably July 2000, April 2001) - little of excitement for space weather forecasters. But a dramatic burst of activity on the Sun in October/November 2003 had everything: very large sunspot regions; intense solar flares; particle events; and a huge geomagnetic disturbance. The intense space weather activity had many important effects on the many systems that depend on space weather conditions for their operation.
...
www.ips.gov.au...
Solar Flares and Aurorae
Astronomers at Cardiff University Observatory monitored the extreme activity on the Sun during late 2003.
The sunspot groups in the images below are among the largest sunspot groups that have ever been observed. The group to the left of centre in the image taken on 27 October was responsible for triggering a gigantic coronal mass ejection (CME) towards the earth. This particular CME struck the Earth on the evening of Wednesday 29 October 2003, causing spectacular displays of the Aurora Borealis or Northern Lights. This was visible over most of Britain and could be seen as far south as Cardiff.
...
www.astro.cf.ac.uk...
Again, the above is from 2003. Since then the strength of sunspots have been going even more haywire from very low, to stronger than those from 2003 and before.
Sunspot explosion causes largest radiation storm since 2003
One of the latest being.
Capital Weather Gang
Largest sunspot in more than 20 years facing Earth
By Jason Samenow and Angela Fritz October 23, 2014
Sunspot region 2192 is one of the largest sunspots in solar cycle 24. (NOAA)
A massive sunspot region is staring at the Earth, and frequently hurling out high energy solar flares. But so far, none of the flares have been complemented by a blast of plasma known as a coronal mass ejection (CME) that can lead to aurora in the Earth’s atmosphere and interfere with spacecraft operations and power systems.
The sunspot region, known as AR2192, is so big that it is visible to a (well-protected) naked eye and was visible during Thursday’s partial solar eclipse.
“This is the largest sunspot group since November of 1990,” said Doug Biesecker, a researcher at the National Weather Service Space Weather Prediction Center. Its size is 2,740 millionths of the solar disc which, according to the Web site The Sun Today, is roughly the size of Jupiter.
NASA says the largest sunspot on record, observed in 1947, was almost three times as large as AR2192. Consider that AR2192 is 80,000 miles in diameter – and you could lay 10 Earths across it.
...
www.washingtonpost.com...
Also remember that right here on Earth our oceans store large amount of heat that our sun sends our way. All that energy doesn't just disappear, and during times when our sun's activity lowers considerably our oceans react to the change which also contributes to changes in climate, and weather, releasing more stored energy.
Then we also have to take into consideration that our solar system is not in a static environment. It moves throughout the universe and seems to be moving into a different region of space which is a million degrees hotter than the one we are in. Our solar system has been already encountering small cloudlets of this region of space and this has consequences on our climate, and weather as well. Not to mention the increase volcanic and seismic activity which is becoming more and more common.
edit on 23-2-2015 by ElectricUniverse because: add comment.
new topics
-
BIDEN Admin Begins Planning For January 2025 Transition to a New President - Today is 4.26.2024.
2024 Elections: 6 hours ago -
Big Storms
Fragile Earth: 7 hours ago -
Where should Trump hold his next rally
2024 Elections: 10 hours ago -
Shocking Number of Voters are Open to Committing Election Fraud
US Political Madness: 11 hours ago
top topics
-
James O’Keefe: I have evidence that exposes the CIA, and it’s on camera.
Whistle Blowers and Leaked Documents: 12 hours ago, 17 flags -
Australian PM says the quiet part out loud - "free speech is a threat to democratic dicourse"...?!
New World Order: 13 hours ago, 15 flags -
Blast from the past: ATS Review Podcast, 2006: With All Three Amigos
Member PODcasts: 17 hours ago, 14 flags -
Biden "Happy To Debate Trump"
2024 Elections: 14 hours ago, 14 flags -
Ireland VS Globalists
Social Issues and Civil Unrest: 14 hours ago, 11 flags -
Mike Pinder The Moody Blues R.I.P.
Music: 17 hours ago, 9 flags -
BIDEN Admin Begins Planning For January 2025 Transition to a New President - Today is 4.26.2024.
2024 Elections: 6 hours ago, 9 flags -
Big Storms
Fragile Earth: 7 hours ago, 8 flags -
What is the white pill?
Philosophy and Metaphysics: 16 hours ago, 6 flags -
Shocking Number of Voters are Open to Committing Election Fraud
US Political Madness: 11 hours ago, 6 flags
active topics
-
Man possibly killed by werewolf in Texas
Cryptozoology • 28 • : RustyShack78 -
Most Compelling Loch Ness Monster Pictures Defy Explanation
Cryptozoology • 60 • : RustyShack78 -
Hate makes for strange bedfellows
US Political Madness • 54 • : Terpene -
A Warning to America: 25 Ways the US is Being Destroyed
New World Order • 30 • : glen200376 -
Eclipse picture taken by my son from the NH-ME border - Cool!
General Chit Chat • 26 • : EyeoftheHurricane -
University of Texas Instantly Shuts Down Anti Israel Protests
Education and Media • 319 • : CriticalStinker -
-@TH3WH17ERABB17- -Q- ---TIME TO SHOW THE WORLD--- -Part- --44--
Dissecting Disinformation • 705 • : cherokeetroy -
Falkville Robot-Man
Aliens and UFOs • 10 • : billxam1 -
Gov Kristi Noem Shot and Killed "Less Than Worthless Dog" and a 'Smelly Goat
2024 Elections • 64 • : cherokeetroy -
What is the white pill?
Philosophy and Metaphysics • 23 • : TheDiscoKing