It looks like you're using an Ad Blocker.
Please white-list or disable AboveTopSecret.com in your ad-blocking tool.
Thank you.
Some features of ATS will be disabled while you continue to use an ad-blocker.

Japan Preliminary Earthquake Maps NIED
page: 1share:
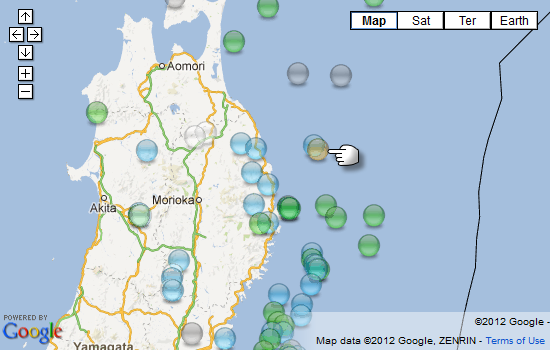
The following hypocenter maps show earthquake information (today and yesterday) determined by the NIED Hi-net automatic hypocenter determination
system.
Since this is preliminary and automatic report, you have to check the formal information released by the JMA, also know as "reviewed" data.(which I also collect, and publish maps of each day, but that is like 2 days after the event).
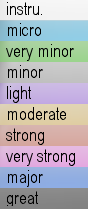
The main thing you'll need is this, a key to the icon/dots/orbs, to be able to tell what magnitude they are.
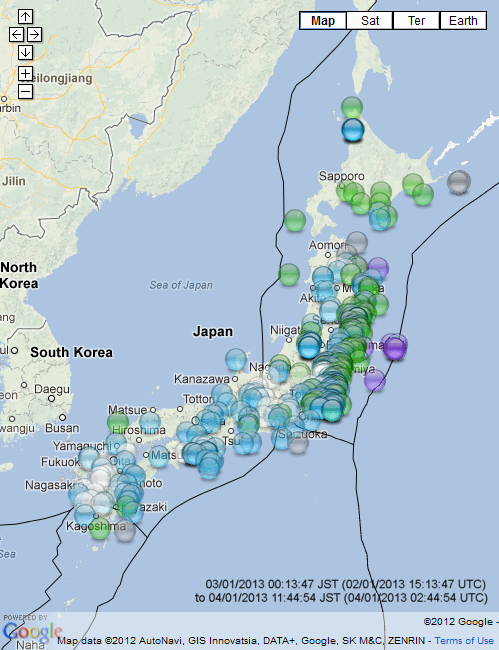
Here is a sample interactive map which opens in Google Maps, of the 35 hours 03/01/2013 00:13:47 JST (02/01/2013 15:13:47 UTC) to 04/01/2013 11:44:54 JST (04/01/2013 02:44:54 UTC)
for those not familiar with the GMaps system, just click on an icon and a pop up tag comes up with the data on it. Click elsewhere on the map to make the tag go away.
You can also click on the items on the list in the left hand column and the tags popup too, they are newest at the top descending to the oldest at the bottom.
here is what it looks like screenshot
those black lines are the tectonic plate boundries
When I'm on NIED gathering the reviewed data I often download this latest data just to see whats happened recently, its easy enough to run the data through the mapping system I use.
I usually do this once a day if I can.
Anyone interested
If so I'll put the link to the interactive map on here each day.
I won't do a screenshot every time, too much work.
Since this is preliminary and automatic report, you have to check the formal information released by the JMA, also know as "reviewed" data.(which I also collect, and publish maps of each day, but that is like 2 days after the event).
The main thing you'll need is this, a key to the icon/dots/orbs, to be able to tell what magnitude they are.
Here is a sample interactive map which opens in Google Maps, of the 35 hours 03/01/2013 00:13:47 JST (02/01/2013 15:13:47 UTC) to 04/01/2013 11:44:54 JST (04/01/2013 02:44:54 UTC)
for those not familiar with the GMaps system, just click on an icon and a pop up tag comes up with the data on it. Click elsewhere on the map to make the tag go away.
You can also click on the items on the list in the left hand column and the tags popup too, they are newest at the top descending to the oldest at the bottom.
here is what it looks like screenshot
those black lines are the tectonic plate boundries
When I'm on NIED gathering the reviewed data I often download this latest data just to see whats happened recently, its easy enough to run the data through the mapping system I use.
I usually do this once a day if I can.
Anyone interested
If so I'll put the link to the interactive map on here each day.
I won't do a screenshot every time, too much work.
I didn't want to clutter up Quake Watch with a load of maps or links or interfere with some of the Japan Threads/Topics on ATS, but there must be
some others out there who regularly follow Japans tremendous earthquake output.
Did you know there are on average 200 per 24 hour period?
.
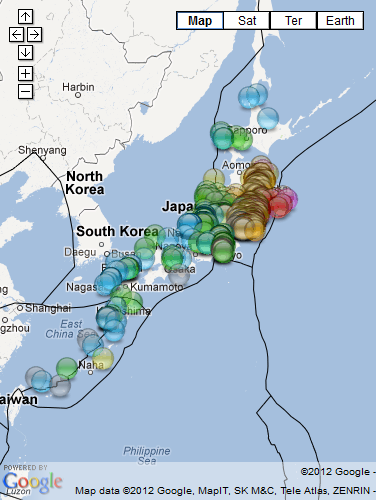
here are a couple of other maps I have in my ATS library that I used to show something happening using the maps I do, just as examples of what you might see here on this Topic.
this one is the day of the mag 9 Tohoku earthquake on March 11, 2011, mag1+
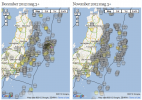
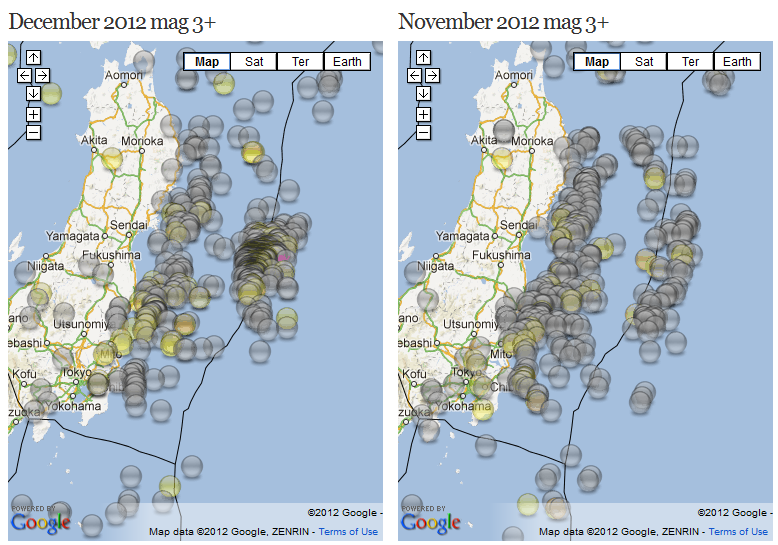
this one is comparing two months worth of quakes above mag3
(click it, its a thumbnail)
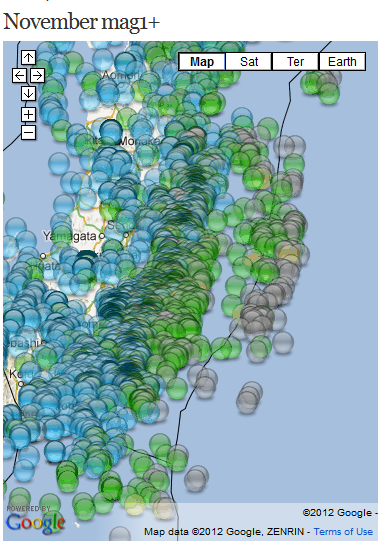
and this one is a whole month of mag1+ quakes together, centered east off Honshu
Did you know there are on average 200 per 24 hour period?
.
here are a couple of other maps I have in my ATS library that I used to show something happening using the maps I do, just as examples of what you might see here on this Topic.
this one is the day of the mag 9 Tohoku earthquake on March 11, 2011, mag1+
this one is comparing two months worth of quakes above mag3
(click it, its a thumbnail)
and this one is a whole month of mag1+ quakes together, centered east off Honshu
reply to post by muzzy
Thats freakin awesome. That one map is so cluttered with quakes you can't see the contours of the country.
This is an older one that gives a visual of quakes surrounding the 2011 Quake.
Thats freakin awesome. That one map is so cluttered with quakes you can't see the contours of the country.
This is an older one that gives a visual of quakes surrounding the 2011 Quake.
That last image, of the one month of quakes, is pretty ridiculous.
I gave you a s&f. I don't know if I would check your map daily, but I might check it out once a week if you decide to continue. Thanks for putting this together.
I gave you a s&f. I don't know if I would check your map daily, but I might check it out once a week if you decide to continue. Thanks for putting this together.
Great, I'll try and do it on a regular enough basis so that it all makes sense.
I started doing this after I had an operation and was unable to move about and at a loose end for 2 months, then it became so addictive I couldn't stop.
Initially I was just following New Zealand earthquakes, and that all started when I found out that the Geonet page I had been watching was only showing "Felt" quakes, when I found their database and was shocked to find there were around 50 quakes per day. (now with an automated sytem its up to 75 per day and thats without a big quake with aftershocks)
Same thing happened with Japan, the regular JMA page only shows a few quakes a day, when I found NIED, which is a feeder for JMA, I couldn't believe the number of quakes they were having, and that was before the March 2011 quake.
To get the data from NIED you have to sign up and register, which I did.
The NIED data comes as lines of text, what you do with it is up to the reader, I decided to map the data.
This is how it comes in raw form.
(this is a thumbnail, click it)
Its a matter of processing that using Excel spreadsheets into a format that a map making program can read.
You can read some of the other stuff I have processed and published on Wordpress through the links in my signature.
There may be times when I'm too busy with life to do it every day, that is why I don't post these Japan Preliminary maps on Wordpress, as I miss a few downloads and once time moves on the preliminary data is gone and you can't get it anymore..
The files that make the maps are stored on Dropbox, so as long as that keeps running all the links to the interactive maps should stay operative.
reply to post by intrptr
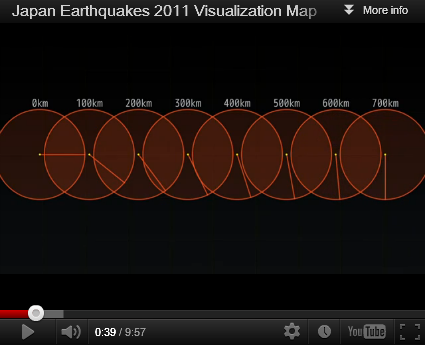
Yeah I have seen that before, awesome work that EQWatcher has done.
I like the icons he/she has made with the depth shown as a clock hand type line on them, that is clever.
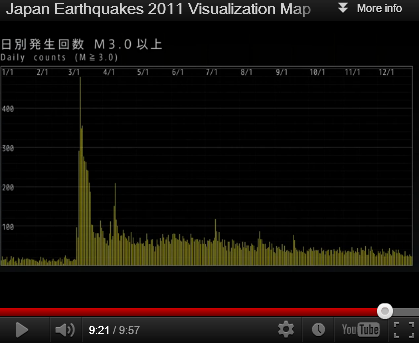
and the graphs are good too, this one shows how the number of mag 3+ quakes kept going for the rest of the year, diminishing over time as they should, but still thats a lot of earthquakes.
I've done something similar, but by the month (just Dec 2012 so far), here for the reviewed data
I like this vid he did too
www.youtube.com...
it shows the dots one at a time, as they happen, can you imagine the work that went into that!?!?, 19,000+ individual screenshots, unless he has a program that does it automatically?.
Yeah I have seen that before, awesome work that EQWatcher has done.
I like the icons he/she has made with the depth shown as a clock hand type line on them, that is clever.
and the graphs are good too, this one shows how the number of mag 3+ quakes kept going for the rest of the year, diminishing over time as they should, but still thats a lot of earthquakes.
I've done something similar, but by the month (just Dec 2012 so far), here for the reviewed data
I like this vid he did too
www.youtube.com...
it shows the dots one at a time, as they happen, can you imagine the work that went into that!?!?, 19,000+ individual screenshots, unless he has a program that does it automatically?.
to get a bit of a progression on this, and because its the weekend here already, and I woke early, here is the latest download mapped, from about 1.5
hours ago
03/01/2013 00:13:47 JST to 04/01/2013 22:57:35 JST
(02/01/2013 15:13:47 UTC) to (04/01/2013 13:57:35 UTC)
mag
03/01/2013 00:13:47 JST to 04/01/2013 22:57:35 JST
(02/01/2013 15:13:47 UTC) to (04/01/2013 13:57:35 UTC)
mag
reply to post by muzzy
If I was to interpret that activity. I would say that the subduction of the pacific plate off Japan's Eastern coast is progressing smoothly now. Maybe the "blockage" has been removed and now it is slipping "smoothly".
Little...fits...and starts... is better than being stuck. If that activity were to cease suddenly they could go back to holding their breath.
As an aside, I live on the west coast of US and the Loma Prieta quake of '89 was like this. On one morning after the big one, the USGS reported that there was an earthquake that lasted for over an hour. That is steady movement of the earth. I remember feeling that as a slow deep faint rumble under my feet. I was sitting down the whole time. I could feel that.
As long as there a bunch of little ones, everything is "fine".
reply to post by intrptr
yes I think you are right
I've always thought that when things are quiet then that is time to get concerned, not particularly when there are a couple of 3's or 4's over a week near the same spot.
Those bigun's always seem to come out of the blue.
I have seen that trend over and over here in New Zealand, the only problem with keeping an eye on that is that until Sept 2012 our Geo Survey were not publishing all the data coming in, only the reviewed stuff, so it was subject to someone else's influence before us public joes got it.
You could still see it though, when it got down to 1-2 per day from the old normal 10-25, now its when it gets down to 20-25 from the normal 45-75.
A lot of these Japan preliminary events get altered when reviewed, slightly different magnitude, lat/long etc,but generally they are accurate enough to get a picture of what is going on.
If you compare the preliminary maps I'm putting on here with the reviewed maps on the Archives straight away you can see the preliminary locations are more compressed into the main Japanese islands, once reviewed the outlying areas such as the Kuril Is, Ryukyu Is and Taiwan stuff gets added in.
Interesting about those SF area rumbles.
A few years back we had some swarms of minor quakes on our East Coast (subduction area) and about a year later the NZGeoSurvey came out with a report that our western side of the island had risen something like 20mm, not much but hey ............ tectonics in action.
Its hard to pin down which quake may have released that build up of pressure, maybe that 6.4mb/7.1ML we had in July last year Sometimes these things take a while.
reply to post by muzzy
After the quake in Indonesia whole shelfs of coral reef off shore of some of the islands had risen out of the water. Most impressive. I wonder about that constant movement under Japan. Is it pushing the land steadily upward? From what I understand, the whole chain of Islands there and elsewhere are a result of "push up" from subduction.
I wouldn't know where to find that kind of info, just thought about it when you mentioned the land rise in your area.
Edit: You know what else comes to mind... your study shows that the subduction of the Pacific plat continues under Japan at an "enormous" rate. I wonder what the balance of shifting elsewhere around the ring of fire will be as a result of all the movement? If there is a gap produced by the plate moving so much under Japan, where will it shift on the other side of the Pacific?
Do you have this link?
Live Earthquake map
A few years back we had some swarms of minor quakes on our East Coast (subduction area) and about a year later the NZGeoSurvey came out with a report that our western side of the island had risen something like 20mm, not much but hey ............ tectonics in action.
After the quake in Indonesia whole shelfs of coral reef off shore of some of the islands had risen out of the water. Most impressive. I wonder about that constant movement under Japan. Is it pushing the land steadily upward? From what I understand, the whole chain of Islands there and elsewhere are a result of "push up" from subduction.
I wouldn't know where to find that kind of info, just thought about it when you mentioned the land rise in your area.
Edit: You know what else comes to mind... your study shows that the subduction of the Pacific plat continues under Japan at an "enormous" rate. I wonder what the balance of shifting elsewhere around the ring of fire will be as a result of all the movement? If there is a gap produced by the plate moving so much under Japan, where will it shift on the other side of the Pacific?
Do you have this link?
Live Earthquake map
edit on 4-1-2013 by intrptr because: additional...
reply to post by intrptr
from the text I did for the 9.0;
i can't recall where I got that, it might have been off the USGS pdf Poster on it.
It didn't say about rise or fall or I would have put that in too, but I suspect that the islands are rising. Although I did read somewhere just after the 9.0 that the Russians or the Chinese were offering free land for the Japanese to move to if Japan sank
The problem I have understanding how tectonic subduction works is the spreading has to come from some point, and you would think it would be in the middle of the Pacific somewhere (Hawaii?, Tahiti? East Pacific Rise?). This last year I have been watching the Pacific-Antarctic Ridge closely as it is always possible the source of all this expansion is there at the bottom of the Earth, as Antarctica does not have any subduction going on, so its either stable or expanding.
However I haven't been able to see any tangible evidence that a big quake in say the Balleny Islands or over on the other side at the Sandwich island has ever led directly to a big quake in other parts of the Pacific or Atlantic. The interest in that came from the 2004 Sumatra 9.0, there was a mag 8 quake down Balleny Island just before..
I tend to think Antarctica has a lot to do with it though, after all New Zealand and Australia used to be attached to it millions of years ago, before being cast adrift.
yes I have seen that link.
I have this one on my Speed Dial board, same idea, but has Geofon (Germany) as well as a feed, and its only earthquakes
www.oe-files.de...
from the text I did for the 9.0;
4 metres ~ distance Honshu (and perhaps the whole of Japan) moved east
20 metres ~ the distance the Pacific Plate moved west
i can't recall where I got that, it might have been off the USGS pdf Poster on it.
It didn't say about rise or fall or I would have put that in too, but I suspect that the islands are rising. Although I did read somewhere just after the 9.0 that the Russians or the Chinese were offering free land for the Japanese to move to if Japan sank
The problem I have understanding how tectonic subduction works is the spreading has to come from some point, and you would think it would be in the middle of the Pacific somewhere (Hawaii?, Tahiti? East Pacific Rise?). This last year I have been watching the Pacific-Antarctic Ridge closely as it is always possible the source of all this expansion is there at the bottom of the Earth, as Antarctica does not have any subduction going on, so its either stable or expanding.
However I haven't been able to see any tangible evidence that a big quake in say the Balleny Islands or over on the other side at the Sandwich island has ever led directly to a big quake in other parts of the Pacific or Atlantic. The interest in that came from the 2004 Sumatra 9.0, there was a mag 8 quake down Balleny Island just before..
I tend to think Antarctica has a lot to do with it though, after all New Zealand and Australia used to be attached to it millions of years ago, before being cast adrift.
yes I have seen that link.
I have this one on my Speed Dial board, same idea, but has Geofon (Germany) as well as a feed, and its only earthquakes
www.oe-files.de...
edit on 4-1-2013 by muzzy because: (no reason given)
reply to post by muzzy
Heres an example of "tectonics" that pretty closely resembles what I think is going on under the crust of the earth. The up welling or convection currents of the earths mantle carry the cooler crust or plates along on the "currents".
The boundaries or edges of those plates are where the most activity occurs ("rings" of fire?).
04/01/2013 11:51:52JST to 05/01/2013 16:23:30 JST
(4/01/2013 2:51UTC to 5/01/2013 7:23:30 UTC)
I should have taken that from the end of the last one, and started it at 5/01/2013 00:00:00 .
(4/01/2013 2:51UTC to 5/01/2013 7:23:30 UTC)
edit on 5-1-2013 by muzzy because: (no reason given)
I should have taken that from the end of the last one, and started it at 5/01/2013 00:00:00 .
edit on 5-1-2013 by muzzy because: (no reason given)
05/01/2013 16:49:59JST to 06/01/2013 11:57:59JST
(05/01/2013 07:49:59UTC to 06/01/2013 02:57:59UTC)
downloaded that about an hour ago, and just had another look now, there have been another 9 since then.
(05/01/2013 07:49:59UTC to 06/01/2013 02:57:59UTC)
downloaded that about an hour ago, and just had another look now, there have been another 9 since then.
edit on 5-1-2013 by muzzy because: (no
reason given)
another thing I could do with that data is filter it down to mag 3+
2013/05/01 18:08 to 2013/06/01 11:32 JST
JST, MAG, WHERE
6/01/2013 11:32, 4.3, Near East Coast Of Honshu. Japan
6/01/2013 6:30, 3.2, Near East Coast Of Honshu. Japan
6/01/2013 5:46, 4.6, Off East Coast Of Honshu. Japan
6/01/2013 1:47, 4.3, Near East Coast Of Honshu. Japan
6/01/2013 1:02, 3.3, Eastern Sea Of Japan
5/01/2013 23:07, 3.6, Hokkaido. Japan Region
5/01/2013 22:32, 3.0, Off East Coast Of Honshu. Japan
5/01/2013 21:38, 3.0, Near East Coast Of Honshu. Japan
5/01/2013 20:16, 3.3, Southeast Of Honshu. Japan
5/01/2013 18:08, 3.1, Western Honshu. Japan
5/01/2013 18:08, 3.2, Eastern Honshu. Japan
now see how it matches with the JMA official web site
www.jma.go.jp...
JST, MAG, WHERE
11:32 JST 06 Jan 2013, M4.5, Chiba-ken Toho-oki
07:04 JST 06 Jan 2013, M4.5, Hokkaido Toho-oki
01:47 JST 06 Jan 2013, M4.0, Miyagi-ken Oki
13:12 JST 05 Jan 2013, M5.0, Amami-oshima Hokusei-oki
09:50 JST 05 Jan 2013, M4.1, Wakayama-ken Hokubu
hmmm
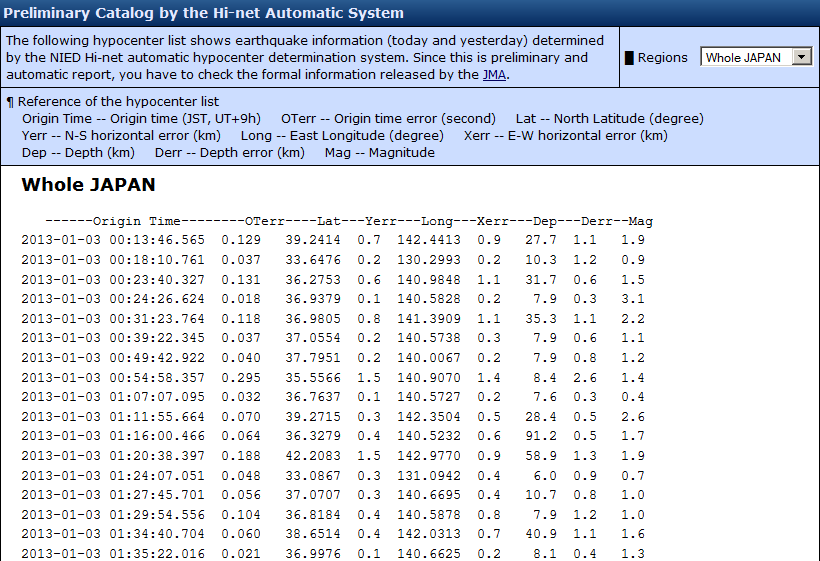
I did this before when I first signed up with NIED, to see how worthwhile the preliminary data was.
On this list from 3rd Jan 2013 UTC (but dates are shown in JST) You can see quite a few quakes are added within the 3 day "review" window.
In the image below, the red highlighted ones didn't show on the reviewed list, so either they went down below 3 once reviewed or were errors. The green highlighted ones on the right match up with those on the preliminary list of the left.
So unless you live there in Japan and have felt a quake and want to know where it was, or are following a particular area over a longer period, the preliminary data isn't really much use.
I'll keep doing it, because I find the JMA pages even more useless for recent info, they seem to be quite selective on what they put on there.
There may be better sites I haven't found yet, but if they are pure Japanese text I'll never find them.
edit on 6-1-2013 by muzzy because: (no reason given)
oops I missed a download yesterday, router burnt out, had to get a new one, no internet for 7 hours
here is the latest;
interesting that they didn't catch the Taiwan 5.5
07/01/2013 00:06:29JST to 08/01/2013 01:44:15JST
(06/01/2013 15:06:29UTC to 07/01/2013 16:44:15UTC)
here is the latest;
interesting that they didn't catch the Taiwan 5.5
07/01/2013 00:06:29JST to 08/01/2013 01:44:15JST
(06/01/2013 15:06:29UTC to 07/01/2013 16:44:15UTC)
since the last one;
08/01/2013 01:44:15JST (07/01/2013 16:44:15UTC)
to
09/01/2013 02:23:28JST (08/01/2013 17:23:28UTC)
centered on the largest quake in the period, offshore Kuji, Honshu
08/01/2013 01:44:15JST (07/01/2013 16:44:15UTC)
to
09/01/2013 02:23:28JST (08/01/2013 17:23:28UTC)
centered on the largest quake in the period, offshore Kuji, Honshu
Lat/Long: 40.1214 142.4636
UTC: 08/01/2013 07:51:30
JST: 08/01/2013 16:51:30
Depth: 28.8
Mag: 5.7 ML
Location: Near East Coast Of Honshu. Japan
Status: Preliminary
Source: NIED Hi-net
edit on 8-1-2013 by muzzy because: (no reason given)
shorter period map this time , only 9 hours, 19 minutes since the last one
09/01/2013 02:23:28JST (08/01/2013 17:23:28UTC)
to
09/01/2013 11:42:29JST (09/01/2013 02:42:29UTC)
the first quake in the data was the largest and at 3.6 pretty small
I wonder if things are tightening up again there?
not a heck of a lot going on along the Honshu coast, maybe that 5.7 off Kuji was a shift in stress to the north
new topics
-
BIDEN Admin Begins Planning For January 2025 Transition to a New President - Today is 4.26.2024.
2024 Elections: 2 hours ago -
Big Storms
Fragile Earth: 3 hours ago -
Where should Trump hold his next rally
2024 Elections: 6 hours ago -
Shocking Number of Voters are Open to Committing Election Fraud
US Political Madness: 7 hours ago -
Gov Kristi Noem Shot and Killed "Less Than Worthless Dog" and a 'Smelly Goat
2024 Elections: 8 hours ago -
Falkville Robot-Man
Aliens and UFOs: 8 hours ago -
James O’Keefe: I have evidence that exposes the CIA, and it’s on camera.
Whistle Blowers and Leaked Documents: 9 hours ago -
Australian PM says the quiet part out loud - "free speech is a threat to democratic dicourse"...?!
New World Order: 9 hours ago -
Ireland VS Globalists
Social Issues and Civil Unrest: 10 hours ago -
Biden "Happy To Debate Trump"
2024 Elections: 10 hours ago
top topics
-
James O’Keefe: I have evidence that exposes the CIA, and it’s on camera.
Whistle Blowers and Leaked Documents: 9 hours ago, 17 flags -
Australian PM says the quiet part out loud - "free speech is a threat to democratic dicourse"...?!
New World Order: 9 hours ago, 15 flags -
Blast from the past: ATS Review Podcast, 2006: With All Three Amigos
Member PODcasts: 13 hours ago, 13 flags -
Biden "Happy To Debate Trump"
2024 Elections: 10 hours ago, 13 flags -
Ireland VS Globalists
Social Issues and Civil Unrest: 10 hours ago, 9 flags -
Mike Pinder The Moody Blues R.I.P.
Music: 13 hours ago, 8 flags -
Shocking Number of Voters are Open to Committing Election Fraud
US Political Madness: 7 hours ago, 6 flags -
BIDEN Admin Begins Planning For January 2025 Transition to a New President - Today is 4.26.2024.
2024 Elections: 2 hours ago, 6 flags -
What is the white pill?
Philosophy and Metaphysics: 12 hours ago, 6 flags -
RAAF airbase in Roswell, New Mexico is on fire
Aliens and UFOs: 11 hours ago, 5 flags
active topics
-
Biden "Happy To Debate Trump"
2024 Elections • 51 • : rickymouse -
Gov Kristi Noem Shot and Killed "Less Than Worthless Dog" and a 'Smelly Goat
2024 Elections • 57 • : rickymouse -
BIDEN Admin Begins Planning For January 2025 Transition to a New President - Today is 4.26.2024.
2024 Elections • 13 • : WeMustCare -
Big Storms
Fragile Earth • 14 • : charlest2 -
What is the white pill?
Philosophy and Metaphysics • 21 • : Albone -
Hate makes for strange bedfellows
US Political Madness • 53 • : 19Bones79 -
RAAF airbase in Roswell, New Mexico is on fire
Aliens and UFOs • 11 • : Ophiuchus1 -
SETI chief says US has no evidence for alien technology. 'And we never have'
Aliens and UFOs • 79 • : SchrodingersRat -
Gold and silver prices....woo hoo
History • 88 • : SchrodingersRat -
University of Texas Instantly Shuts Down Anti Israel Protests
Education and Media • 314 • : Schmoe3755