It looks like you're using an Ad Blocker.
Please white-list or disable AboveTopSecret.com in your ad-blocking tool.
Thank you.
Some features of ATS will be disabled while you continue to use an ad-blocker.

Japan Preliminary Earthquake Maps NIED
page: 3share:
(click on image for interactive map)
Lat/Long: 44.4592 141.0677
UTC: 22/01/2013 13:29:22
JST: 22/01/2013 22:29:22
Depth: 258 km
Mag: 5.8 ML
Location: Hokkaido. Japan Region
Status: Preliminary
Source: NIED Hi-net
However ..............................
JMA only have 4.9
www.jma.go.jp...
(click image for interactive map)
Largest event
Lat/Long: 37.7751 141.6449
UTC: 23/01/2013 21:31:07
JST: 24/01/2013 06:31:07
Depth: 43 km
Mag: 5.1 ML
Location: Near East Coast Of Honshu. Japan
Status: Preliminary
Summary
mag
Think the maps all look the same? think again
I made a little animation of the last 10 days maps
(click on image above for animation, opens in new tab/window)
I made a loop but it went too fast and you couldn't see when it started or finished, now it is just one run through, so let it run through then when it finishes if you want to see it again just click on the image here on this page for another run. (That is on Firefox)
If you have Internet Explorer you can just click "refresh" and it will play again
On Chrome click "reload page" and it will run through again.
I made a little animation of the last 10 days maps

(click on image above for animation, opens in new tab/window)
I made a loop but it went too fast and you couldn't see when it started or finished, now it is just one run through, so let it run through then when it finishes if you want to see it again just click on the image here on this page for another run. (That is on Firefox)
If you have Internet Explorer you can just click "refresh" and it will play again
On Chrome click "reload page" and it will run through again.
edit on 24-1-2013 by muzzy because: (no reason given)
(click image for interactive map)
Largest event
Lat/Long: 39.4831 143.5668
UTC: 24/01/2013 04:52:21
JST: 24/01/2013 13:52:21
Depth: 2 km
Mag: 3.9 ML
Location: Off East Coast Of Honshu. Japan
Status: Preliminary
Summary
mag
Something seems to have gone wrong with NIED
The following map is from data downloaded 12 hours ago and covers a period of 11 hours.
Just went in for an update now (!2 hours later) and the data is the same.
[color=lime](click image for interactive map, opens in new tab/window)
Largest event
Lat/Long: 41.5665 141.0922
UTC: 25/01/2013 08:27:43
JST: 25/01/2013 17:27:43
Depth: 115.4 km
Mag: [color=grey]3.5 ML
Location: Hokkaido. Japan Region
Status: Preliminary
Summary
mag
Well sorry about this folks, but I seemed to have missed a whole 24 hrs, from 25/01/2013 16:11:29 through to 26/01/2013 15:03:14.
I usually download the data anytime between 3pm and 9pm and have always caught the end of the last day.
Went out last night, after the problem with the data yesterday, and never checked again until 5:30pm NZST today.
[color=lime](click image for interactive map, opens in new tab/window)
Largest event;
Lat/Long: 36.5852 140.5685
UTC: 27/01/2013 18:41:49
JST: 28/01/2013 03:41:49
Depth: 75.1 km
Mag: 5.3 ML
Location: W of Hitachi, Near East Coast Of Honshu. Japan
Status: Preliminary
summary
mag
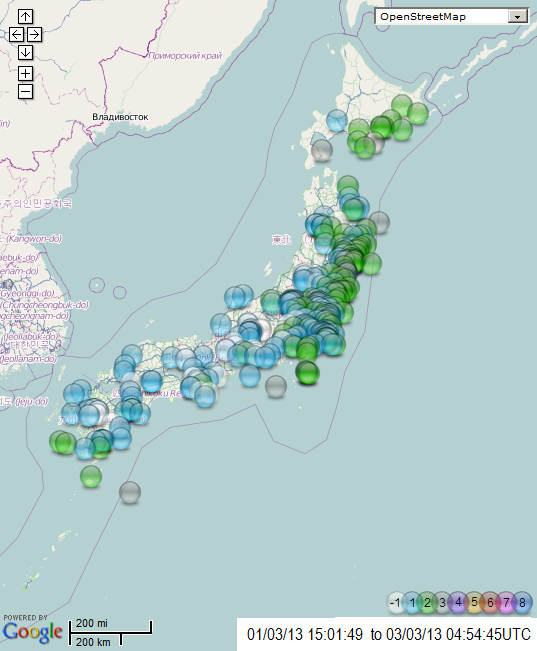
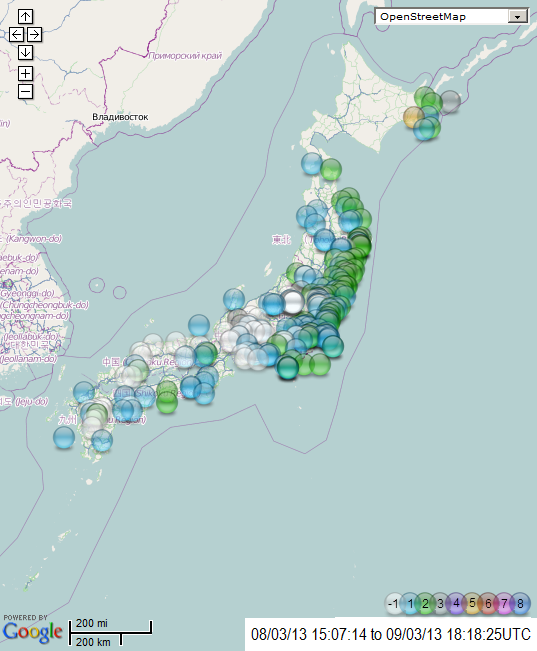
[color=lime](click image for interactive map, opens in new tab/window)
summary
mag
[color=lime](click image for interactive map, opens in new tab/window)
summary
mag
Yo, I'm back
That 6.9 at Tokachi, Hokkaido on Feb 2nd distracted me and I was busy saving the preliminary data of the aftershocks, when I thought "this is a waste of time, as in 3 days that data will be reviewed and made redundant".
Well it has been an entertaining exercise anyway, I learned how to put an image on ATS that links to a map, if nothing else.
You would have to be pretty keen to bother cross checking the preliminary with the reviewed data, I did a couple of times and there were quite a lot of changes.
So what to do now?
How about a summary of the reviewed data
here are a couple of graphs I put on my Japan Blog based on the data for January 2013
click for larger image
here is an interactive map of all the quakes above mag 1 recorded by NIED and reviewed for January 2013
summary
mag1= 3409, mag2= 1906, mag3= 577
mag4= 94, mag5= 23, mag6= 0, mag7= 0
total= 6009
total energy released= 33,198.28 TTNT
edit on 15-2-2013 by muzzy because: (no reason given)
on that January 2013 data,
when I had the data gathered I (it comes in batches of 7 days as text by selection, and thats the max.) there were
11,248 entries
726 events 0 or below 0, ie negative magnitudes
4,187 events below 1.0
31 lines removed which had times, but no lat/long or depth, called "FAR FIELD"
then 295 more with lat/long and depth but no magnitude
leaving 10,922 lines with magnitudes above -1.0
so I guess we are still safe working under the same "Japan Preliminary Earthquake Maps NIED" title as before
32 events were converted to Mw.
I gave this page as a reference of my work to get permission to get the data off NIED, so how about some comments!
Otherwise they will think no one really gives a toss and cancel my registration.
Its due for a new password end of March
deep one offshore Western Honshu 4.8ML on this map
[color=lime](click image for interactive map, opens in new tab/window)
19/02/13 15:02:02 to 21/02/13 01:17:35UTC
summary
mag
Otherwise they will think no one really gives a toss and cancel my registration.
Its due for a new password end of March
deep one offshore Western Honshu 4.8ML on this map
[color=lime](click image for interactive map, opens in new tab/window)
19/02/13 15:02:02 to 21/02/13 01:17:35UTC
summary
mag
[color=lime](click image for interactive map, opens in new tab/window)
summary
mag
[color=lime](click image for interactive map, opens in new tab/window)
summary
mag
[color=lime](click image for interactive map, opens in new tab/window)
summary
mag
Lat/Long: 34.4243 134.8298
UTC: 12/04/2013 20:33:18
JST: 13/04/2013 05:33:18
Main shock
Depth: 15km
Mag: 6.3 ML, 5.7Mw (Aqua)
Location: Awaji Island, Osaka Bay, Near S. Coast Of Western Honshu, Japan
Status: Preliminary
Energy Released: 42,501.898 tonnes of TNT
interactive aftershocks map
[color=lime](click image for interactive map, opens in new tab/window)
status at 5:11 hours after the main shock
mag6= 1
mag5= 0
mag4= 1
mag3= 5
mag2= 26
mag1= 76
total= 109
TTNT= 42,526.867
interactive aftershocks map at 27hrs (click link)
summary
mag1= 154
mag2= 35
mag3= 10
mag4= 1
mag5= 0
mag6= 1
mag7= 0
total= 201
TTNT= 42,535.065
summary
mag1= 154
mag2= 35
mag3= 10
mag4= 1
mag5= 0
mag6= 1
mag7= 0
total= 201
TTNT= 42,535.065
I missed half a day on Awaji aftershocks, so back to the whole of Japan, Mag 1+ only
[color=lime](click image for interactive map, opens in new tab/window)
summary
mag1= 135
mag2= 70
mag3= 7
mag4= 1
mag5= 0
mag6= 0
mag7= 0
total= 213
TTNT= 37.74549354
[color=lime](click image for interactive map, opens in new tab/window)
summary
mag1= 135
mag2= 70
mag3= 7
mag4= 1
mag5= 0
mag6= 0
mag7= 0
total= 213
TTNT= 37.74549354
edit on 15-4-2013 by muzzy because: (no reason given)
new topics
-
Any one suspicious of fever promotions events, card only.
The Gray Area: 7 minutes ago -
God's Righteousness is Greater than Our Wrath
Religion, Faith, And Theology: 4 hours ago -
Electrical tricks for saving money
Education and Media: 7 hours ago -
VP's Secret Service agent brawls with other agents at Andrews
Mainstream News: 9 hours ago -
Sunak spinning the sickness figures
Other Current Events: 9 hours ago -
Nearly 70% Of Americans Want Talks To End War In Ukraine
Political Issues: 9 hours ago -
Late Night with the Devil - a really good unusual modern horror film.
Movies: 11 hours ago
top topics
-
VP's Secret Service agent brawls with other agents at Andrews
Mainstream News: 9 hours ago, 9 flags -
Cats Used as Live Bait to Train Ferocious Pitbulls in Illegal NYC Dogfighting
Social Issues and Civil Unrest: 13 hours ago, 8 flags -
Electrical tricks for saving money
Education and Media: 7 hours ago, 4 flags -
HORRIBLE !! Russian Soldier Drinking Own Urine To Survive In Battle
World War Three: 17 hours ago, 3 flags -
Sunak spinning the sickness figures
Other Current Events: 9 hours ago, 3 flags -
Nearly 70% Of Americans Want Talks To End War In Ukraine
Political Issues: 9 hours ago, 3 flags -
Late Night with the Devil - a really good unusual modern horror film.
Movies: 11 hours ago, 2 flags -
The Good News According to Jesus - Episode 1
Religion, Faith, And Theology: 14 hours ago, 1 flags -
God's Righteousness is Greater than Our Wrath
Religion, Faith, And Theology: 4 hours ago, 0 flags -
Any one suspicious of fever promotions events, card only.
The Gray Area: 7 minutes ago, 0 flags
active topics
-
SETI chief says US has no evidence for alien technology. 'And we never have'
Aliens and UFOs • 47 • : andy06shake -
Any one suspicious of fever promotions events, card only.
The Gray Area • 0 • : Cavemannick -
God's Righteousness is Greater than Our Wrath
Religion, Faith, And Theology • 1 • : andy06shake -
Sunak spinning the sickness figures
Other Current Events • 7 • : xWorldxGonexMadx -
HORRIBLE !! Russian Soldier Drinking Own Urine To Survive In Battle
World War Three • 33 • : Degradation33 -
How ageing is" immune deficiency"
Medical Issues & Conspiracies • 34 • : angelchemuel -
Nearly 70% Of Americans Want Talks To End War In Ukraine
Political Issues • 13 • : Freeborn -
Mood Music Part VI
Music • 3101 • : ThatSmellsStrange -
VP's Secret Service agent brawls with other agents at Andrews
Mainstream News • 41 • : ThatSmellsStrange -
New whistleblower Jason Sands speaks on Twitter Spaces last night.
Aliens and UFOs • 55 • : baablacksheep1