It looks like you're using an Ad Blocker.
Please white-list or disable AboveTopSecret.com in your ad-blocking tool.
Thank you.
Some features of ATS will be disabled while you continue to use an ad-blocker.

1880 IS getting colder!
page: 9share:
reply to post by NoHierarchy
No I am not wrong.
Something you should understand about the 1970s. We knew nothing of America. Your all pervasive rubbish on TV had not really wormed it's way into society. We got a small taste of the deluge of ignorant rubbish of sitcoms etc that was to follow through the films that were available but for the most part we were ignorant of America. (Would that it had stayed that way)
In the United Kingdom it definitely was stated that there was an impending ice age and the terminology was would be not could be.
You cannot say I am wrong because I lived there and heard that. All your video does is avoids what was actually said and preaches the gospel according to some American scientists of whom at the time the average person in the street in the UK and Europe had no knowledge. Your video does not change the facts, but it is interesting to see that AGW was being spoken about so early on.
edit on 21/11/2012 by PuterMan because: (no reason given)
reply to post by NoHierarchy
I believe I am correct in stating that the reply was directed to me. If you were replying to points by other people than you should have clarified that in your text.
Well I grant you that used to be the case now I am not so sure.
You are absolutely correct I did not read the first article in it's entirety. I did however read the second article in it's entirety which is a link to NASA and not to the Examiner which is the first link. This does not say much for your accuracy in reporting!
I never stated that it proved my point. If I had thought that it proved my point that you have blessed me with, remembering that in the OP I simply asked if the figures were right, I would have said so. Perhaps you would be so kind as to refrain from attributing things to me that I have not said? I would appreciate that.
Did you ever stop and think that maybe I was referring to those who replied to this thread too?
I believe I am correct in stating that the reply was directed to me. If you were replying to points by other people than you should have clarified that in your text.
Welllll, if you think about it... the word "dogma" is pretty much the opposite of "peer-reviewed science".
Well I grant you that used to be the case now I am not so sure.
You failed to actually read the entire first article. It doesn't prove your point.
Your second article is a link to the Examiner, nuff said.
You are absolutely correct I did not read the first article in it's entirety. I did however read the second article in it's entirety which is a link to NASA and not to the Examiner which is the first link. This does not say much for your accuracy in reporting!
I never stated that it proved my point. If I had thought that it proved my point that you have blessed me with, remembering that in the OP I simply asked if the figures were right, I would have said so. Perhaps you would be so kind as to refrain from attributing things to me that I have not said? I would appreciate that.
edit on 21/11/2012 by PuterMan because: (no reason given)
reply to post by MrInquisitive
Before saying anything else I would like to point out to all other posters/readers that this is an exercise in statistics. Read and inwardly digest before making comments.
Just to refer back initially to the relevant section of your comment:
Unfortunately, no offense intended, taking percentages of means and eye-balling graphs does not always work out as intended!
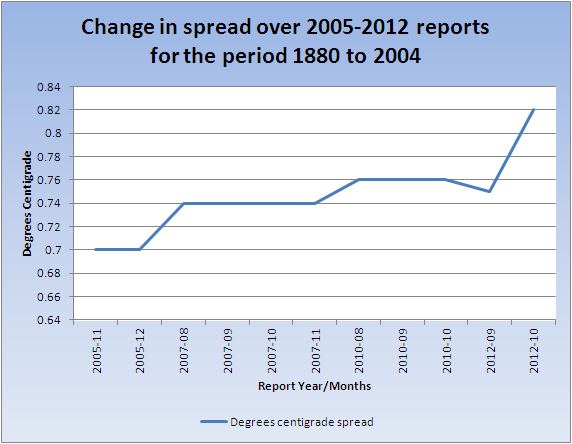
If we convert the means back from anomalies to temperatures, using the 14°C base as the text files indicate (14+(anomaly/100) then we get a change in spread over the period of reports from 2005-11 to 2010-12, for the years 1880 to 2004 because that is the latest data on the 2005 report, of 0.7°C to 0.82°C. The spread in the 2012 report is 0.85°C
As to whether the increase, irrespective of which figure you take, is significant is concerned that is not the matter under discussion here.
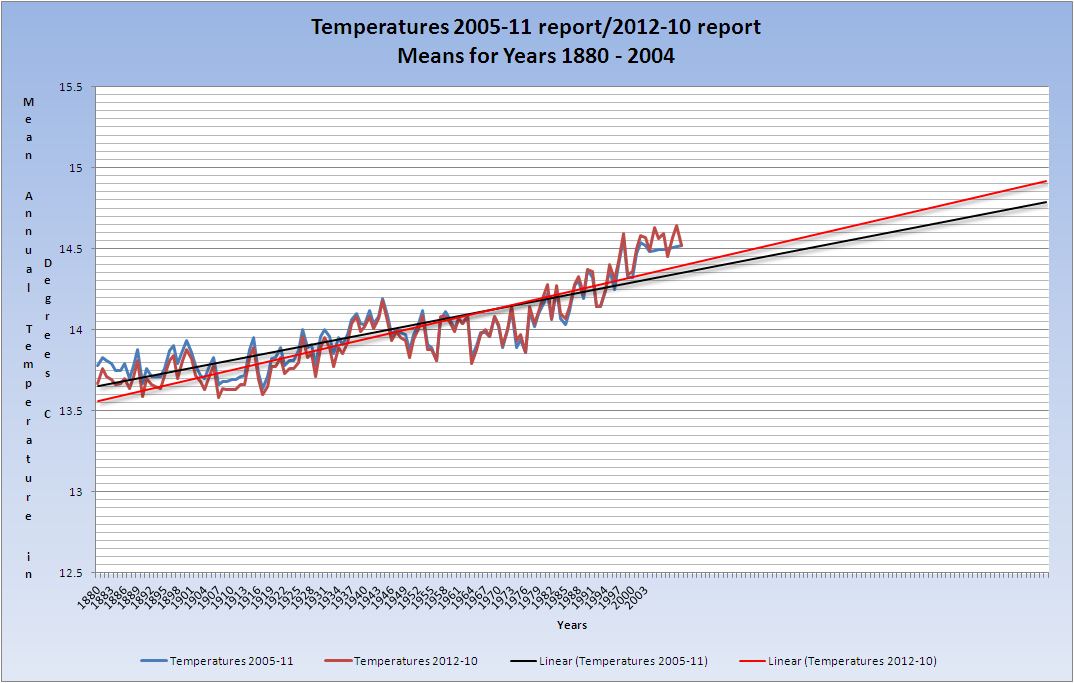
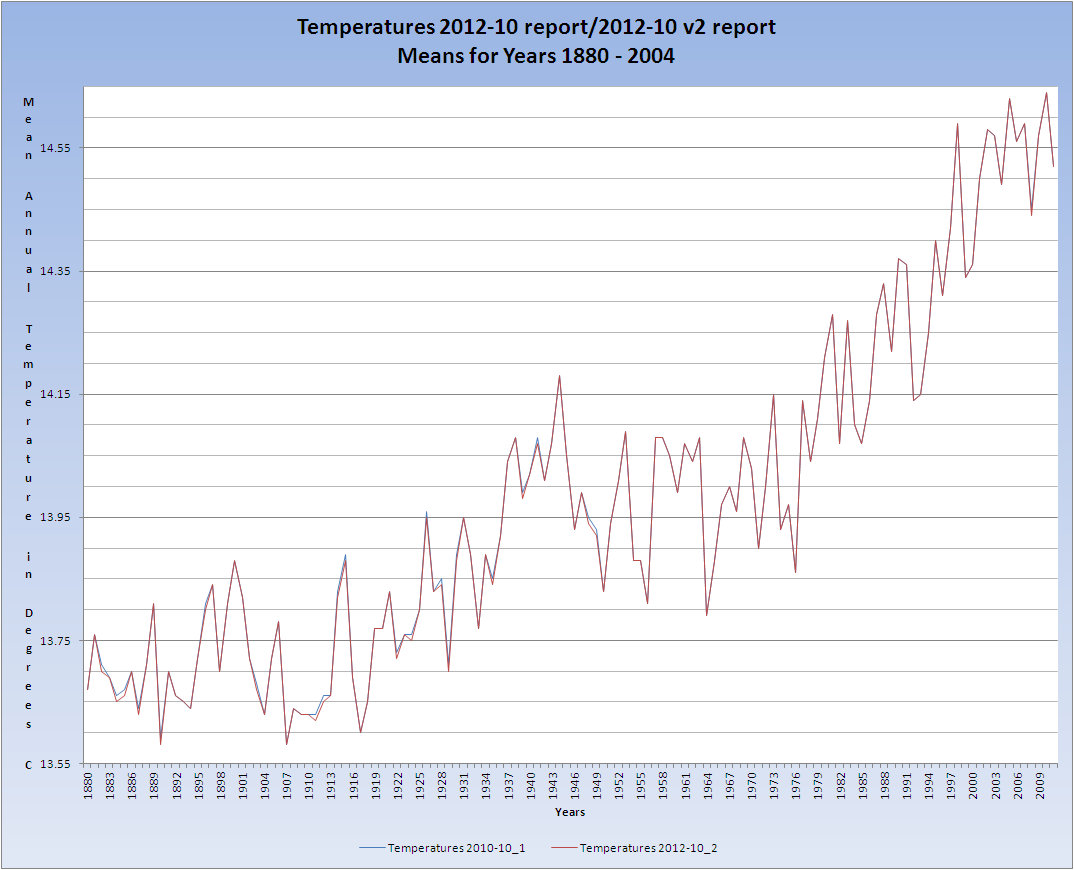
The question is what in fact does this change do to the trends? Basically it makes the trend steeper. Here is a graph with just the first and last report for clarity, with trendlines added.
Note that I have only used the data up to 2004 so that it relates to the change in spread.
Interestingly if I project the 2005-11 figures forward by 0.005645161°C per annum (0.7/124) the 2012 point is a conjunction. Back to the trends however. Extrapolating the trendline for a further 82 years leads to a slightly greater divergence, however we are only talking of >0.1 of a degree C

In fact the difference between the trendline spreads is ~13.65 to ~14.8 on the 2005 figures and ~13.55 to ~14.9 on the 2012 figures.
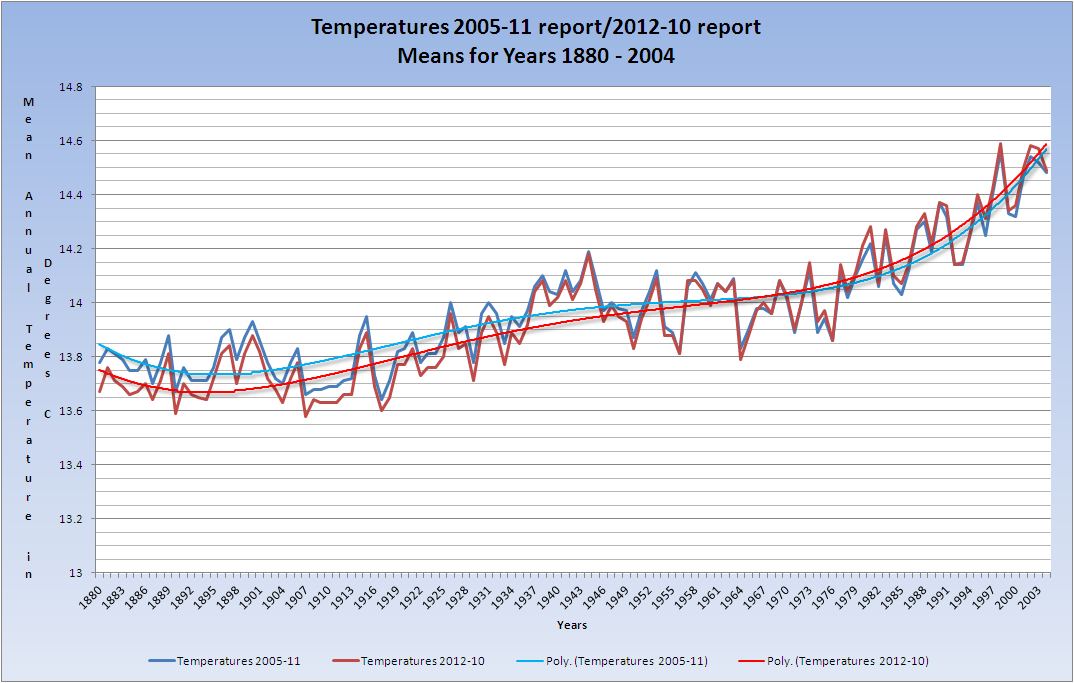
The amendments to the figures (for whatever reason) have created a change in the trendline causing it to steepen, and forward extrapolation of that obviously indicates a heightened temperature. Personally I find linear trendlines are not useful, at least as far as earthquakes are concerned, as they do not reflect the best fit in the same manner as a polynomial trend.
Here we see a crossover and then a convergence. Unfortunately polynomial trends do not extrapolate sensibly.
So yes there is an upward trend, but if you are expecting me to comment on that I am afraid you are out of luck, other than to say that you should bear in mind that in earth's history we are in some of the coolest times. Just because this may have an effect on humans does not mean that it is a dire situation. The planet changes all the time. Sea levels have been higher and sea levels have been lower. Temperatures have been higher and lower and CO2 has been higher and only very slightly lower and is still at one of the lowest levels we can extrapolate.
Before anyone misinterprets what I am saying I am not proposing that we do nothing on the grounds that change is inevitable. We should care for our planet, our only home(so far) in the Universe and if we can mitigate the human element of ANY levels of substances that may act as pollutants and that therefore affect the world then we should do so. At least by that token we can then say, if the levels of CO2 for example keep rising, that it is not us and is a natural course of the planet's cycles.
If the figures have been changed to suit an agenda however that is wrong, and the creation of taxation or trading on CO2 as a means of preventing emissions is bound for failure simply because the tax/trading will cease if the CO2 falls and that is not what those in power want. Tax has to be based at such a level that we continue to pollute or produce and continue to pay. THAT is what is wrong with the AGW argument for taxation and it is THAT part which is the scam. If the figures have been manipulated to foster the continuance of the scam that is an act of treason against the sovereign peoples of this world in my humble opinion.
I'm still waiting for you to comment on the fact that the overall trend in the mean global temperature conservatively has still risen 0.78 C (this takes out the 0.12 deg systematic bias that you claim to be in the updated dataset).
Before saying anything else I would like to point out to all other posters/readers that this is an exercise in statistics. Read and inwardly digest before making comments.
Just to refer back initially to the relevant section of your comment:
In any case, the lack of a response on your part to my point, which is that this database systematic bias is less than 7% of the signal that suggests a 0.9 deg C. average gloabl temperature change over 132 years, is conspicuous in its absence. Even taking the worst case systematic bias, i.e. -0.06 deg C for early data and +0.06 for later data, there is still then a 0.78 deg C change over this period, which is still a significant increase, albeit not as big as the one assuming the updated changes in the datasets are warranted, i.e. approximately a 0.9 deg C change -- or so I eyeball it from your middle graph.
Unfortunately, no offense intended, taking percentages of means and eye-balling graphs does not always work out as intended!
If we convert the means back from anomalies to temperatures, using the 14°C base as the text files indicate (14+(anomaly/100) then we get a change in spread over the period of reports from 2005-11 to 2010-12, for the years 1880 to 2004 because that is the latest data on the 2005 report, of 0.7°C to 0.82°C. The spread in the 2012 report is 0.85°C
As to whether the increase, irrespective of which figure you take, is significant is concerned that is not the matter under discussion here.
The question is what in fact does this change do to the trends? Basically it makes the trend steeper. Here is a graph with just the first and last report for clarity, with trendlines added.
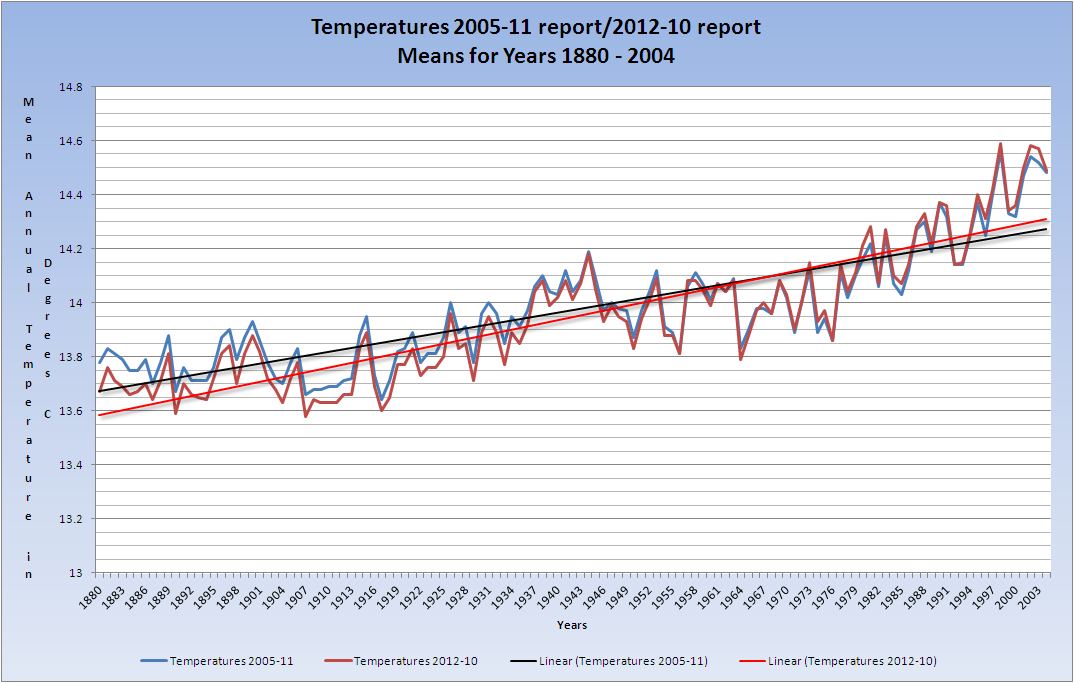
Note that I have only used the data up to 2004 so that it relates to the change in spread.
Interestingly if I project the 2005-11 figures forward by 0.005645161°C per annum (0.7/124) the 2012 point is a conjunction. Back to the trends however. Extrapolating the trendline for a further 82 years leads to a slightly greater divergence, however we are only talking of >0.1 of a degree C
In fact the difference between the trendline spreads is ~13.65 to ~14.8 on the 2005 figures and ~13.55 to ~14.9 on the 2012 figures.
The amendments to the figures (for whatever reason) have created a change in the trendline causing it to steepen, and forward extrapolation of that obviously indicates a heightened temperature. Personally I find linear trendlines are not useful, at least as far as earthquakes are concerned, as they do not reflect the best fit in the same manner as a polynomial trend.
Here we see a crossover and then a convergence. Unfortunately polynomial trends do not extrapolate sensibly.
So yes there is an upward trend, but if you are expecting me to comment on that I am afraid you are out of luck, other than to say that you should bear in mind that in earth's history we are in some of the coolest times. Just because this may have an effect on humans does not mean that it is a dire situation. The planet changes all the time. Sea levels have been higher and sea levels have been lower. Temperatures have been higher and lower and CO2 has been higher and only very slightly lower and is still at one of the lowest levels we can extrapolate.
Before anyone misinterprets what I am saying I am not proposing that we do nothing on the grounds that change is inevitable. We should care for our planet, our only home(so far) in the Universe and if we can mitigate the human element of ANY levels of substances that may act as pollutants and that therefore affect the world then we should do so. At least by that token we can then say, if the levels of CO2 for example keep rising, that it is not us and is a natural course of the planet's cycles.
If the figures have been changed to suit an agenda however that is wrong, and the creation of taxation or trading on CO2 as a means of preventing emissions is bound for failure simply because the tax/trading will cease if the CO2 falls and that is not what those in power want. Tax has to be based at such a level that we continue to pollute or produce and continue to pay. THAT is what is wrong with the AGW argument for taxation and it is THAT part which is the scam. If the figures have been manipulated to foster the continuance of the scam that is an act of treason against the sovereign peoples of this world in my humble opinion.
edit on 21/11/2012 by PuterMan because: to add a bit of clarity.
reply to post by PuterMan
Thanks for the extended answer to the question I put before you a second or third time -- and a very reasonable answer, I may add. Reading more of your posts in this thread, I have come to realize that you don't seem to dispute global warming, but that you are suspicious scientists trying to "pad" the data to make a better case for it. That's a reasonable concern too. However, from what I can tell, you are being willfully obtuse about the station coverage argument and corrections to old, pre-satellite-observation data. That will be my last word on this aspect of the matter; feel free to get another volley in yourself, if you wish.
I did want to respond to another of your posts, the one in which you addressed my point about using the most recent data to one's argument, which was a response to your comment to me about keeping up to date on matters. My point was that you were citing a NASA report from 2006 and then a blog from 2009 that was commenting on the same report. My point was that a more recent source would be much more compelling as well as give the most up-to-date skinny on the subject. I admit, I don't know if newer reports on whether the upper ocean temperatures are cooling or warming or remaining near constant have been published, hence I didn't cite anything. I'm guessing that was your point about a later post mooting my point.
One related point to this possible cooling of the earth: there may be increased CO-2 related issues having to do with possible temperature increases/decreases in the ocean. I'm no low-temp aqueous geochemist -- or much of a chemist of any sort, anymore -- so I don't know what effect this would have exactly. I do believe that putting a gas into a solution is generally an exothermic reaction (that is why hot soda under pressure tends to fizz more than chilled soda), but then there are equilibrium levels and Le Chatlier's principle, all of which just confuse me anymore. So, like I say, I'm not sure which way (cooling/warming) this effect would play out.
Okay, so 9 pages later and I still haven't seen anyone explain the frequency and volume of historical data changes...
Has anyone here actually looked at the available source papers from gistemp ? I'm talking about each and every single one from each and every single month that they replace the previous month's with at this site.
You will see that these data sets are getting updated on a monthly basis as they plug the new current month's numbers in so the old reports are no longer there and are apparently not made available via archives of any kind either.
You can also download PM’s excel spreadsheet here:
Looking at the spreadsheet/workbook, you can see that he was only able to recover 11 archived reports: 2005-Nov, 2005-Dec, 2007-Aug, 2007-Sep, 2007-Oct, 2007-Nov, 2010-Aug, 2010-Sep, 2010-Oct, 2012-Aug, 2012-Sep. Any and all other missing months going all the way back to when they first started publishing these monthly reports have completely disappeared into the abyss and are unrecoverable for whatever reason. So just going by 11 months worth, the historical numbers have been changed each and every time. Which, statistically speaking, tells me that they are very likely changing on a monthly basis, month after month, year after year just by going off the one's that PM does have.
GHCN and Reynolds newer versions of their programs can only explain some of the changes, but still does not come anywhere near to explaining the hundreds of changes that have actually occurred to the already so-called "homogenized" "re-calibrated" "tweaked" "twiddled" data for, say 1880.
Can anybody explain why old data needs to be "tweaked" on a monthly basis over a period of a gawd knows how many years ?! How many times do these climatologists need to "revise" historical data to account for "newer technological precision in measurements" ?!
Anyone ?
Bueller ?
Bueller ?
This is the summary of the main point that PM is trying to get to. A few changes here and there can easily be explained, but on a monthly basis for years on end ?
Thus far, I've only seen posters logically explain away a few of those changes... but definitely not all, or even anywhere near the volume of changes that we're talking about here.
Come on people, there is no logical explanation for that many changes (if these constant changes are “legitimate” in their purpose for having to be done) !
I don't care if the numbers represent anomalies, or mean anomalies, or temperatures, or mean temperatures, or whatever... this data should not be changing as much as it does.
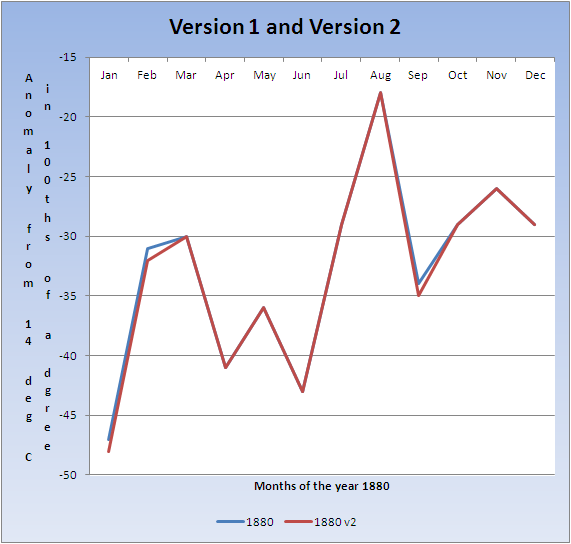
Oh, and by the way… just for a good laugh… if you now go to the gistemp site and look at the numbers for 1880, they’ve already changed again ! A day or two ago the data for 1880 for January and February has changed from being -47 and -31 to now being -48 and -32 !! Hell, I haven’t even bothered to look at all the other numbers, just those first two caught my eye to jump out and scream “What the hell?”. All I did was have a quick glance at that report again today before typing out this post…
Holy ripped nylons, Batman… what the hell are these people doing ?!
Has anyone here actually looked at the available source papers from gistemp ? I'm talking about each and every single one from each and every single month that they replace the previous month's with at this site.
You will see that these data sets are getting updated on a monthly basis as they plug the new current month's numbers in so the old reports are no longer there and are apparently not made available via archives of any kind either.
You can also download PM’s excel spreadsheet here:
Looking at the spreadsheet/workbook, you can see that he was only able to recover 11 archived reports: 2005-Nov, 2005-Dec, 2007-Aug, 2007-Sep, 2007-Oct, 2007-Nov, 2010-Aug, 2010-Sep, 2010-Oct, 2012-Aug, 2012-Sep. Any and all other missing months going all the way back to when they first started publishing these monthly reports have completely disappeared into the abyss and are unrecoverable for whatever reason. So just going by 11 months worth, the historical numbers have been changed each and every time. Which, statistically speaking, tells me that they are very likely changing on a monthly basis, month after month, year after year just by going off the one's that PM does have.
GHCN and Reynolds newer versions of their programs can only explain some of the changes, but still does not come anywhere near to explaining the hundreds of changes that have actually occurred to the already so-called "homogenized" "re-calibrated" "tweaked" "twiddled" data for, say 1880.
Can anybody explain why old data needs to be "tweaked" on a monthly basis over a period of a gawd knows how many years ?! How many times do these climatologists need to "revise" historical data to account for "newer technological precision in measurements" ?!
Anyone ?
Bueller ?
Bueller ?
This is the summary of the main point that PM is trying to get to. A few changes here and there can easily be explained, but on a monthly basis for years on end ?
Thus far, I've only seen posters logically explain away a few of those changes... but definitely not all, or even anywhere near the volume of changes that we're talking about here.
Come on people, there is no logical explanation for that many changes (if these constant changes are “legitimate” in their purpose for having to be done) !
I don't care if the numbers represent anomalies, or mean anomalies, or temperatures, or mean temperatures, or whatever... this data should not be changing as much as it does.
Oh, and by the way… just for a good laugh… if you now go to the gistemp site and look at the numbers for 1880, they’ve already changed again ! A day or two ago the data for 1880 for January and February has changed from being -47 and -31 to now being -48 and -32 !! Hell, I haven’t even bothered to look at all the other numbers, just those first two caught my eye to jump out and scream “What the hell?”. All I did was have a quick glance at that report again today before typing out this post…
Holy ripped nylons, Batman… what the hell are these people doing ?!
Originally posted by PuterMan
In the United Kingdom it definitely was stated that there was an impending ice age and the terminology was would be not could be.
No it wasn't.
However, there was a BBC documentary based on Nigel Calder's book "The Weather Machine" which popularised the idea that a new ice age was imminent and would occur very quickly. Ironically, his book also pointed out that most climate scientists thought that increasing carbon emissions woud prevent this new ice age occurring.
(I have the book, btw)
More recently, Calder wrote the book "The Chilling Stars" based on Svensmark's hypothesis about an imminent ice age ....
That said, it was generally believed at the time that the current interglacial was coming to an end and that a new 'ice age' would start very soon - within the next few thousand years. Since then we have studied the Milankovitch Cycles further and now realise that this will not happen. Although axial tilt is declining, so that we expect N Hemisphere temps to drop - as, indeed had been happening for the past 4,000 years - it would not be enougth to precipitate a new ice age, irrespective of any human activities.
Of course, N Hemisphere, especially Arctic, temps are not declining at the moment and indeed we see ice melt (on and and at sea) now greater than any time since at least before the MWP. So we're about as far from a new ice age as it's possible to be given current continental configuration.
edit on 21-11-2012 by AndyMayhew because: (no reason given)
reply to post by CranialSponge
I THINK the answer to your question is that the numbers in these datasets are calculated in a more complicated manner than most here in this thread can envision. I am not being pedantic in saying this. For starters, look at this link regarding temperature anomalies, which is the data being discussed here:
temperature anomalies
At this site there are many links to reports on the details of what is being done to create this data set of anomalies. And yes, the devil is in the details, and they seem to be very complicated. First off, it is not just raw temperature data; just read some of this documentation to see that this is the case. One of the things I found discussed what accounting for land-use at a particular data site, which is something I brought up as a possibility in one of my posts and which was roundly criticized and pooh-poohed by puterman, the OP.
Remember, this is about temperature anomalies, and not just average temperatures, or even the deviation from some baseline of average temperatures. And frankly, it looks to complicated and time consuming for myself to bother to get to the bottom of it. For instance, the documentation talks about a 30-year baseline, i.e. the 1951-1980 period, but in the same sentence it says something to the effect of doing a century-long calculation; in fact, at the top of the page of the link I provide, it does say the anomalies are based on deviations from the 1901-2000 average. From what I can infer, there is both spacial and temporal filtering, which might, for all I know, involve some sort of moving averaging, and I could see how this would slightly change numbers with each succeeding month added to the data set, and thereby the final temp. anomaly values will change throughout the data set. I'm not asserting that this is the case, rather only suggesting that this is entirely possible.
Reading through some of the other documentation, mention is made of accounting for sparse data, particularly for going back to 1854, when the data set begins. So yes, there is a lot of modeling involved and not just raw temperature readings used.
I think the bottom line is that the construction of this data set is much more involved than most people in this thread can imagine, and that then such persons are misinterpreting what exactly these numbers mean. The fact that the values for a particular year and month change very slightly each month certainly suggests that it is a dynamic data set that is effected by adding to the temperature time series and revising parameterizations for the spacial components of the model, i.e. for land-use changes, amongst other things potentially. Thinking that these anomalies are absolute and permanent values would seem to be an oversimplification of the matter.
I realize this won't be a satisfactory answer for some, but the only way to get to the bottom of the matter is to either wade through all the documentation -- which, to me, would be a daunting task -- or contact the keeper of the data set and ask politely, i.e. not with a conspiratorial/accusing tone , of why the entire dataset of global temperature anomalies changes each month.
edit on 21-11-2012 by MrInquisitive because: (no reason given)
reply to post by MrInquisitive
I understand what you're saying regarding the dynamic data set and how every time you plug in a new number everything changes across the board... But that's where my contention comes in.
It's seems to me then that we are not really getting any solid information with regards to true historical data in order to determine where we are now and why, because all these people are doing is producing modelled what-if scenarios with trend lines (past and present) thinking that they're making the correct necessary adjustments in order to "unify" the new with the old.
So then comes the question, "What is a trend line exactly and who/what is determining it, thus defining what the "anomalies" are?"
And quite frankly, who gives a damn about anomalies ? What can anomalies tell us if they're constantly changing dependent on the data being plugged in ? All it tells me is that we've got these over-convoluted computer programs that are determining their own bloody trend line and then calculating the anomalies from that. aka Circular reasoning.
Should we not just be looking at temps then and now (base raw data) and noting the changes therein ? Or is that just too "simplified" to justify the millions upon millions of dollars granted out in research funds.
IMHO, this science has overcomplicated itself to the point that they've lost focus on the simple, but crucial information sitting right under their noses.
reply to post by AndyMayhew
I don't know how old you are Mr Mayhew but I was there and I remember it, so unless you were also around and of an age to comprehend such things in the 1970's we shall have to agree to differ whatever the agenda now attempts to say.
No it wasn't.
I don't know how old you are Mr Mayhew but I was there and I remember it, so unless you were also around and of an age to comprehend such things in the 1970's we shall have to agree to differ whatever the agenda now attempts to say.
reply to post by AndyMayhew
Here is a link to a news article (dated 1974)
news.google.com...,4007344&dq=Experiment&hl=en
On the linked this page, towards the end of the 2nd paragraph, we have this:
You probably have heard of the University of East Anglia.
Here is a link to a news article (dated 1974)
news.google.com...,4007344&dq=Experiment&hl=en
On the linked this page, towards the end of the 2nd paragraph, we have this:
The decline of prevailing temperatures since about 1945 appears to be the longest-continued downward trend since temperature records began. says Professor Hubert H Lamb of the University of East Anglia in Great Britain.
You probably have heard of the University of East Anglia.
Originally posted by MrInquisitive
reply to post by CranialSponge
One of the things I found discussed what accounting for land-use at a particular data site, which is something I brought up as a possibility in one of my posts and which was roundly criticized and pooh-poohed by puterman, the OP.
Not really pooh-poohed other than to point out that you cannot go changing the data for the earlier years every time the modern data changes
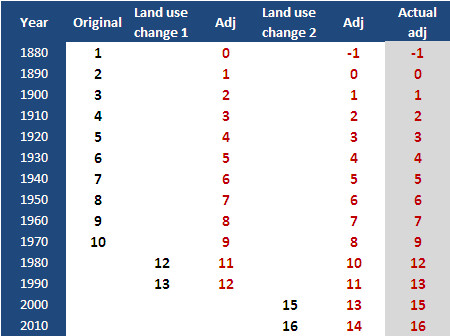
Allow me to try an explain what I am saying. This is a VERY oversimplified example of what appears to be happening.
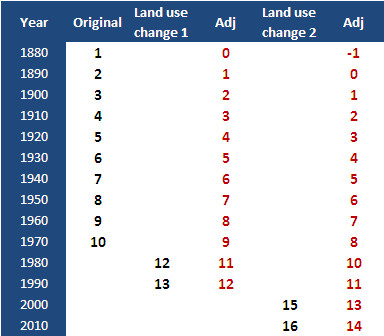
The first adjustment takes -1 of all the figures, except that if should only take it from the years with changed land use. The next two year -2 is the adjustment, but this should only be taken where the further land use change occurs. You cannot apply -2 right back to the start because the land use was NOT changed for the first 110 years.
To be honest what it feels like is happening is this where the modern temperatures are not adjusted down but remain as they are, but the earlier ones are adjusted. Sort of like this.
Remember, this is about temperature anomalies, and not just average temperatures, or even the deviation from some baseline of average temperatures. And frankly, it looks to complicated and time consuming for myself to bother to get to the bottom of it.
Well perhaps you should. It is very simple. The years 1951 to 1980 are the base years. If you convert the anomalies for those years back to temperatures as I described, and then the the average of those years you will find that for each of those years the average temperature is 14°C (The are minute variations + or - but on the whole it is 14 degrees. This is what they say at the top of the text file.
For instance, the documentation talks about a 30-year baseline, i.e. the 1951-1980 period, but in the same sentence it says something to the effect of doing a century-long calculation; in fact, at the top of the page of the link I provide, it does say the anomalies are based on deviations from the 1901-2000 average.
The text is this:
Average temperature anomalies are also available for land and ocean surfaces separately, and the Northern and Southern Hemispheres separately. The global and hemispheric anomalies are provided with respect to the period 1901-2000, the 20th century average.
This means that the other sets - global and hemispheric - are using the 1901 to 2000 century average and the LOT data (the data we are looking at) is based on the World Meteorological Organization (WMO) Policy which they sate as 1981 to 2010 but which they say in the text file of the data is 1951 to 1980 so which is the truth? Certainly if you do the exercise above it appears to agree with the text in the data file and not with that on the site.
Reading through some of the other documentation, mention is made of accounting for sparse data, particularly for going back to 1854, when the data set begins. So yes, there is a lot of modeling involved and not just raw temperature readings used.
Yes indeed, data is filled in where it is missing for the earlier years and this is done in exactly the same manner as described in the document. We can leave aside the argument about how this affects the means. The point is that there is no good reason as I see it to change the data for the earlier years once it has been calculated.
I think the bottom line is that the construction of this data set is much more involved than most people in this thread can imagine, and that then such persons are misinterpreting what exactly these numbers mean.
It it not particularly complex. I do not believe we are misinterpreting what the figures mean. A temperature anomaly is a temperature anomaly. That cannot be misinterpreted.
The fact that the values for a particular year and month change very slightly each month certainly suggests that it is a dynamic data set that is effected by adding to the temperature time series and revising parameterizations for the spacial components of the model, i.e. for land-use changes, amongst other things potentially. Thinking that these anomalies are absolute and permanent values would seem to be an oversimplification of the matter.
Continued due to the ridiculous limitations imposed.
edit on 23/11/2012 by PuterMan because: to fix a tag
Continuation.......
Go back to my original oversimplified example at the top of the post. You just cannot do that. You can make a change to the model that affects all of the data, as with a change from Version 2 to Version 3. I accept that BUT I cannot accept changes to the earlier data after the recalibration on a version change. Neither can I comprehend why this trend is ALWAYS downward for pre 1951 data and upward for post 1980 data.
I would also point out that on the site the documentation states:
Perhaps that should say:
"The dataset is updated every month. Data for a month are typically made available by the 15th of the following month. For the rest of the month we will change it and because the data is not archived you will not notice that we have changed it downwards again even after only 6 days."
Thanks to CranialSponge for spotting that. I shall be archiving this file daily from now on.
The changes are subtle but even between those two versions which are 6 days apart, what I stated holds true. Values before 1951 are reduced and after 1980 are (sometimes) increased.
Does that not strike even you as a bit odd?
If wading through the documentation is what has to be done then it will be done. I am not prepared to just say they must have their reasons. I want to know what their reasons are.
If you seriously think you would get an honest answer to such a question then you must be very naive, and I really don't think you are.
Go back to my original oversimplified example at the top of the post. You just cannot do that. You can make a change to the model that affects all of the data, as with a change from Version 2 to Version 3. I accept that BUT I cannot accept changes to the earlier data after the recalibration on a version change. Neither can I comprehend why this trend is ALWAYS downward for pre 1951 data and upward for post 1980 data.
I would also point out that on the site the documentation states:
The dataset is updated every month. Data for a month are typically made available by the 15th of the following month.
Perhaps that should say:
"The dataset is updated every month. Data for a month are typically made available by the 15th of the following month. For the rest of the month we will change it and because the data is not archived you will not notice that we have changed it downwards again even after only 6 days."
Thanks to CranialSponge for spotting that. I shall be archiving this file daily from now on.
The changes are subtle but even between those two versions which are 6 days apart, what I stated holds true. Values before 1951 are reduced and after 1980 are (sometimes) increased.
Does that not strike even you as a bit odd?
I realize this won't be a satisfactory answer for some, but the only way to get to the bottom of the matter is to either wade through all the documentation -- which, to me, would be a daunting task -- or contact the keeper of the data set and ask politely, i.e. not with a conspiratorial/accusing tone , of why the entire dataset of global temperature anomalies changes each month.
If wading through the documentation is what has to be done then it will be done. I am not prepared to just say they must have their reasons. I want to know what their reasons are.
If you seriously think you would get an honest answer to such a question then you must be very naive, and I really don't think you are.
edit on 23/11/2012 by PuterMan because: (no reason given)
Wow, PM...
If you're going to start keeping track of the datasets on a daily basis, that's going to be a lot of data entry to be plugging into worksheets. I hope your fingers have the stamina to keep it up !
Maybe that's what these "scientists" are trying to do though:
"If you can't dazzle them with your brilliance, baffle them with your bull#@$&."
reply to post by CranialSponge
You might be amazed at just how much data from various different sources I download each day! Obviously earthquakes from various sources, Icelandic quake maps, several sets of satellite pics for weather, weather maps from the British Met Office, Ionospheric TEC maps every 5 minutes and an Australian hourly one, other TEC data (3 sets every 10 minutes), KP data, sunspot data, Jet-stream data maps, daily seismograms from all the Cascade volcanoes to mention a few of them (there are more) so what's a few temperatures? No problemo!
I shall automate the download and assessment. I am a programmer and I don't believe in doing anything if the computer can do it for me!
By the way I have added that new sheet to the spreadsheet.
edit on 23/11/2012 by PuterMan because: (no reason given)
reply to post by PuterMan
Ah, muchos gracias...
I just had a quick look at your new spreadsheet and noticed that not all of the figures have changed throughout the months for each year (I did a quick @sum for worksheets 2005-10 & 2005-10_2 for each Jan-Dec row). Which tells me that the "dynamic data set" theory is right out the window then.
If their program(s) where "dynamic" then wouldn't each and every number change, rather than just various ones here and there ? Smells more like cherry picking to me.
Just my thoughts.
Ok, first, don't yell at me if someone already posted this.
As soon as I started reading this, I was intrigued but, obviously it's natural (in this unatural obfuscated world) to have doubts. So I went and found the mirror site and found something bizarre.
So, got to this page: /d5rcd5z
(Think Tiny for the link)
You will be presented with the archived copy of the page which contains the elements on the right hand side which can be clicked to bring up the graphs for "Global Annual Mean Surface Air Temperature Change" or "Global Temperature"
While on this page, take a look at the url. It is an archive and, as such, there is a date stamp associated with the file creation time because it's, well, an archive.... Obvious, right?
Ok, please someone check this out before it changes (if it can). Click on either of the 2 graphs mentioned above. Then look at the date stamp and tell me what's wrong.
I just registered....because this is really f**ked.
edit on 23-11-2012 by NoMoreAngerToChangeTheWor because: That non link, fyi, is a 'tiny'
link
ok, in case they change it....here's the (everything after the main archive website's url) url:
URL of Parent page with link to charts:
http.../web/20071221191115/data.giss.nasa.gov/gistemp/graphs/
URL of charts:
http.../web/20121124035955/data.giss.nasa.gov...
http.../web/20121124043941/data.giss.nasa.gov...
Please tell me that the archived charts that was archived in 2007 wasn't just rearchived yesterday
reply to post by NoMoreAngerToChangeTheWor
I would like to look at what you have found, but I am afraid your links are incomprehensible. Welcome to ATS by the way.
Look in my signature and you will see a link to a PDF that will help you format the links so they work. We need the full parent link. Unfortunately http://... just does not cut it
I have just downloaded today's file.
It is identical to yesterdays
I have three files on drop box now
17th November
23rd November
24th November
It is identical to yesterdays
I have three files on drop box now
17th November
23rd November
24th November
reply to post by PuterMan
I'm 46
Which is irrelevant.
Nigel Calder's 'The Weather Machine' was published in 1974 and led to a BBC documentary which popularised the idea of an 'imminent catastrophic ice age'. The book also, to its credit, said that many climate scientists believed CO2 emissions would prevent any new ice age..... Nigel was going off on a limb.
Of course, Nigel's catastrophic ice age never materialised. To my knowledge, Dartmoor is still not under a mile of snow
new topics
-
Australian PM says the quiet part out loud - "free speech is a threat to democratic dicourse"...?!
New World Order: 22 minutes ago -
Ireland VS Globalists
Social Issues and Civil Unrest: 53 minutes ago -
Biden "Happy To Debate Trump"
Mainstream News: 1 hours ago -
RAAF airbase in Roswell, New Mexico is on fire
Aliens and UFOs: 1 hours ago -
What is the white pill?
Philosophy and Metaphysics: 3 hours ago -
Mike Pinder The Moody Blues R.I.P.
Music: 3 hours ago -
Putin, Russia and the Great Architects of the Universe
ATS Skunk Works: 6 hours ago -
A Warning to America: 25 Ways the US is Being Destroyed
New World Order: 11 hours ago
top topics
-
President BIDEN's FBI Raided Donald Trump's Florida Home for OBAMA-NORTH KOREA Documents.
Political Conspiracies: 17 hours ago, 35 flags -
A Warning to America: 25 Ways the US is Being Destroyed
New World Order: 11 hours ago, 20 flags -
Mike Pinder The Moody Blues R.I.P.
Music: 3 hours ago, 7 flags -
What is the white pill?
Philosophy and Metaphysics: 3 hours ago, 5 flags -
Biden "Happy To Debate Trump"
Mainstream News: 1 hours ago, 5 flags -
RAAF airbase in Roswell, New Mexico is on fire
Aliens and UFOs: 1 hours ago, 4 flags -
Putin, Russia and the Great Architects of the Universe
ATS Skunk Works: 6 hours ago, 3 flags -
Australian PM says the quiet part out loud - "free speech is a threat to democratic dicourse"...?!
New World Order: 22 minutes ago, 3 flags -
Ireland VS Globalists
Social Issues and Civil Unrest: 53 minutes ago, 2 flags
active topics
-
President BIDEN's FBI Raided Donald Trump's Florida Home for OBAMA-NORTH KOREA Documents.
Political Conspiracies • 31 • : theatreboy -
Gaza Terrorists Attack US Humanitarian Pier During Construction
Middle East Issues • 81 • : KrustyKrab -
-@TH3WH17ERABB17- -Q- ---TIME TO SHOW THE WORLD--- -Part- --44--
Dissecting Disinformation • 694 • : Thoughtful3 -
University of Texas Instantly Shuts Down Anti Israel Protests
Education and Media • 282 • : Vermilion -
RAAF airbase in Roswell, New Mexico is on fire
Aliens and UFOs • 5 • : pianopraze -
Massachusetts Drag Queen Leads Young Kids in Free Palestine Chant
Social Issues and Civil Unrest • 19 • : LechPolish -
What is the white pill?
Philosophy and Metaphysics • 18 • : AllisVibration -
Starburst galaxy M82 - Webb Vs Hubble
Space Exploration • 9 • : Arbitrageur -
Biden "Happy To Debate Trump"
Mainstream News • 22 • : KrustyKrab -
Putin, Russia and the Great Architects of the Universe
ATS Skunk Works • 23 • : RussianTroll