It looks like you're using an Ad Blocker.
Please white-list or disable AboveTopSecret.com in your ad-blocking tool.
Thank you.
Some features of ATS will be disabled while you continue to use an ad-blocker.

Waters Off Japan Coast Getting Superheated By Unknown Source?
page: 1share:
Please forgive me if this story is already posted. I'm not sure I'm reading this right even. Looks pretty simple. That said, I have never seen water
this warm in the Pacific. The Gulf maybe, but not the Pacific. I would think it would take a geothermal event to heat up that much water at once. Hope
I'm wrong in my interpretation of what I'm looking at but would love to hear from an expert.
Naval Monitoring Site
Naval Monitoring Site
edit on 10-9-2012 by GoldenRuled because: (no reason given)
I wonder if it has anything to do with Mt. Fuji being ready to go? I hope not.
reply to post by GoldenRuled
Wait is this in Celsius or Fahrenheit?
Either way isn't that really, really high in some places?
I'm far from an expert.
Wait is this in Celsius or Fahrenheit?
Either way isn't that really, really high in some places?
I'm far from an expert.
SnF OP from what I see Fukushima related or something below the sea floor is heated and rising. Worst case the EA*RTH above ground SPACE/SEA NAVY is
getting into it with the Mermaides?????
Do you really think that water temps in the Antarctic are either -99c or -99f (either way, lower than any air temp ever recorded on the planet) whilst
those off Japan are boiling? I'm also pretty sure waters in the Mediterranean aren't below freezing at the moment!
That said, I'm not sure off hand what the figure represent.
Just shows the dangers of looking at data you don't understand.
That said, I'm not sure off hand what the figure represent.
Just shows the dangers of looking at data you don't understand.
Even if it is Fahrenheit... a temperature of 100deg Fahrenheit = 38 deg Celsius.
For the ocean, that's quite toasty?
ETA: I don't really understand the map, because the temperature off the coast where I stay is completely off. Maybe someone can help explain the data?
For the ocean, that's quite toasty?
ETA: I don't really understand the map, because the temperature off the coast where I stay is completely off. Maybe someone can help explain the data?
edit on 10-9-2012 by adrift because: (no reason given)
My money is on the radioactive fallout from the nukes that were placed on the sea floor shelf.
Prolly took a lot of nukes to create that tidal wave.
Prolly took a lot of nukes to create that tidal wave.
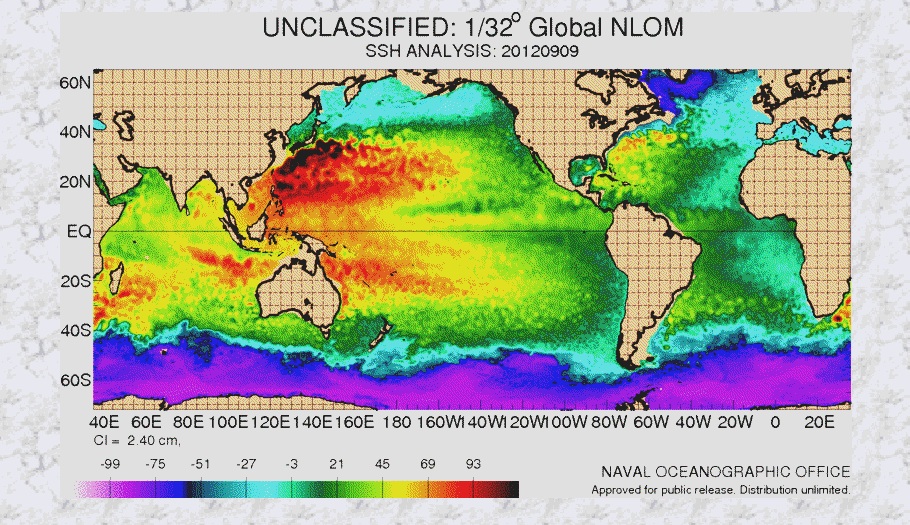
The title on the picture is UNCLASSIFIED: 1/32* Global NLOM....
Does that mean they are showing 1/32nds of degree differences? So +/- 96 degs on the map is really +/- 3 full degrees?
Does that mean they are showing 1/32nds of degree differences? So +/- 96 degs on the map is really +/- 3 full degrees?
edit on 10-9-2012 by
LevelHeaded because: (no reason given)
reply to post by superman2012
If it does have something to do with Mount Fuji, this could be a good thing. If Mount Fuji is finding some pressure release in the ocean and isn't having a large eruption, I could see this as a good thing. Under sea lava flows are generally safer then eruptions on land.
If it does have something to do with Mount Fuji, this could be a good thing. If Mount Fuji is finding some pressure release in the ocean and isn't having a large eruption, I could see this as a good thing. Under sea lava flows are generally safer then eruptions on land.
The following is my opinion as a member participating in this discussion.
I don't think the map is showing actual temperatures. There is a link available on that page (in the "select data type" box) that takes you to one where they show selected regions of the world with temperatures input from buoys (in degrees C) and they don't go anywhere the numbers on the page the OP refers to.
I've dug around a bit but haven't yet located info to explain what NLOM means. All I know is it's the "Navy Layered Ocean Model".
If we can clarify what that means then it'll al become clear. Hopefully!
Mike
As an ATS Staff Member, I will not moderate in threads such as this where I have participated as a member.
Originally posted by JustMike
The following is my opinion as a member participating in this discussion.
I don't think the map is showing actual temperatures. There is a link available on that page (in the "select data type" box) that takes you to one where they show selected regions of the world with temperatures input from buoys (in degrees C) and they don't go anywhere the numbers on the page the OP refers to.
I've dug around a bit but haven't yet located info to explain what NLOM means. All I know is it's the "Navy Layered Ocean Model".
If we can clarify what that means then it'll al become clear. Hopefully!
MikeAs an ATS Staff Member, I will not moderate in threads such as this where I have participated as a member.
I'm really confused, now even more so than before
Current surface temps in the area

I know this does not directly depict the deep ocean temperatures, but surface temps should indicate if the lower levels of the ocean are warming up.
Additionally, if ocean temps were to raise to dramatically as depicted in the image a few posts up i think we would be seeing some significant environemental and weather issues.
edit on 10-9-2012 by MDDoxs because: (no reason given)
Originally posted by LevelHeaded
The title on the picture is UNCLASSIFIED: 1/32* Global NLOM....
Does that mean they are showing 1/32nds of degree differences? So +/- 96 degs on the map is really +/- 3 full degrees?edit on 10-9-2012 by LevelHeaded because: (no reason given)
Aye, I assume it must be something like that. Though I've not come across those charts before. Very obviously not actual water temps!
The following is my opinion as a member participating in this discussion.
Originally posted by TechUnique
Originally posted by JustMike
[snipped as it's right above this post]
I'm really confused, now even more so than before
Being confused is pretty common, but admitting to it is a positive.
...And you ain't alone! I'm also trying to figure this out. Digging further, it seems the NLOM might be modelling oceanic currents at various depths or layers. There's this page at Ocean-Modeling (dot) org that refers to NLOM and several other ocean models.
I tend to think this is a likely answer, because when there are typhoons/hurricanes/cyclones -- which are all the same thing and only named differently based on their region -- there is greater current activity in local areas and Japan, for example tends to get affected by them on its southern coastal regions. And that could fit in with what the map shows. Also, the Mediterreanean is well above freezing, so that map is not showing temperature there: it has rather stable layers and they only change when a large storm goes through and none are present there right now.
The scale shown on the NLOM possibly indicates a relative rate of change in current activity over LTA (long-term average/s) and in that case it would be very useful not only for following surface weather, but eg inputs from rivers into oceans during major floods and the like.
Just my take on it but I'd say what we're seeing off Japan is likely weather related rather than eg tectonic/volcanic based.
Mike
As an ATS Staff Member, I will not moderate in threads such as this where I have participated as a member.
The following is my opinion as a member participating in this discussion.
Originally posted by MDDoxs
[snippy snip] ...if ocean temps were to raise to dramatically as depicted in the image a few posts up i think we would be seeing some significant environemental and weather issues.edit on 10-9-2012 by MDDoxs because: (no reason given)
You are not wrong there! We'd be seeing massive environmental and weather issues. "The Perfect Storm" would probably not even come close to it!
As an ATS Staff Member, I will not moderate in threads such as this where I have participated as a member.
reply to post by GoldenRuled
www.surf-forecast.com...
Seemed to be up-to-date with GOOD EXPLANATIONS ON DATA. And even an eco-friendly explanation as to maybe why.
(p.s. could have anything to do crazy salt deposits from a disrupted flow) if salt in a pot water makes it boil faster... Could the heavy water be acting like a blanket?
Japan does seem to be in a cul de sac of warm currents, naturally. Also there is a difference in 'surface' readings and 'deep sea' readings, ie: under a certain depth the water could well be very cold with minimal change. Yet we still get the 'it's boiling here' scenario on the data....
reply to post by superman2012
That was my first thought also....
That news about Fuji was unnerving.
That was my first thought also....
That news about Fuji was unnerving.
The following is my opinion as a member participating in this discussion.
reply to post by PowerDown
The data doesn't say "it's boiling there". That was just an assumption suggested by the OP but was not given as definitive. If it was boiling or even near it -- and across such a huge area -- we'd be hearing about this all over the place and (as another member pointed out) there'd be major environmental issues as well.
It seems it really is just a model of ocean current layers. There is a temp factor in the model but it looks like it's primarily dealing with water movement. I found an article in the Journal of Atmospheric and Oceanic Technology here on the NLOM that discusses this in some detail and though much of it is very technical it seems to support the idea that it's about currents and their layers. For example, under "Model Description" it says:
One of the major advantages of NLOM over other types of OGCMs such as z-level and sigma-coordinate models is its lower computational cost for the same model domain and horizontal resolution. One reason is that we can use lower vertical resolution to realistically represent the ocean circulation.
So, we don't have to worry that NLOM shows large regions of the oceans at very high temperatures. It just shows how the water is swirling around or moving along in current patterns.
Best regards,
Mike
As an ATS Staff Member, I will not moderate in threads such as this where I have participated as a member.
Sure they know where the core to number four reactor is now dont they?
I mean it was heaped on the concrete floor of the containment vessel building wasnt it?
I mean after breaching containment.....maybe its burnt its way down into the mantle and is going critical?
It may have had a # pile of spent fuel rods mixed with it too......
pretty soon, maybe Edger Cayce will be right.....
Superheated? You do realize that would be considered above boiling right? We could pluck our fish out of the water and eat them already cooked.
But anyway I think this page shows sea surface HEIGHT, as the title of the graph is 'SSH analysis' shown at the top.
But anyway I think this page shows sea surface HEIGHT, as the title of the graph is 'SSH analysis' shown at the top.
new topics
-
BIDEN Admin Begins Planning For January 2025 Transition to a New President - Today is 4.26.2024.
2024 Elections: 1 hours ago -
Big Storms
Fragile Earth: 2 hours ago -
Where should Trump hold his next rally
2024 Elections: 5 hours ago -
Shocking Number of Voters are Open to Committing Election Fraud
US Political Madness: 6 hours ago -
Gov Kristi Noem Shot and Killed "Less Than Worthless Dog" and a 'Smelly Goat
2024 Elections: 7 hours ago -
Falkville Robot-Man
Aliens and UFOs: 7 hours ago -
James O’Keefe: I have evidence that exposes the CIA, and it’s on camera.
Whistle Blowers and Leaked Documents: 8 hours ago -
Australian PM says the quiet part out loud - "free speech is a threat to democratic dicourse"...?!
New World Order: 8 hours ago -
Ireland VS Globalists
Social Issues and Civil Unrest: 9 hours ago -
Biden "Happy To Debate Trump"
2024 Elections: 9 hours ago
top topics
-
James O’Keefe: I have evidence that exposes the CIA, and it’s on camera.
Whistle Blowers and Leaked Documents: 8 hours ago, 14 flags -
Australian PM says the quiet part out loud - "free speech is a threat to democratic dicourse"...?!
New World Order: 8 hours ago, 13 flags -
Blast from the past: ATS Review Podcast, 2006: With All Three Amigos
Member PODcasts: 12 hours ago, 13 flags -
Biden "Happy To Debate Trump"
2024 Elections: 9 hours ago, 12 flags -
Mike Pinder The Moody Blues R.I.P.
Music: 12 hours ago, 8 flags -
What is the white pill?
Philosophy and Metaphysics: 11 hours ago, 6 flags -
Shocking Number of Voters are Open to Committing Election Fraud
US Political Madness: 6 hours ago, 6 flags -
RAAF airbase in Roswell, New Mexico is on fire
Aliens and UFOs: 10 hours ago, 5 flags -
Ireland VS Globalists
Social Issues and Civil Unrest: 9 hours ago, 5 flags -
Where should Trump hold his next rally
2024 Elections: 5 hours ago, 5 flags
active topics
-
Gov Kristi Noem Shot and Killed "Less Than Worthless Dog" and a 'Smelly Goat
2024 Elections • 47 • : cherokeetroy -
BIDEN Admin Begins Planning For January 2025 Transition to a New President - Today is 4.26.2024.
2024 Elections • 8 • : NoCorruptionAllowed -
ALERT - U.S. President JOE BIDEN Examined and Found NOT OF SOUND MIND.
2024 Elections • 65 • : SchrodingersRat -
James O’Keefe: I have evidence that exposes the CIA, and it’s on camera.
Whistle Blowers and Leaked Documents • 13 • : theatreboy -
Where should Trump hold his next rally
2024 Elections • 21 • : Dandandat3 -
RAAF airbase in Roswell, New Mexico is on fire
Aliens and UFOs • 9 • : Degradation33 -
President BIDEN's FBI Raided Donald Trump's Florida Home for OBAMA-NORTH KOREA Documents.
Political Conspiracies • 38 • : SchrodingersRat -
Big Storms
Fragile Earth • 11 • : GENERAL EYES -
Joe Biden and Donald Trump are both traitors
2024 Elections • 65 • : MrMez -
Mood Music Part VI
Music • 3112 • : underpass61