It looks like you're using an Ad Blocker.
Please white-list or disable AboveTopSecret.com in your ad-blocking tool.
Thank you.
Some features of ATS will be disabled while you continue to use an ad-blocker.

Deep Tremors and Big Earthquakes
page: 2share:
This gives an idea of what the mid point tremors might represent.
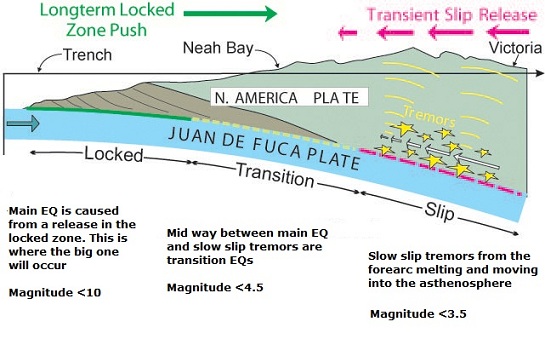
good thing the big one is less than a 10
good thing the big one is less than a 10
edit on 6-2-2012 by zworld because: (no reason given)
reply to post by UdonNiedtuno
I agree with stirling. It's all a matter of degree. In a 9 plus EQ, the difference of still standing is not only the geologic conditions. The areas where liquifaction will occur, or underline with weak soils, will see pretty much absolute destruction. In areas with bedrock underneath, those structures built to withstand a big shake will survive. Those that arent wont. Strap the house or it may not survive is my advice.
I agree with stirling. It's all a matter of degree. In a 9 plus EQ, the difference of still standing is not only the geologic conditions. The areas where liquifaction will occur, or underline with weak soils, will see pretty much absolute destruction. In areas with bedrock underneath, those structures built to withstand a big shake will survive. Those that arent wont. Strap the house or it may not survive is my advice.
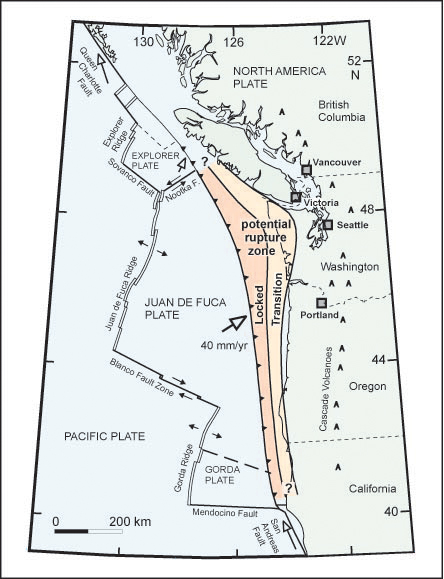
This is from www.nrcan.gc.ca...
The diagram shows where the three types of EQs would occur, and follows the recent pattern.
And the following shows they're looking into it. But I haven't found any research yet that is using the mid way quakes as an element in their research. This could prove to be very interesting once weve crunched what needs to be crunched.
When - Although ETS alone will not help us predict an earthquake at this time, ETS may provide the basis for improved forecasting. Each ETS episode adds a small amount of stress on the locked portion of the subduction zone. This implies that as the stress level increases with each ETS event, one of them could trigger a great earthquake. Therefore, the likelihood of a great earthquake is enhanced during ETS. However, since ETS episodes of various sizes occur at different times all up and down the full length of the Cascadia subduction zone, we cannot yet say which ETS event will be the likely trigger.
Research Continues
Researchers are investigating possible relationships between the many other earthquakes that occur off the subduction fault in both the North America and Juan de Fuca plates, and the location and timing of ETS.
edit on 6-2-2012 by zworld because: (no reason given)
Originally posted by UdonNiedtuno
Originally posted by zworld
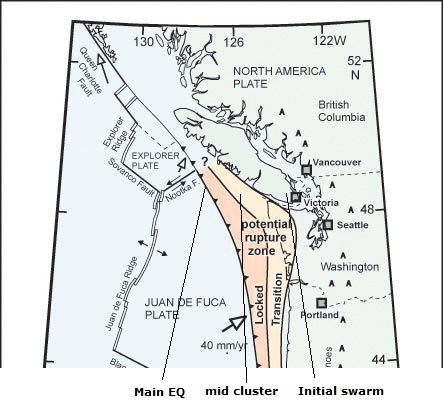
Does the lack of deep tremors in the middle of this zone indicate energy storage?
To clarify, does this image make you think that if a big quake were to hit soon, that it would be centered around Portland? I still haven't strapped my house to the foundation! I suppose I better get on that...
The truth is that no one knows for sure. This is all just speculation. As the deep tremors are watched and studied more and correlations are made, a clearer picture will begin to form, but right now your guess is as good as anyone's.
As for me....I have observed a pattern of yin-yang. A large cluster at one end and than a moderate quake at the other. I've made numerous observatons on my other thread if you really want to take some time and dive into it...it's a bit long.
My biggest question is why is this happening, why is it speeding up and why are there almost a constant stream of tremors now? Think of the little kid on the playground...he's climbed to the top of the jungle gym and is now hanging from the top bar, his feet dangling far above the ground.
He looks around wildly, begining to kick his feet as his hands start to slip ever so slightly. As he panics, the sweat starts to coat the palms of his hands and his grip begins to fail him even more. Slipping....slipping...slipping.....
reply to post by stirling
hot springs cove! great spot & lots of bears...
we went the a while back when visiting Toffino
hot springs cove! great spot & lots of bears...
we went the a while back when visiting Toffino
Is there anyone who knows Japanese. Im trying to find how to manipulate this page to show a readout of March 9th, 10th, 11th and 12th, 2011, to see if
there are any patterns of tremors before or after the Tohoku EQ. Japan looks like it gets many times the tremor activity we get here in the CSZ. I
dont know Japanese so this may be wrong but the last two days had over 80,000 tremors and that's about the average, with the majority on the eastern
seaboard of Japan. The longest ETS ever lasted 5 years and was at Tokai south of Fukushima.
Would love to figure out where I need to enter what to get different dates.
www.hinet.bosai.go.jp...
Would love to figure out where I need to enter what to get different dates.
www.hinet.bosai.go.jp...
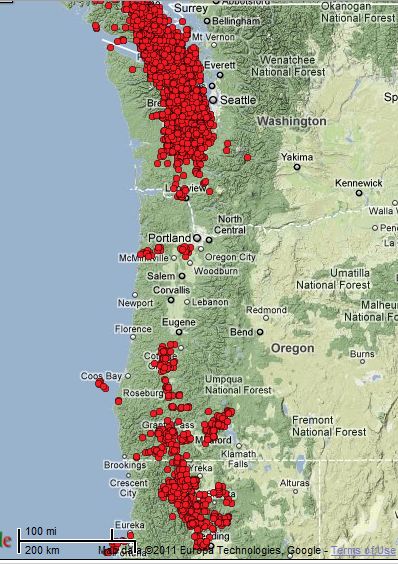
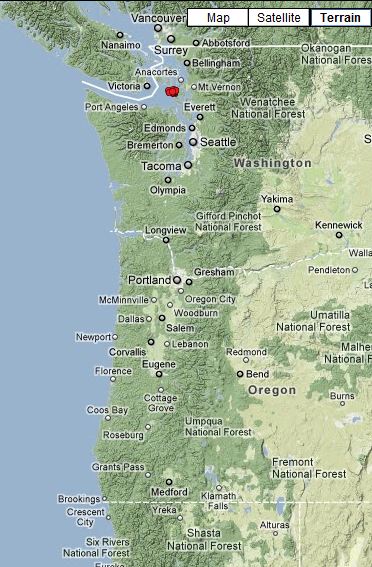
I was going to post this showing no activity whatsoever between Roseburg and Longview;
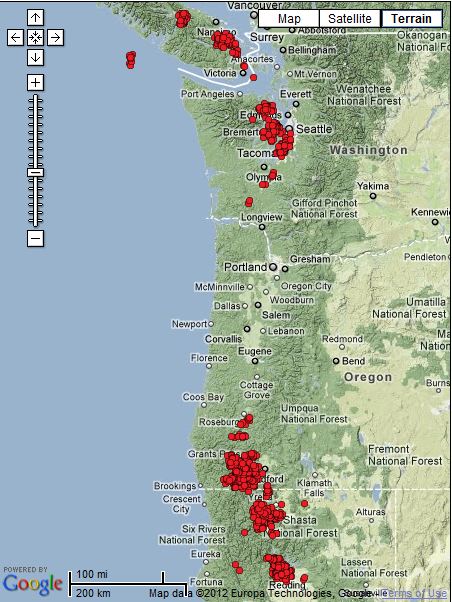
And this happens yesterday
not much but still north of Roseburg. Ill keep my eye on it
And this happens yesterday
not much but still north of Roseburg. Ill keep my eye on it
reply to post by Anmarie96
Thanks Anmarie. It looks like you have to have a paid account to get stuff outside the 30 day window. But there has got to be an article or something out there that discusses tremor activity and the Tohoku EQ. The Japanese seem to be more rabid over EQ data than us in the land of the CSZ.
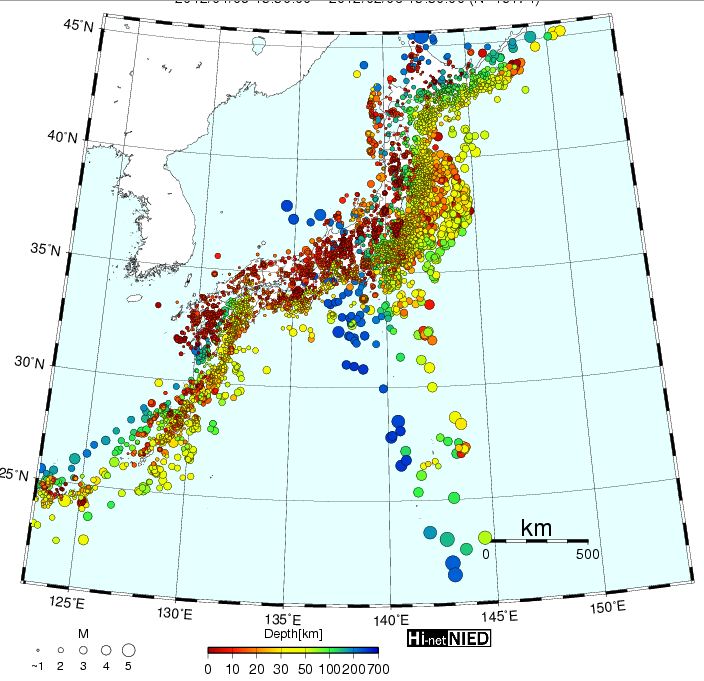
I can see why. I thought we had alot of quakes. This is the EQ map for the last 30 days in Japan.
Thanks Anmarie. It looks like you have to have a paid account to get stuff outside the 30 day window. But there has got to be an article or something out there that discusses tremor activity and the Tohoku EQ. The Japanese seem to be more rabid over EQ data than us in the land of the CSZ.
I can see why. I thought we had alot of quakes. This is the EQ map for the last 30 days in Japan.
reply to post by zworld
I am amazed looking at that map, that the seismologists don't just completely throw their hands up and say "look, we can't keep track of it anymore- quakes happen and we don't know when the next is or where. Goodbye. I am going to find another job. We'll leave the alarm system on...SEE ya."
But I've seen them before like that, and been trying to say for a while now that the USGS listings only show a limited amount of the real seismicity going on in Japan. Most people have no idea it's like that there.
But notice all those real deep quakes in blue! Japan looks like it's about to be ripped apart or something.
The problem is that USGS only report non-domestic earthquakes larger than a M4 I think. Also the Japanese system along with other countries seem to
have their own methods of measuring and categorising size of event. Japan I think has a 1-7 scale and USGS up to 9 or 10.
Now you can see the difficulty trying to have a central database. Not only do you have to uniquely identify each little earthquake and time it, but you also have different countries categorising them differently.... AND, some may be man made blasts which one country does not want to acknowledge. Basically it is a hodge-podge which is why each country reports its own.
In the past I have just decided to go with USGS and accept their limitations otherwise it meant trying to merge many individual counties data into one database so that I could graph it. Too much trouble.
Originally posted by TrueAmerican
But notice all those real deep quakes in blue! Japan looks like it's about to be ripped apart or something.
Yeah, I do. I was wondering along those lines as well. For there to be quakes that deep with not one shallower quake is strange, yes? Or is that a common pattern in some areas.
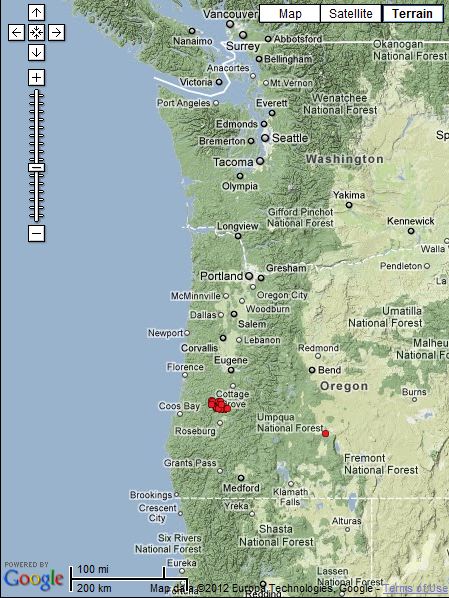
The shakes for Feb 8th
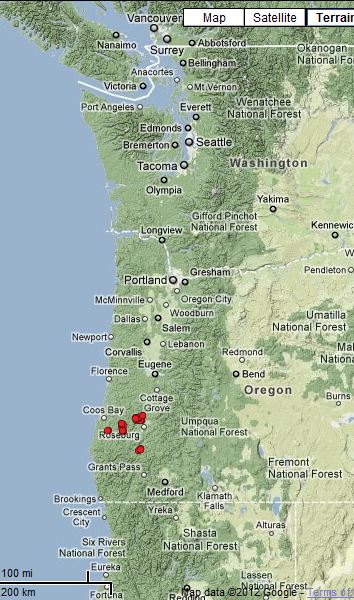
Grants Pass had a loner. And the Cottage Grove cluster is moving south a bit.
Grants Pass had a loner. And the Cottage Grove cluster is moving south a bit.
reply to post by qmantoo
Ive been going to this euro site alot. It think it does a better job with epicenter mapping, especially its regional view. plus it does down to 2.0 for euro sites. Most only go down to 3.0
www.emsc-csem.org...
Ive been going to this euro site alot. It think it does a better job with epicenter mapping, especially its regional view. plus it does down to 2.0 for euro sites. Most only go down to 3.0
www.emsc-csem.org...
edit on 8-2-2012 by zworld because: (no reason given)
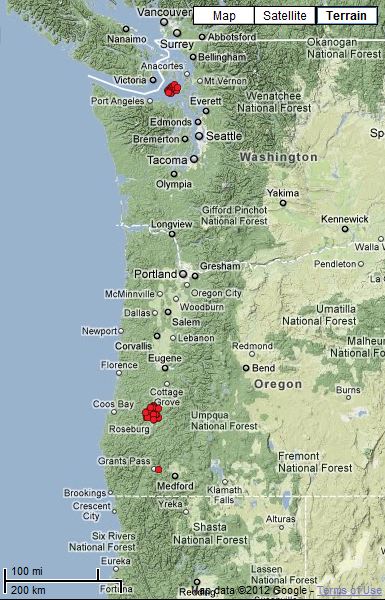
And the winner of todays slow slip sweepstakes is Friday Harbor.
reply to post by TrueAmerican
I think that both the PNSN and HINET do a pretty poor job given the $millions of funding they probably have to work with.
Although PNSN maps are interactive they (* edit: the tremor maps) don't give magnitudes
HINET shows the magnitude by various sized dots but its hard to pin down, where is the data?, do you have to pay?
Geez I can do NZ 30 days interactive in my spare time with absolutely no funding at all.
NZ 30days
I notice on that recent quakes map the lowest magnitude is 0.1 (MtStHelens BTW) which is pretty darn small, so how small are these "tremors" on the Tremors Map?
Too bad its done manually, otherwise I could sell them the program
or charge each network $50,000 a year to update it manually once a day.
How many networks are there
*edit, BTW talking about the PNSN Tremors map, not the recent quakes map which is well done
So how big are these "tremors" on the Tremor Map then?
well if you take that 0.1 magnitude quake at Mt St Helens the energy released is
0.000337605 metric tons of TNT = 11.908 665 924 ounces
so those "tremors" must be even less than 0.1
tom thumb firecrackers comes to mind
trees creaking in the wind probably make as much noise
is there any significance to them at all
edit on 11-2-2012 by muzzy because: (no reason given)
Originally posted by muzzy
trees creaking in the wind probably make as much noise
is there any significance to them at all
It's the magnitude of the combined energy exerted. An individual swarm in the CSZ is a release of energy equivalent to an EQ with magnitude 6 to 7. There are actually a fair number of individual places where these swarms occur. In the southern end theres a return interval of 12 months. In southern Oregon a little longer, and longer still at the Newport swarms, etc on up the coast until you reach the Vancouver Island swarms at 19 months I think. There are swarms going off continously.
Think of Christ Church having a 6 or 7 EQ once a year and 6 or 7s up and down the coast, 4 or 5 a year. That's the level of energy being released, so it must be doing something. But what, that is the million dollar question. Im hoping to learn what they mean and if they predict future events in any way. Right now Im going over the video posted at Quake watch Im pretty sure. The one that has every earthquake a certain size and bigger for the whole year going off. There are distinct patterns showing up, as it goes through, but its not about swarms or clusters of tremors, and thats what needs analyzing.
I have a feeling it's going to take awhile. Ill keep posting any activity. There was no tremor activity on the 10th. The winner of todays slowslip sweepstakes is a really strange cluster in south Oregon.
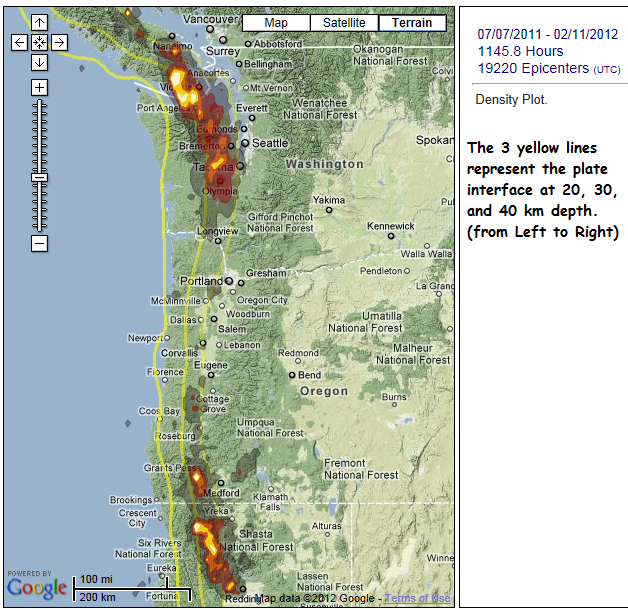
From PNSN tremor page by Aaron Wech (click on the "FAQ" button, and then "tremor FAQ")
The following is additional info regarding tremor, found under the "webpage FAQ" button, same link as above.
So, the software scans for the tell-tale tremor signal, in over-lapping 2.5 minute periods. They can locate epicenters, but not magnitudes or precise depths. Here is a map of the ETS over the past 6 months. (The brightest whites show the most concentrated activity--click thumbnail to enlarge)
As to why there is very little tremor in central Oregon:
1. it could be freely slipping, therefore no tremor
2. plate interface is completely locked in this central portion of the CSZ. If this is the case, why wouln't slip occur farther east? They have quite a bit of equipment in the area that would pick up the tremor.
If the area in central Oregon is slipping freely, then would it follow that the "locked" area immediately west (at depths of 0-20km,say) has more stress being applied to it?
Tremor is the seismic signature of a slow earthquake on the subducting plate interface. As the plates slowly slip past one another, they generate seismic noise that is quite different in its nature from normal earthquakes. The have lower frequency energy, and can last for minutes, hours, or even weeks.
These tremors are deep, non-volcanic signals associated with plate motion, not magmatic motion
.
What are the depths of these tremors?
This is a topic of ongoing research. We know that they occur deep, but the question is how deep? There are different bodies of evidence that suggest
1) They occur at the plate interface as direct result of the plate grinding on each other or
2) They are spread out above the plate boundary possibly occuring on faults that are readjusting in response to stress changes invoked by the slow slip on the plate inteface below.
What are the mangitudes of these tremors?
Small. We don't currently compute magnitudes as part of our automatic processing, but the small amplitudes associated suggest magnitudes < 2.
The following is additional info regarding tremor, found under the "webpage FAQ" button, same link as above.
The epicenters shown are the result of an automated process that does not search for origin times, but instead looks for tremor in every 5-minute window overlapping each other by 2.5 minutes. The non-impulsive, emergent nature of tremor signals makes it difficult and computationally intensive to confidently identify origin times.
Because the signal is so different from regular earthquakes, traditional methods for automatically computing magnitudes are insufficient for deep, tectonic tremors. This is still an active area of research at the UW, and we hope to develop a reliable method for assigning magnitudes to epicenters using the observed amplitudes of these noisy signals.
So, the software scans for the tell-tale tremor signal, in over-lapping 2.5 minute periods. They can locate epicenters, but not magnitudes or precise depths. Here is a map of the ETS over the past 6 months. (The brightest whites show the most concentrated activity--click thumbnail to enlarge)
As to why there is very little tremor in central Oregon:
1. it could be freely slipping, therefore no tremor
2. plate interface is completely locked in this central portion of the CSZ. If this is the case, why wouln't slip occur farther east? They have quite a bit of equipment in the area that would pick up the tremor.
If the area in central Oregon is slipping freely, then would it follow that the "locked" area immediately west (at depths of 0-20km,say) has more stress being applied to it?
Originally posted by Olivine
As to why there is very little tremor in central Oregon:
1. it could be freely slipping, therefore no tremor
2. plate interface is completely locked in this central portion of the CSZ. If this is the case, why wouln't slip occur farther east? They have quite a bit of equipment in the area that would pick up the tremor.
If the area in central Oregon is slipping freely, then would it follow that the "locked" area immediately west (at depths of 0-20km,say) has more stress being applied to it?
I like the mapping you did.
I have a different read on the pattern shown, that is the typical pattern of most tremors being at the two ends of the CSZ. I have already decoupled the Gorda plate from the JDF plate in my mind as it appears that this has happened in reality, (see below) and it is once again playing the wildcard.
As the Gorda is moving independent of the JDF, it is being pushed north as well as clockwise. The leading edge is dropping into the mantle in a southeast direction. In turn it is exerting pressure on the JDF, forcing it north and an ever so slight clockwise motion. But this pressure isnt enough to overcome the pressure being exerted on the JDF from the Explorer plate to the north. These opposing pressures create the greatest strain in the JDF to the northern most section, similar to what is happening in the northern eastern part of the Gorda, causing more tremor activity there. The difference in the two I believe has something to do with the amount of pressure released from the larger quakes mapped below. For the Gorda they occur in the southern area, and in the JDf in the northern area of the plate.
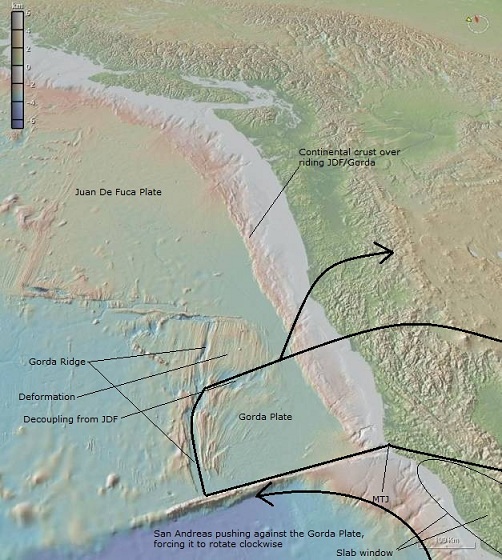
Below I believe is M4+ over the last 100 years but I cant find the data or folder this originally came from so not sure.
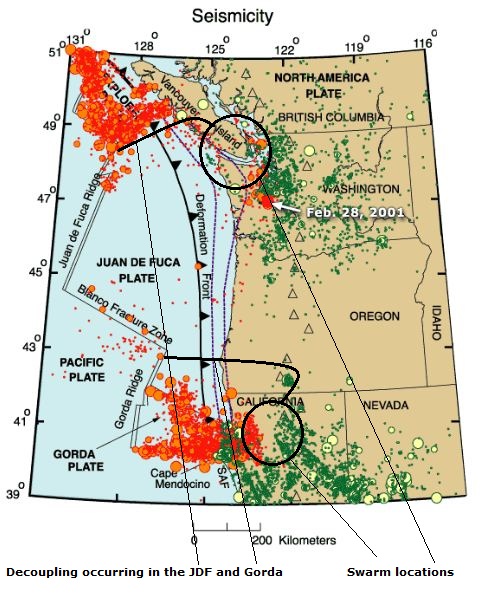
The map below shows the movement of the plates and the pressure points with the greatest stress. Some of the gray areas reflect different ETS zones. As the map displays, the greatest pressure is at the MTJ, and it is coming from all directions.
I disagree with the FAQ stating that none of these are magmatic in nature. I dont think thats been figured out one way or the other yet, and believe that in the Mt Shasta area and possibly, if slow slip is occurring, in tremors over the slab gap as well, some are magmatic in nature. But the idea of tremors in the slab gap area are new to me and I need to explore further.
edit on 12-2-2012 by zworld because: (no reason
given)
edit on 12-2-2012 by zworld because: (no reason given)
is there any daily data for Japanese earthquakes available ?
I dont mean images with spots or crosses on it, but real data that we can plot our own with.
The only one I found had the larger earthquake data but nothing for the many smaller swarms and tremors that occur each day. Maybe one of the universities?
I dont mean images with spots or crosses on it, but real data that we can plot our own with.
The only one I found had the larger earthquake data but nothing for the many smaller swarms and tremors that occur each day. Maybe one of the universities?
new topics
-
Bibi’s Dilemma
Middle East Issues: 25 minutes ago -
Proof of Cleptocracy
US Political Madness: 3 hours ago -
Boy Scouts to be renamed next year
Other Current Events: 7 hours ago -
Pfizer agrees to settle over 10,000 Zantac lawsuits after cancer causing substance found in drug
Medical Issues & Conspiracies: 8 hours ago -
Judas Iscariot Slips The Hangman's Noose
Political Issues: 11 hours ago
top topics
-
Ooooh...it worked!!
Members: 16 hours ago, 20 flags -
Judas Iscariot Slips The Hangman's Noose
Political Issues: 11 hours ago, 10 flags -
A Shout-out To truthseeker45 Hoot Hoot
General Chit Chat: 13 hours ago, 4 flags -
Murder Suicide Investigation Still Active 4 months later?
Other Current Events: 12 hours ago, 4 flags -
Pfizer agrees to settle over 10,000 Zantac lawsuits after cancer causing substance found in drug
Medical Issues & Conspiracies: 8 hours ago, 4 flags -
Boy Scouts to be renamed next year
Other Current Events: 7 hours ago, 3 flags -
Proof of Cleptocracy
US Political Madness: 3 hours ago, 3 flags -
Bibi’s Dilemma
Middle East Issues: 25 minutes ago, 1 flags
active topics
-
Judas Iscariot Slips The Hangman's Noose
Political Issues • 24 • : Justoneman -
Bibi’s Dilemma
Middle East Issues • 1 • : WannabeeAuCourant -
Big Storms
Fragile Earth • 36 • : lilzazz -
Ooooh...it worked!!
Members • 17 • : JJproductions -
Judge Postpones Trump Classified Docs Trial INDEFINITELY
US Political Madness • 148 • : matafuchs -
Don’t Obstruct the Leftist Implosion
US Political Madness • 35 • : lilzazz -
Chris Cuomo, who pushed vaccine shots on CNN, admits Moderna vaccine destroyed his health
Mainstream News • 66 • : zosimov -
Boy Scouts to be renamed next year
Other Current Events • 62 • : andy06shake -
FBI confirms new leads connected to DNA evidence and cellphone data in disturbing killings of elderl
Other Current Events • 15 • : ByeByeAmericanPie -
Skinwalker Ranch and the Mystery 1.6GHz Signal
Aliens and UFOs • 156 • : Flyingclaydisk