It looks like you're using an Ad Blocker.
Please white-list or disable AboveTopSecret.com in your ad-blocking tool.
Thank you.
Some features of ATS will be disabled while you continue to use an ad-blocker.

Quake Watch 2012
page: 259share:
further to post by muzzy
as you can see on that list Mw doesn't kick in until 1999
Thats why I do all magnitude types on that 314-2012 blog, otherwise it would be pointless.
as you can see on that list Mw doesn't kick in until 1999
Thats why I do all magnitude types on that 314-2012 blog, otherwise it would be pointless.
edit on 8-11-2012 by muzzy because: (no reason given)
Guatemala earthquake kills at least 52 people dead, President Otto Perez Molina said, including Giovanni, his grandfather and his uncle.
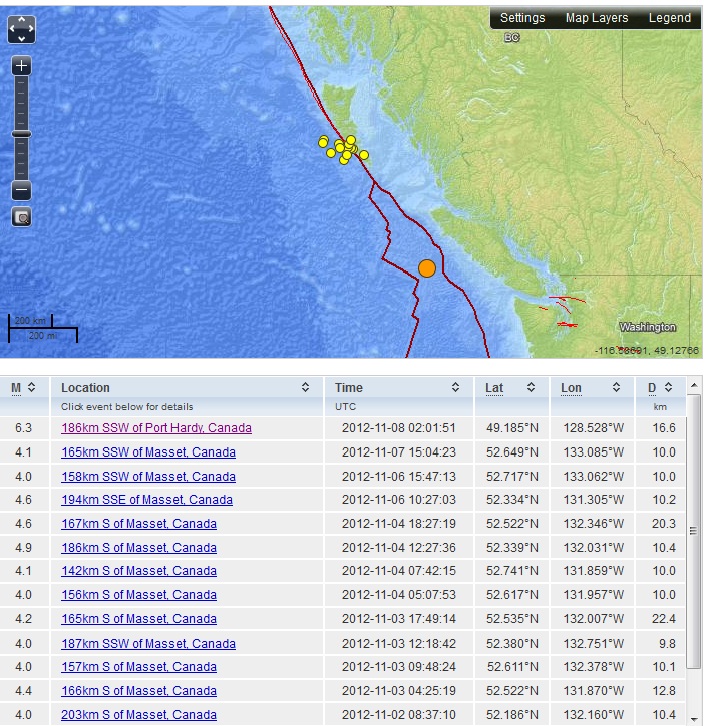
I noticed there were no forshocks to yesterday's 6.3 near Vancouver. The only thing that might be considered an Aftershock would be this small 2,8,
[25 miles] deep, off the coast of Salem Oregon.
neic.usgs.gov...
Is it not unusual that there would be a lack of 4's and maybe a 5 on either side of the 6.3?
It just seems quiet.
I guess there are really no rules to how these quakes work?
neic.usgs.gov...
Is it not unusual that there would be a lack of 4's and maybe a 5 on either side of the 6.3?
It just seems quiet.
I guess there are really no rules to how these quakes work?
Originally posted by Aircooled
I noticed there were no forshocks to yesterday's 6.3 near Vancouver. The only thing that might be considered an Aftershock would be this small 2,8, [25 miles] deep, off the coast of Salem Oregon.
neic.usgs.gov...
Is it not unusual that there would be a lack of 4's and maybe a 5 on either side of the 6.3?
It just seems quiet.
I guess there are really no rules to how these quakes work?
I was wondering the same thing.
No aftershocks kind of worries me.
Something else I just noticed, and perhaps it will change, but the aftershocks stopped farther north(where the 7.7 was) after this 6.3.
Today is 11/08/12 (just took the screenshot now)
Not a single EQ in this region since the 6.3 yesterday.
Not sure if this is good or bad.
edit on 8-11-2012 by Darkblade71 because: (no reason given)
reply to post by Darkblade71
I do not have time to link lists. However, I have noticed that the 5 and 6's in this area have not had many aftershocks at all.
One of the 6's in the last year, I think, had none!!
Go figure.......Maybe all these recent 5 and 6's in the last 18 mos, south of the 7.4, might be foreshocks
I do not have time to link lists. However, I have noticed that the 5 and 6's in this area have not had many aftershocks at all.
One of the 6's in the last year, I think, had none!!
Go figure.......Maybe all these recent 5 and 6's in the last 18 mos, south of the 7.4, might be foreshocks
edit on 8-11-2012 by radpetey
because: (no reason given)
reply to post by Darkblade71
I noticed the same thing, too, but I wasn't sure if it was normal for the region or not. I thought we'd see a couple of aftershocks by now, going by at least the HG/QC Islands 7.7. It's indeed worrisome to not see that. It makes me wonder exactly what happened under there. Was that just a big release of pressure and now there's nothing left to want out, or did something act like the proverbial cork and are we looking at the pressure stress hitting hard at some point?
I noticed the same thing, too, but I wasn't sure if it was normal for the region or not. I thought we'd see a couple of aftershocks by now, going by at least the HG/QC Islands 7.7. It's indeed worrisome to not see that. It makes me wonder exactly what happened under there. Was that just a big release of pressure and now there's nothing left to want out, or did something act like the proverbial cork and are we looking at the pressure stress hitting hard at some point?
4.5 165km SSW of Port Hardy, Canada 2012-11-08 21:07:41 49.316°N 128.280°W
An aftershock.
An aftershock.
Originally posted by Darkblade71
4.5 165km SSW of Port Hardy, Canada 2012-11-08 21:07:41 49.316°N 128.280°W
An aftershock.
Of course there is another way to look at it with an equal chance of being right. It could be another forshock.
P
reply to post by pheonix358
Yeah, but I would rather see it whip out a bunch of 4's and 5's than an 8.4.
So anything low is good as I see it.
Honestly I think these are for-shocks but then
I base that all on my own feelings.
Yeah, but I would rather see it whip out a bunch of 4's and 5's than an 8.4.
So anything low is good as I see it.
Honestly I think these are for-shocks but then
I base that all on my own feelings.
edit on 8-11-2012 by Darkblade71 because: (no reason given)
I'm seeing a 5.5 in Fukushima, Japan here:
www.jma.go.jp...
Now a 4.0 aftershock. But can't find it anywhere else yet.
Map: www.jma.go.jp...
WOQ
Finally, it's on USGS as a 5.3:
earthquake.usgs.gov...
www.jma.go.jp...
Now a 4.0 aftershock. But can't find it anywhere else yet.
Map: www.jma.go.jp...
WOQ
edit on 8-11-2012 by wasobservingquietly because: (no reason given)
Finally, it's on USGS as a 5.3:
earthquake.usgs.gov...
edit on 8-11-2012 by wasobservingquietly because: (no reason
given)
Finally got USG-USA/Alaska/PuertoRicoVirginIs./Hawaii 3+ maps and data up for October, I have given them 8 days to delete, add, downgrade, upgrade
alter and generally manipulate the data
data downloaded today, so should include all revisions.
eqarchives.wordpress.com...
also at the same time I updated Yellowstone, all magnitudes.
eqarchives.wordpress.com...
Yellowstone way up in numbers, 93 for Oct,
PuertoRicoVirgin Is. way down on September 100 vs 375,
Alaska, well same old same old, 101 quakes above 3.0
Continental USA steady on 41
Google Earth crashed 3 times when building the KML files, and my laptop is still going slow, I'll have to reboot
My pet theory at the moment, is that until we see a 8.5+ quake on both sides along the faults near Easter Island; the Cascadia won't go. (Vicinity
Lat: 24°37'13.58"S long: 113° 4'46.23"W ) Once that area kicks off and shakes out, the stresses relieved there would pull greatly on the
faults northward and likely force a 8.2-8.5 + in the region south of the Salton Sea. (Likely a 6-8 off of the California coast too.) Then I suspect
it'd be 2-3 months (likely less) and the Cascadia would go.
It could be that I'm nuts, but I don't think enough energy has been released on that (Easter Island faults) region since the Japan 9.1, but my gut says once it kicks there, it's going to rattle hard enough to set the wrecking ball rolling.
I've been wrong before, likely will be again.
M.
It could be that I'm nuts, but I don't think enough energy has been released on that (Easter Island faults) region since the Japan 9.1, but my gut says once it kicks there, it's going to rattle hard enough to set the wrecking ball rolling.
I've been wrong before, likely will be again.
M.
Any solid way to make a distinctions between an aftershocks and new EQ ?
[ex/e]Pre 4.< L51 A133[
[ex/e]Pre 4.< L51 A133[
oggi accogliamo con favore l'Italia al gruppo di countires coperto da eqarchives
( today we welcome Italy to the group of countires covered by eqarchives)
Italy 2012 magnitude 3+ monthly maps
don't want to be arrested, put through the italian kangaroo court system and put in jail now do we ?
Interesting that during the Emilia-Romagna 5.8, 5.3, 5.2 and the series of aftershocks in May there was little else recorded in other parts of the country.
Average per month for Italy magnitude 3+ seems to be 18
( today we welcome Italy to the group of countires covered by eqarchives)
Italy 2012 magnitude 3+ monthly maps
The Earthquake Information Data Center (Centro Dati e Informazione sui Terremoti) is part of the Italian National Earthquake Center (Centro Nazionale Terremoti)
The parameters reported are the best estimates based on the available data and are constantly revised and subject to change, according to new acquired data. Even if all the parameters have been checked by analysts, no warranty, implicit or explicit, is attached to the data. INGV provides no warranty, expressed or implied, as to the accuracy, reliability or completeness of furnished data.
Every risk due to the improper use of data or the use of inaccurate information is assumed by the user.
© ISIDe Working Group (INGV, 2010), Italian Seismological Instrumental and parametric database
don't want to be arrested, put through the italian kangaroo court system and put in jail now do we ?
Interesting that during the Emilia-Romagna 5.8, 5.3, 5.2 and the series of aftershocks in May there was little else recorded in other parts of the country.
Average per month for Italy magnitude 3+ seems to be 18
Did no one find the quake off Australia of interest?
Location in Google Maps
Derived from Event Data Source: USGS
Powered by QVSData
or better still the Australian version of it (which just came in at 0950 UTC):
Given a nudge by the one below it perhaps
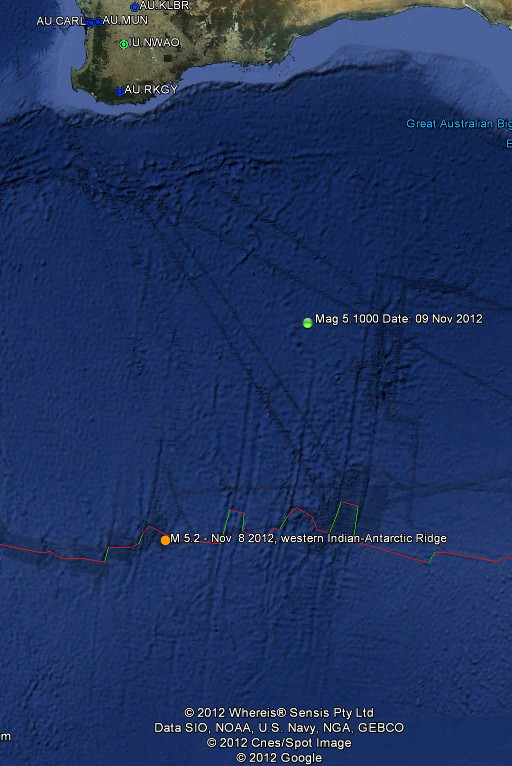
Magnitude 5.1 - South Of Australia
Location in Google Maps
- Date-Time: Friday, November 09, 2012 @ 05:51:42 UTC
- Earthquake location: 42.727°S, 124.704°E,
- Earthquake depth: 10.0 km
- Distances:
1013km (629mi) SSE of Esperance, Australia
1039km (645mi) SSE of Albany, Australia
1297km (805mi) SE of Busselton, Australia
1310km (813mi) SE of Bunbury, Australia
1430km (888mi) SSE of Perth, Australia
- Event ID: usc000dpnv
Derived from Event Data Source: USGS
Powered by QVSData
or better still the Australian version of it (which just came in at 0950 UTC):
Prov,Date/Time UTC,Latitude,Longitude,Magnitude,Depth(Km),Location
aust,2012-11-09 05:51:41, -42.630, 124.410, 0.0, 3.0, South Of Australia. Indian Ocean. [F]
Given a nudge by the one below it perhaps
reply to post by muzzy
Great work Muzzy. The time needed to update all these archives must increasing rapidly!!
Folks, if you have not explored Muzzy's archive sites you should. Not sites for instant access to the latest information but a really valuable resource of historical events data that will build to be indispensable over time.
Take the Yellowstone archive as an example. Here is data which is rapidly gone off the source thus the Yellowstone archive may be the only place you will find this.
I have a similar site for Cascades data, but not mapped just lists and I will eventually get round to listing Yellowstone data as lists in a similar fashion which will complement Muzzy's site.
ETA: No time like the present. Here is 2012 for Yellowstone
Go look, and bookmark. It would be a shame to pass over these excellent resources Muzzy is providing. I know from attempting to maintain my own sites just how much time all this takes. Go look, and appreciate the effort!
All of these are available in Muzzy's signature links.
Oh and by the way this was a completely unsolicited recommendation of Muzzy's work just in case anyone is wondering.
edit on 9/11/2012 by PuterMan because: (no reason given)
Originally posted by muzzy
Yellowstone way up in numbers, 93 for Oct,
Wow, that is a big jump!
I just spent 2 weeks working at the Yellowstone Canyon Lodge in early October, driving by the mud volcano areas in the morning was quite impressive. It seemed that everywhere I looked I could see geothermal activity for miles around. It did seem to me to be above average activity, although I don't have a lot of visual history to go on.
I can tell you though, there's nothing like being there to really drive the point home of just how massive and potentially catastrophic the whole complex is.
Excuse the poor quality and dirty windshield, but here's a short vid of a few of my morning drives to work. You can click on the YouTube link below the vid to see more. Hope it gives those who have never been there a 1st person perspective and greater respect of the power of our little Supervolcano. I didn't get to Old Faithful to clean-off the webcam and wave to all of you ATS'ers, sorry (Throwback from a 2009 conversation in the "What's going on at Yellowstone?" thread...)
edit on 9-11-2012 by sageturkey because: Added comments
Muzzy, Puterman--excellent work fellows.
Your lists, maps and graphs are terrific resources--much faster than trying to search the USGS archive. Thank you both for your efforts.
After spending time browsing both of yours sites, I found myself reading an interesting report noting the differences in moment and energy, depending on the faulting type and tectonic environments. If anyone is interested here is the link: USGS Open-File Report 2001-005
(you can read as html or open the PDF from the above link.)
I thought of you Eric, when I found this animation. It shows the 6 Nov 2011 mag 5.6 in Oklahoma and all of the aftershocks through 31 July 2012. There is also a second animation just showing the first week of aftershocks.
Happy one year earthquake anniversary Sooner state.
reply to post by sageturkey
Wow, just er.. wow! I looked at the first one and will go back to the others later.
One thing concerns me greatly. You really should not spend so much time driving on the wrong side of the road!
Wow, just er.. wow! I looked at the first one and will go back to the others later.
One thing concerns me greatly. You really should not spend so much time driving on the wrong side of the road!
edit on 9/11/2012 by PuterMan because: Darn it can I not get just ONE post without a spelling error? Humph!
reply to post by Olivine
Thank you Ma'am. It is no good, I know what you are playing at! You are trying to ensure that I stay stuck on earthquakes with links like that.
Very interesting and a subject very close to my heart - not that I understand it or the mathematics much!
M0 being the value from which Mw is derived is a measure of the energy released, but we do not come across the Me scale very often.
Stress, stress, stress and the interpretation of stress is the key to defining the probability of future earthquakes and there are many people out there who understand the subject way better than I do, but I keep on plugging away gathering information and you never know, one day I might actually understand some of it.
If anyone can explain to me how the coulomb stress charts are made, in words of two syllables or less preferably, I would much appreciate it. The USGS have a free program called Coulomb 3 but it runs on MatLab and that is NOT free, not by a long chalk. I want to get into the coulomb stress diagrams but due to pecuniary impoverishment it looks as if I am going to have to write the darn things myself. What I need to understand is what the actual process is.
For this reason any information anyone has or can glean would be of interest. The Coulomb 3 examples and help file are a starter but searching the net brings up very many non earthquake related links and the odd few earthquake ones are written in 'Microsoft speak', by which I mean they spout gobbledegook, tell you what it does - which you already know, and tell you absolutely nothing about how to do it - a typical Microsoft help file.
One day people who write technical manuals will be forced to write in intelligible sentences.
new topics
-
Where should Trump hold his next rally
Politicians & People: 37 minutes ago -
Shocking Number of Voters are Open to Committing Election Fraud
US Political Madness: 1 hours ago -
Gov Kristi Noem Shot and Killed "Less Than Worthless Dog" and a 'Smelly Goat
2024 Elections: 2 hours ago -
Falkville Robot-Man
Aliens and UFOs: 2 hours ago -
James O’Keefe: I have evidence that exposes the CIA, and it’s on camera.
Whistle Blowers and Leaked Documents: 3 hours ago -
Australian PM says the quiet part out loud - "free speech is a threat to democratic dicourse"...?!
New World Order: 3 hours ago -
Ireland VS Globalists
Social Issues and Civil Unrest: 4 hours ago -
Biden "Happy To Debate Trump"
2024 Elections: 4 hours ago -
RAAF airbase in Roswell, New Mexico is on fire
Aliens and UFOs: 5 hours ago -
What is the white pill?
Philosophy and Metaphysics: 6 hours ago
top topics
-
A Warning to America: 25 Ways the US is Being Destroyed
New World Order: 14 hours ago, 21 flags -
Blast from the past: ATS Review Podcast, 2006: With All Three Amigos
Member PODcasts: 7 hours ago, 11 flags -
Mike Pinder The Moody Blues R.I.P.
Music: 7 hours ago, 8 flags -
Biden "Happy To Debate Trump"
2024 Elections: 4 hours ago, 8 flags -
Australian PM says the quiet part out loud - "free speech is a threat to democratic dicourse"...?!
New World Order: 3 hours ago, 7 flags -
James O’Keefe: I have evidence that exposes the CIA, and it’s on camera.
Whistle Blowers and Leaked Documents: 3 hours ago, 6 flags -
What is the white pill?
Philosophy and Metaphysics: 6 hours ago, 5 flags -
Ireland VS Globalists
Social Issues and Civil Unrest: 4 hours ago, 4 flags -
RAAF airbase in Roswell, New Mexico is on fire
Aliens and UFOs: 5 hours ago, 4 flags -
Putin, Russia and the Great Architects of the Universe
ATS Skunk Works: 10 hours ago, 3 flags
active topics
-
University of Texas Instantly Shuts Down Anti Israel Protests
Education and Media • 305 • : Xtrozero -
Biden "Happy To Debate Trump"
2024 Elections • 38 • : JadedGhost -
Russia Ukraine Update Thread - part 3
World War Three • 5737 • : Arbitrageur -
Gov Kristi Noem Shot and Killed "Less Than Worthless Dog" and a 'Smelly Goat
2024 Elections • 26 • : CarlLaFong -
James O’Keefe: I have evidence that exposes the CIA, and it’s on camera.
Whistle Blowers and Leaked Documents • 8 • : Athetos -
Weinstein's conviction overturned
Mainstream News • 29 • : Xtrozero -
Shocking Number of Voters are Open to Committing Election Fraud
US Political Madness • 2 • : xuenchen -
Candidate TRUMP Now Has Crazy Judge JUAN MERCHAN After Him - The Stormy Daniels Hush-Money Case.
Political Conspiracies • 810 • : Annee -
Where should Trump hold his next rally
Politicians & People • 3 • : theatreboy -
Do you ever just get "bored" of everything?
Rant • 22 • : JonnyC555