It looks like you're using an Ad Blocker.
Please white-list or disable AboveTopSecret.com in your ad-blocking tool.
Thank you.
Some features of ATS will be disabled while you continue to use an ad-blocker.

New Zealands 150 year temperature record manipulated to show warming when there wasnt any!
page: 2share:
Originally posted by melatonin
The deception is obvious here, and its nothing to do with NIWA. And now, yeah, Treadgold is a random blogger. So is Watt at the Wattatwit blog - but he's like a black hole for the ignorant deniers.
It's interesting that you attack people who aren't climate scientists, as if it's all you need to do to discredit them. Yet you are happy to accept quotes from Gareth Renowden (not a climate scientist either, but an enthusiastic truffle hunter, who’s has been shown to be wrong regarding climate change on so many occasions.) when he says something that attempts to bolster your cause.
Your witty names for sites which go against your ideologies are amusing as well. Quite the comedian, aren't you.
As far as NZ temps go, NIWA have given an explanation only for Wellington, while saying they don't need to release their methods for other sites which have also been altered dramatically. At this stage, we really don't know what they've done for other sites. But it does seem odd that all of them, with the exception of Dunedin, have had early temperatures adjusted significantly down, which is why the adjusted data shows a warming trend, compared to raw data.
If they could give adequate reasons for ALL of the sites, then that would be acceptable to clear their name. But at this stage, they haven't. It just looks like their in damage control mode, much like CRU, and possibly other weather agencies around the world in the near future.
[edit on 27-11-2009 by Curious and Concerned]
Originally posted by melatonin
I've already posted the link to the raw data. It's in a post further up the page in a reply to you.
You entirely free to play scientist with it if you want.
Too bad its a bad link.
Too funny.
Originally posted by IgnoranceIsntBlisss
Too bad its a bad link.
Too funny.
Works fine for me.
Originally posted by Curious and Concerned
It's interesting that you attack people who aren't climate scientists, as if it's all you need to do to discredit them.
As if that's all I posted
Yet you are happy to accept quotes from Gareth Renowden (not a climate scientist either, but an enthusiastic truffle hunter, who’s has been shown to be wrong regarding climate change on so many occasions.) when he says something that attempts to bolster your cause.
The point is more a case of if random blogger says x and y, then it makes sense to check further. However, it's not Gareth representing himself under the grand authoritative titles 'New Zealand Climate Science Coalition' and 'Climate Conservation Group'.
Your witty names for sites which go against your ideologies are amusing as well. Quite the comedian, aren't you.
It's actually the ATS friendly version.
If they could give adequate reasons for ALL of the sites, then that would be acceptable to clear their name.
The reasons will be the same. Siting issues. That's the reason for homogenisation of the data. For example, Dunedin, Musselburgh has only been collecting data for 26 years. Before that the station would have been elsewhere.
But at this stage, they haven't. It just looks like their in damage control mode, much like CRU, and possibly other weather agencies around the world in the near future.
So what you're saying is that even though a random blogger has been shown to be clearly deceiving people in his representation of the data, with the information being credulously bounced around the echochamber, it's NIWA, CRU, and other agencies that have the problem?
lol
[edit on 27-11-2009 by melatonin]
You mean you dont have me on ignore?!?!
I tried it yesterday and just now.
I'm still awaiting your response to my "Its conclusive" thread:
www.abovetopsecret.com...
I tried it yesterday and just now.
I'm still awaiting your response to my "Its conclusive" thread:
www.abovetopsecret.com...
Originally posted by IgnoranceIsntBlisss
You mean you dont have me on ignore?!?!
I tried it yesterday and just now.
I'm still awaiting your response to my "Its conclusive" thread:
www.abovetopsecret.com...
I'm actually bored of responding to your disinformation. Gets tedious after a while.
As for the link, perhaps try copy and pasting into browser.
Hmmm... So you mean in the emails they didnt discuss how they used trees from different locations, didnt delete the decline as in McIntyres new graph,
Didnt talk about "milking" the statistics to squeeze out the results in their favor as far as possible, and so on? That post stands uncontested, and
since you seem to be the last Alarmist standing after the AGW meltdown, it comes with the territory.
Originally posted by IgnoranceIsntBlisss
Too bad its a bad link.
Too funny.
Works fine for me.
Takes a second to come up, though.
Once again, the "denier's" claims are debunked, and can be explained as standardized & mundane scientific practices in climate science!
That link with NASA data works here fine.
[edit on 27-11-2009 by john124]
That link with NASA data works here fine.
[edit on 27-11-2009 by john124]
Originally posted by melatonin
NASA-GISS use the data from NCDC/NOAA. It's here:
ftp.ncdc.noaa.gov...
Posting the link to an ftp server doesnt prove anything. No description is involved there.
Are you saying that Watt is lying when he says all the data is adjusted?
wattsupwiththat.com...
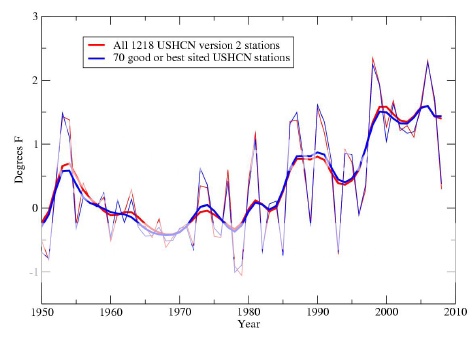
Nice graph you've posted.
The irony is, even if we do take this (the entire history of 1200 stations) as extremely reliable and accurate, that still only shows 1' of incrrease since 1950. But nice try! The graph begisn at 1950, the start of a cool period. Begining at 1900, theres hardly any increase at all:
So you can line up some line graphs. Get real. I wouldnt expect the sine wave to be much different. But we're to expect that the average containing the 90% bad sites to often have less cooling? And the thing is they couldnt even be sure the adjustments they used to line them up, until Watts paper.
If you could show us the official graph they used to present before they adjusted the 70 sites to match the remainder?
The paper boasts USCRN in the opening statements, but when you follow up on it the 'rigourously maintained' network wasnt even in the experimental stage until 2002.
You could only even dream of getting them accurate by visiting each site and doing complex calculations. It would require a team. First day in electronics engineering we were told "keep it simple stupid". Just because the line graph has the same variation pattern doesnt mean you'll know what you get by throwing a simple .5c or whatever. And from the view of 100 years, tons of changes occur. So even if they can match the lines up to satellite, that doesnt mean that they could get it right year by year every year before satellites.
Originally posted by john124
Once again, the "denier's" claims are debunked, and can be explained as standardized & mundane scientific practices in climate science!
That link with NASA data works here fine.
What are you talking about? WHAT has been debunked? This main issue here isnt whether or not that US NOAA data he linked is available un-'corrected'. That was one comment in a huge deal.
This link worked for you:
ftp.ncdc.noaa.gov...
???
IE:
Internet Explorer cannot display the webpage
Firefox:
The connection was reset
You opened it with your ftp client, eh? I hadn't thought of that until a moment ago.
But it doesnt matter, it's not the discussion.
reply to post by IgnoranceIsntBlisss
It opens in firefox as an ftp index. I never use internet explorer.
The title of the thread claims manipulation show warming where there wasn't any, and there's no evidence of that claim and has been shown to be a misunderstanding.
It opens in firefox as an ftp index. I never use internet explorer.
The title of the thread claims manipulation show warming where there wasn't any, and there's no evidence of that claim and has been shown to be a misunderstanding.
Originally posted by IgnoranceIsntBlisss
Originally posted by melatonin
NASA-GISS use the data from NCDC/NOAA. It's here:
ftp.ncdc.noaa.gov...
Posting the link to an ftp server doesnt prove anything. No description is involved there.
You wanted the raw data. Isn't my fault you can't decipher the ftp files. Do you need someone to hold your hand? NOAA provide both raw station data and the processed gridded homogenised data. This is the data that NASA-GISS use (their data and software is also freely available). CRU use most of this data and some extra commercial data they have access to. Description of GCNv2 here:
GHCN temperature database Peterson & Vose
p 2843
The first stage examines the quality and appropriateness of the source datasets. Thirty-one source datasets contributed temperature data to GHCN while several additional potential sources had to be rejected. The rejections were primarily caused by (a) homogeneity-adjusted data without access to original observations; (b) the monthly data were derived from synoptic reports, which are almost always incomplete, thereby causing unacceptable errors or biases; and (c) significant processing errors that indicated the source dataset was unreliable.
The data is also described in the 'v2.temperature.readme' at the ftp. So go read it.
RealClimate has collated the freely available data (raw and processed) and much code/software for the google-impaired here.
•Climate data (raw)
•Climate data (processed)
•Paleo-data
•Paleo Reconstructions (including code)
•Large-scale model (Reanalysis) output
•Large-scale model (GCM) output
•Model codes (GCMs)
•Model codes (other)
•Data Visualisation and Analysis
•Master Repositories of climate and other Earth Science data
Go and have fun with it. It's what you've been whining for.
Are you saying that Watt is lying when he says all the data is adjusted?
Yes, data is processed and adjusted. We've just been talking about it. There are good reasons to adjust for site changes and other site effects. Using the raw data blindly like Treadgold leads to moron science.
Nice graph you've posted.
The irony is, even if we do take this (the entire history of 1200 stations) as extremely reliable and accurate, that still only shows 1' of incrrease since 1950. But nice try! The graph begisn at 1950, the start of a cool period. Begining at 1900, theres hardly any increase at all
I'm not even trying to represent warming. Show me where I said that related to that figure. It wasn't the point.
I was comparing the 70 best stations according to Watt and the actual processed adjusted data. That was the issue being discussed. Please, do me a favour, read my posts and get a clue.
If you could show us the official graph they used to present before they adjusted the 70 sites to match the remainder?
Perhaps you might want to support the claim that they adjusted the 70 to match the remainder (1000+)? You can use the data at the ftp to show this if you want.
Again, the point was that Watt sends out a bunch of cronies on a mission to smear and discredit a dataset with photographs. He then determines which are the best and worst sites using the NCDC/NOAA specification.
You take a set of best sites (70 stations) and compare to the actual processed data (1000+) which includes hundreds of 'poorer' sites. Little difference. The adjustments do the job. So he actually validating the NCDC/GISS data. Climate is all about trends in the data, the absolute measures themselves are not really of prime interest (hence use of anomaly data).
Watt is free to publish his own data any time he likes. Would be a better approach than just taking a bunch of pictures of stations.
[edit on 28-11-2009 by melatonin]
Originally posted by melatonin
Originally posted by IgnoranceIsntBlisss
Are you saying that Watt is lying when he says all the data is adjusted?
Yes, data is processed and adjusted. We've just been talking about it. There are good reasons to adjust for site changes and other site effects. Using the raw data blindly like Treadgold leads to moron science.
You spin-meister! I keep asking you if its the RAW data and you keep saying yes. Now you finally admit thats its adjusted, which has been the point the entire thread. Talk about LIES!
No, the raw data is available.
How do you think Treadgold was able to present his shabby deceptive analysis?
The raw unprocessed obervational data direct from stations all over the world is available via the link I provided. But it's not very useful unless analysed correctly (i.e., homogenised).
They describe this in the GHCN article I posted. Have you read it yet? Here, I'll spoon-feed you again...
GHCN has two sets of data:
1. Original and unprocessed
2. Homogenised/processed/adjusted
and as posted before:
They won't accept homogenised data without access to original raw data.
[edit on 28-11-2009 by melatonin]
How do you think Treadgold was able to present his shabby deceptive analysis?
The raw unprocessed obervational data direct from stations all over the world is available via the link I provided. But it's not very useful unless analysed correctly (i.e., homogenised).
They describe this in the GHCN article I posted. Have you read it yet? Here, I'll spoon-feed you again...
Most long-term climate stations have undergone changes that make a time series of their observations inhomogeneous. There are many causes for the discontinuities, including changes in instruments, shelters, the environment around the shelter, the location of the station, the time of observation, and the method used to calculate mean temperature.
...
Before one can reliably use such climate data for analysis of longterm climate change, adjustments are needed to compensate for the nonclimatic discontinuities. GHCN temperature data include two different datasets: the original data and a homogeneity-adjusted dataset.
GHCN has two sets of data:
1. Original and unprocessed
2. Homogenised/processed/adjusted
and as posted before:
The first stage examines the quality and appropriateness of the source datasets. Thirty-one source datasets contributed temperature data to GHCN while several additional potential sources had to be rejected. The rejections were primarily caused by (a) homogeneity-adjusted data without access to original observations; (b) the monthly data were derived from synoptic reports, which are almost always incomplete, thereby causing unacceptable errors or biases; and (c) significant processing errors that indicated the source dataset was unreliable.
They won't accept homogenised data without access to original raw data.
[edit on 28-11-2009 by melatonin]
reply to post by melatonin
As expected, you reply with a shallow attempt at denigration of the source rather than substance.
Almost as much as the inability to objectively read and report them.
Next, you'll cut and paste more of the discredited "trends" and datasets.
Your desperation is becoming laughable.
Deny ignorance.
jw
And if you want to believe schoolboy 'science' from a random guy like Mr Treadgold, that's your prerogative. Laughs aplenty at your credulous nature.
Urban Heat Island Effect is a major issue with land station data temps rising over the past 150 years.
As expected, you reply with a shallow attempt at denigration of the source rather than substance.
So the siting of land stations has an important influence on measurements?
Almost as much as the inability to objectively read and report them.
Next, you'll cut and paste more of the discredited "trends" and datasets.
Your desperation is becoming laughable.
Deny ignorance.
jw
reply to post by melatonin
"Adjustments" by definition introduce bias and the potential for influence. Any objective observer can assess raw data in context. AGW advocates make their "adjustments" proprietary. That they fit your preconceptions speaks volumes more than your "assessment" of others' observations.
Deny ignorance.
jw
Do you just connect the measurements as if the move never happened (see Threadgold)?
Or do you try to adjust for the effect of moving the station (see NIWA)?
"Adjustments" by definition introduce bias and the potential for influence. Any objective observer can assess raw data in context. AGW advocates make their "adjustments" proprietary. That they fit your preconceptions speaks volumes more than your "assessment" of others' observations.
Deny ignorance.
jw
NCAR paper on record high temperatures an artifact of putting thermometers in urbanized areas
"A new paper that is soon to appear in the journal Geophysical Research Letters finds that across the U.S. daily record high temperatures are being set at about twice the frequency of daily record low temperatures and that this ratio—number of record highs to the number of record lows, has been growing larger over the past 50 years.
The popular press seems to be particularly taken with this finding, although headline proclamations fail to disclose important details of the actual findings reported by the National Center for Atmospheric Research’s (NCAR) Gerald Meehl and colleagues.
...
Meehl et al. find that the reason more daily maximum temperature records are being set than daily minimum temperatures records is because there are fewer than expected daily lows records being set, not because there are more daily high records than expected.
...
So, the bottom line here is this—climate change in the U.S. during the past 50 years has resulted in fewer extreme nighttime low temperatures, while the daily extreme high temperatures have been little affected. And, at least one leading climate model fails to correctly capture this behavior.
Nah. Nothing to see here...
Originally posted by melatonin
The point is more a case of if random blogger says x and y, then it makes sense to check further. However, it's not Gareth representing himself under the grand authoritative titles 'New Zealand Climate Science Coalition' and 'Climate Conservation Group'.
Hey Mel, I've been away for a while. Gareth does in fact try to represent himself as some kind of authoritive figure on climate change over at hot topic.
But you'd be forgiven for not knowing this, as it is mostly just an echo chamber for AGW scare stories and political fear mongering. Not really a lot to look at. I tried to find the post where they use a fictional book showing the effects of hypothetical rises in temperatre up to 6 degrees, and then claim that that is what we are headed for. It's quite funny, but I couldn't find it, sorry.
Originally posted by melatonin
The reasons will be the same. Siting issues. That's the reason for homogenisation of the data. For example, Dunedin, Musselburgh has only been collecting data for 26 years. Before that the station would have been elsewhere.
I know you appear to be confident that all is well with the record, even without seeing what changes have been made. But the fact is they haven't released their adjustments, and have used broad based explanations to dismiss any questions regarding them.
Sure that should be the reason they have been adjusted. But have they been adjusted correctly? Or is it like the Darwin adjustments across the ditch in Oz.
It's quite interesting that I'm starting to see a trend here. Raw data showing variation but little to no warming trend. Then the "homogenization" suddenly showing a clear warming trend...
Nah, nothing to see here.
Seriously though, I'm happy to see that these adjustments have been done correctly. But just saying they did without knowing is foolish, so I'll wait till the appropriate responses have been made.
reply to post by melatonin
Is that a joke?!?!
The siting of the stations GREATLY affects the reading!!!!!!!!!
So the siting of land stations has an important influence on measurements?
Is that a joke?!?!
The siting of the stations GREATLY affects the reading!!!!!!!!!
Originally posted by Curious and Concerned
Hey Mel, I've been away for a while. Gareth does in fact try to represent himself as some kind of authoritive figure on climate change over at hot topic.
But you'd be forgiven for not knowing this, as it is mostly just an echo chamber for AGW scare stories and political fear mongering. Not really a lot to look at. I tried to find the post where they use a fictional book showing the effects of hypothetical rises in temperatre up to 6 degrees, and then claim that that is what we are headed for. It's quite funny, but I couldn't find it, sorry.
Nothing to be sorry about. Sounds a bit like Mark Lynas' book. All based on research and is a potential future. Hope festivus is going well, by the way.
As for Gareth Renowden, he says he's a journalist and author. Not really posing under labels of 'climate coalition' etc.
I know you appear to be confident that all is well with the record, even without seeing what changes have been made. But the fact is they haven't released their adjustments, and have used broad based explanations to dismiss any questions regarding them.
Sure that should be the reason they have been adjusted. But have they been adjusted correctly? Or is it like the Darwin adjustments across the ditch in Oz.
It's not a case of 'all is well'. No data is perfect. That just doesn't happen. The old data was originally not collected for the purpose it's now being used for, however, data is like bleedin' gold-dust. So you use it the best you can when you can.
It's quite interesting that I'm starting to see a trend here. Raw data showing variation but little to no warming trend. Then the "homogenization" suddenly showing a clear warming trend...
Nah, nothing to see here.
But that would be an error. That's mainly because deniers go looking specifically for stations to raise such issues in the mind of the less informed. Just a case of poisoning the well.
These same stations have been doing the rounds for years.
Seriously though, I'm happy to see that these adjustments have been done correctly. But just saying they did without knowing is foolish, so I'll wait till the appropriate responses have been made.
Of course, but like I showed earlier you can see why some adjustments are made. It would be ridiculous to use their data and not adjust.
The choices available include:
1. do what the denier did and suggest that moving stations from one spot to another is not important, and string the data together. Totally inappropriate and quite deceptive of the guy. But, hey, the dude's a denier, I would expect no less.
2. Throw the data away/not use. Often silly, as data is gold-dust and it makes sense to use it if possible. Sometimes it just isn't, of course.
3. Make appropriate adjustments to produce a more consistent set of data. The best option when possible.
And for the Australian data they have already said why the some adjustment are necessary:
A change in the type of thermometer shelter used at many Australian observation sites in the early 20th century resulted in a sudden drop in recorded temperatures which is entirely spurious. It is for this reason that these early data are currently not used for monitoring climate change. Other common changes at Australian sites over time include location moves, construction of buildings or growth of vegetation around the observation site and, more recently, the introduction of Automatic Weather Stations.
dinky-link
and also in a 2004 article here.
However, the funny thing about the Darwin palaver is that you can see how GISS treat the data for that station here:
data.giss.nasa.gov...
Try 'Darwin' 'after homogeneity adjustment'. Tell me what you see, lol.
[edit on 27-12-2009 by melatonin]
new topics
-
Pelosi injured in Luxembourg
Other Current Events: 3 hours ago -
Nov 2024 - Former President Barack Hussein Obama Has Lost His Aura.
US Political Madness: 4 hours ago -
Something better
Dissecting Disinformation: 10 hours ago
top topics
-
Pelosi injured in Luxembourg
Other Current Events: 3 hours ago, 10 flags -
Something better
Dissecting Disinformation: 10 hours ago, 8 flags -
Nov 2024 - Former President Barack Hussein Obama Has Lost His Aura.
US Political Madness: 4 hours ago, 7 flags -
More Ons?
Political Conspiracies: 13 hours ago, 6 flags -
Friday thoughts
General Chit Chat: 13 hours ago, 5 flags -
Canada Post strike ended by the Government of Canada
Mainstream News: 13 hours ago, 4 flags -
The Witcher IV — Cinematic Reveal Trailer | The Game Awards 2024
Video Games: 12 hours ago, 3 flags
active topics
-
-@TH3WH17ERABB17- -Q- ---TIME TO SHOW THE WORLD--- -Part- --44--
Dissecting Disinformation • 3674 • : 777Vader -
They Know
Aliens and UFOs • 72 • : donfreas -
Top Sci Fi/Horror Crossover Movies
Movies • 13 • : worldstarcountry -
Post A Funny (T&C Friendly) Pic Part IV: The LOL awakens!
General Chit Chat • 7907 • : KrustyKrab -
Drones everywhere in New Jersey
Aliens and UFOs • 112 • : worldstarcountry -
Pelosi injured in Luxembourg
Other Current Events • 15 • : NorthOS -
Something better
Dissecting Disinformation • 17 • : AlroyFarms -
A Bunch of Maybe Drones Just Flew Across Hillsborough County
Aircraft Projects • 72 • : worldstarcountry -
President Biden to Grant Blanket Pardons to Individuals Trump's DOJ May Indict 2025-2029.
US Political Madness • 47 • : WeMustCare -
Drones (QUESTION) TERMINATOR (QUESTION)
General Chit Chat • 11 • : Cavemannick