It looks like you're using an Ad Blocker.
Please white-list or disable AboveTopSecret.com in your ad-blocking tool.
Thank you.
Some features of ATS will be disabled while you continue to use an ad-blocker.

New Zealands 150 year temperature record manipulated to show warming when there wasnt any!
page: 1share:
New study shows that New Zealand temps for the past 150 years have been artificially adjusted to show warming while there has been virtually none.
Note: This phony graph wasn't made by those indicted in the Climategate emails, but it may provide a window into the meaning of phrases such as
"corrected", "hide the decline", "artificially adjusted", "reconstructed" and so on:
Sunspot graph, for kicks:
solarscience.msfc.nasa.gov...
nzclimatescience.net...
Moreinfo and perspective on this story here:
wattsupwiththat.com...
The issue of "corrected" data is already prompting a renewed push for the release of raw surface temperature data by many within the scientific community and public. Government institutions such as GISS have a long history of refusing to release 'uncorrected' data.
Notes From Within The Climategate Computer Code:
MORE REVEALING CLIMATEGATE PROGRAMMERS NOTES HERE
The nOw famous "hide the decline" phrase refers to proxy data (tree rings from forests, ice cores from glaciers). The fact that New Zealands temps have hardly risen, would seem to explain why it is proxy data would show a decline when surface temp station data has risen since the 1940's & 60's (when urbanization was rapidly expanding).
And then there's the issue of unscientific surface station locations & methods, including instruments located near blacktop pavement and air conditioning unit exhausts, while already counting on humans to walk outside and record the high and low temps, daily, decade after decade.
Photos of flawed surface stations:
MANY MORE:
www.surfacestations.org...
Urban Heat Island Effect is a major issue with land station data temps rising over the past 150 years.
A couple quote from the now infamous Climategate emails is pretty revealing in this regard:
[edit on 26-11-2009 by IgnoranceIsntBlisss]
[edit on 26-11-2009 by IgnoranceIsntBlisss]
[edit on 26-11-2009 by IgnoranceIsntBlisss]
Sunspot graph, for kicks:
solarscience.msfc.nasa.gov...
nzclimatescience.net...
CLIMATEGATE IN NEW ZEALAND? - TEMPERATURE RECORDS MANIPULATED
Posted 25 November 2009
"There have been strident claims that New Zealand is warming. The Inter-governmental Panel on Climate Change (IPCC), among other organisations and scientists, allege that, along with the rest of the world, we have been heating up for over 100 years. But now, a simple check of publicly-available information proves these claims wrong. In fact, New Zealand’s temperature has been remarkably stable for a century and a half. So what’s going on?" Researchers find records adjusted to represent 'warming' when raw data show temperatures have been stable.
LINK to download pdf file
Moreinfo and perspective on this story here:
wattsupwiththat.com...
Uh, oh – raw data in New Zealand tells a different story than the “official” one.
The issue of "corrected" data is already prompting a renewed push for the release of raw surface temperature data by many within the scientific community and public. Government institutions such as GISS have a long history of refusing to release 'uncorrected' data.
Notes From Within The Climategate Computer Code:
; Plots 24 yearly maps of calibrated (PCR-infilled or not) MXD reconstructions
; of growing season temperatures. Uses “corrected” MXD – but shouldn’t usually
; plot past 1960 because these will be artificially adjusted to look closer to
; the real temperatures.
;
; Plots (1 at a time) yearly maps of calibrated (PCR-infilled or not) MXD
; reconstructions
; of growing season temperatures. Uses “corrected” MXD – but shouldn’t usually
; plot past 1960 because these will be artificially adjusted to look closer to
; the real temperatures.
MORE REVEALING CLIMATEGATE PROGRAMMERS NOTES HERE
The nOw famous "hide the decline" phrase refers to proxy data (tree rings from forests, ice cores from glaciers). The fact that New Zealands temps have hardly risen, would seem to explain why it is proxy data would show a decline when surface temp station data has risen since the 1940's & 60's (when urbanization was rapidly expanding).
And then there's the issue of unscientific surface station locations & methods, including instruments located near blacktop pavement and air conditioning unit exhausts, while already counting on humans to walk outside and record the high and low temps, daily, decade after decade.
Photos of flawed surface stations:
MANY MORE:
www.surfacestations.org...
Urban Heat Island Effect is a major issue with land station data temps rising over the past 150 years.
A couple quote from the now infamous Climategate emails is pretty revealing in this regard:
From: Tom Wigley
To: Phil Jones
Subject: LAND vs OCEAN
Date: Fri, 06 Nov 2009 17:36:15 -0700
We probably need to say more about this. Land warming since
1980 has been twice the ocean warming -- and skeptics might
claim that this proves that urban warming is real and important.
From: Kevin Trenberth
To: Michael Mann
Subject: Re: BBC U-turn on climate
Date: Mon, 12 Oct 2009 08:57:37 -0600
Cc: Stephen H Schneider , Myles Allen , peter stott , “Philip D. Jones” , Benjamin Santer , Tom Wigley , Thomas R Karl , Gavin Schmidt , James Hansen , Michael Oppenheimer
Hi all
Well I have my own article on where the heck is global warming ? We are asking that here in Boulder where we have broken records the past two days for the coldest days on record. We had 4 inches of snow. The high the last 2 days was below 30F and the normal is 69F, and it smashed the previous records for these days by 10F. The low was about 18F and also a record low, well below the previous record low.
This is January weather (see the Rockies baseball playoff game was canceled on saturday and then played last night in below freezing weather).
Trenberth, K. E., 2009: An imperative for climate change planning: tracking Earth’s global energy. Current Opinion in Environmental Sustainability, 1, 19-27, doi:10.1016/j.cosust.2009.06.001. [1][PDF] (A PDF of the published version can be obtained from the author.)
***
The fact is that we can’t account for the lack of warming at the moment and it is a travesty that we can’t. The CERES data published in the August BAMS 09 supplement on 2008 shows there should be even more warming: but the data are surely wrong. Our observing system is inadequate.***
[edit on 26-11-2009 by IgnoranceIsntBlisss]
[edit on 26-11-2009 by IgnoranceIsntBlisss]
[edit on 26-11-2009 by IgnoranceIsntBlisss]
Hmm. It's strange that all of this is (allowed to be) coming to the surface right now, just before the Copenhagen meetings. I wonder why this is?
Something seems amiss. Regardless, hopefully people will realize what's going on and this treaty will be stopped.
If only the public had access to RAW data from places like NASA. One can only dream... er take action demanding this sort of data.
Just remember that if your hearing about it then it was allowed to be given to you. Why would they want you to think global warming is now a farce?
Originally posted by IgnoranceIsntBlisss
If only the public had access to RAW data from places like NASA. One can only dream... er take action demanding this sort of data.
NASA-GISS use the data from NCDC/NOAA. It's here:
ftp.ncdc.noaa.gov...
And if you want to believe schoolboy 'science' from a random guy like Mr Treadgold, that's your prerogative. Laughs aplenty at your credulous nature.
Urban Heat Island Effect is a major issue with land station data temps rising over the past 150 years.
So the siting of land stations has an important influence on measurements?
[edit on 26-11-2009 by melatonin]
reply to post by melatonin

Thats all you've got, eh? That's too bad.
I just posted a version of the above, on steroids:
*Beyond Climategate: Virtually all climate ’science’ temp. data is irrelevant and/or PHONY.
[edit on 26-11-2009 by IgnoranceIsntBlisss]
Thats all you've got, eh? That's too bad.
I just posted a version of the above, on steroids:
*Beyond Climategate: Virtually all climate ’science’ temp. data is irrelevant and/or PHONY.
[edit on 26-11-2009 by IgnoranceIsntBlisss]
Its not just New Zealand either, my own organisation (Bureau of Meteorology) is also suspected to be involved in this. Our internal email has been
going haywire with the climate change discussion, even before it was mentioned on ATS.
Here's one of the links I got emailed to me
wattsupwiththat.com...
Here's one of the links I got emailed to me
wattsupwiththat.com...
I wonder how much money these scientists are getting on the side to falsify data? If the money is followed then we would know who is paying them off.
We all know this leads back to the Bilderberg group. I suspect this is all one big ponzi scheme being erected.
Where are all the militant global warming fanatics at the moment?
Usually they're here denouncing everything us open-minded non-AGW-religion types do or say. Come on you SOB's - try and worm your way out of this one!
I'm going to laugh in one persons face the next time I see him - this whole facade is unravelling before his eyes and the eyes of the world, and everyone carries on as normal? Typical.
The Para.
I have been pretty silent until now on the whole 'Climategate' thing. But perhaps this is a good place to break that silence.
The e-mails, the exposure of improper placing of recording mechanisms, the lack of accuracy in predictions, are all both unsurprising and expected. WhoshotJR has a point. Why is this being allowed to surface now? The answer is simple and insidious. Because TPTB have already won!
Think about it; every major country in the world is bowing to pressures to implement Cap & Trade. Even the United States, the last and greatest hold-out, is buckling under the pressure and propaganda. Obama has full intentions of doing whatever is needed to implement Kyoto as well as any other treaties aimed at reducing CO2 emissions. The average person walking the street now believes in their heart that life on planet earth is doomed if carbon isn't removed from the ecosystem. Some even go as far as to accuse CO2 of being carcinogenic. It takes a long time to sway public opinion, and time is short. So sure, the data can now be shown; the battle is over. We already lost. Science already lost. Truth already lost. And Liberty is on her knees.
I must congratulate those who fought so tenaciously for Cap & Trade; I sincerely hope you like what you won. I am sure I will not like it; neither will I allow you to forget your position after you realize what it was you were fighting for.
Oh, and I also will not stop speaking the truth on this issue. Do not take this admission as a surrender. The battle may be over, but I do not make a habit of embracing lies for political expediency.
The war rages on.
TheRedneck
Originally posted by OzWeatherman
Its not just New Zealand either, my own organisation (Bureau of Meteorology) is also suspected to be involved in this. Our internal email has been going haywire with the climate change discussion, even before it was mentioned on ATS.
Here's one of the links I got emailed to me
wattsupwiththat.com...
And what did you think about it? Suspected to be involved in what?
Say a temp station is moved, it starts at 4m above sea level and collects data for a particular time, then they move the station to a new position at 125m above sea level. What happens to the measurements?
Do you just connect the measurements as if the move never happened (see Threadgold)?
Or do you try to adjust for the effect of moving the station (see NIWA)?
hot-topic.co.nz...
And remember:
Richard Treadgold (Random blogger playing at being scientist)
What did we find? First, the station histories are unremarkable. There are no reasons for any large corrections. But we were astonished to find that strong adjustments have indeed been made.
nzclimatescience.net... (see p6 for Welllington data)
The deception is obvious here, and its nothing to do with NIWA. And now, yeah, Treadgold is a random blogger. So is Watt at the Wattatwit blog - but he's like a black hole for the ignorant deniers.
More schoolboy attempts to smear climate scientists.
NIWA climate scientists have previously explained to members of the Coalition why such corrections must be made. NIWA’s Chief Climate Scientist, Dr David Wratt, says he’s very disappointed that the Coalition continue to ignore such advice and therefore to present misleading analyses.
NIWA 1
NIWA 2
And to see the double-think from IIB is great - 'Urban Warming is important! It biases measures. But don't ya go dare adjusting for siting effects' lol
ABE:
Posted by Oz
I dont want anyone to think that we are actually responsible for the deceit from these scientists
:sigh:
If a denier tells you the sky is blue, check out the window.
[edit on 26-11-2009 by melatonin]
Originally posted by melatonin
And what did you think about it? Suspected to be involved in what?
In altering observational data. We have a climate reseacrh centre and each state has its own climatic data centre. We have scientists dedicated to interpolating long term forecasts and future climatic conditions
Say a temp station is moved, it starts at 4m above sea level and collects data for a particular time, then they move the station to a new position at 125m above sea level. What happens to the measurements?
The temperature observations are changed. Its not only altitude that determinses temperatures. Like Ive said in the past, there's not enough observational data to determine if climate change is accurate.
Do you just connect the measurements as if the move never happened (see Threadgold)?
Our organisation does not. We only record data from when the station opens...if the station stops recording data it is closed. The data is still used, but its considered a different location to the new one
Or do you try to adjust for the effect of moving the station (see NIWA)?
No, because it wouldnt be considered a quality controlled observation
The deception is obvious here, and its nothing to do with NIWA. And now, yeah, Treadgold is a random blogger. So is Watt at the Wattatwit blog - but he's like a black hole for the ignorant deniers.
More schoolboy attempts to smear climate scientists.
NIWA climate scientists have previously explained to members of the Coalition why such corrections must be made. NIWA’s Chief Climate Scientist, Dr David Wratt, says he’s very disappointed that the Coalition continue to ignore such advice and therefore to present misleading analyses.
NIWA 1
NIWA 2
And to see the double-think from IIB is great - 'Urban Warming is important! It biases measures. But don't ya go dare adjusting for siting effects' lol
Well urban environments do increase temperatures. In Australia, all our observation stations are located at airports and air fields, all our screen temperatures are enclosed in stevenson screens (for quality control, ie sunshine and wind changes thermometer readings), and our equipment is always at least 25 metres from trees, building and any structure to avoid altered readings
These threads are all the same and getting old. Clutching at straws. You got nothing. Yawn.
But seriously, does this mean I can ride my fleet of Hummers guilt-free? Yeehaa!
But seriously, does this mean I can ride my fleet of Hummers guilt-free? Yeehaa!
Right.
So you say you don't connect the measurements as they could be considered two stations. Different places, non comparable. Didn't say it was only altitude. But altitude is important? You move up a slope and what?
But then you say you shouldn't correct, because of QC blah.
If you want a continuous measure over a period of time what do you do? The methods being used here are used by all climatology organisations.
Do you connect the two stations taking no account of the change of siting? We know that moving up the slope is going to lead to colder measurements on average. So the time series will have a serious systematic bias.
Or do you try to make an adjustment for the change of siting reducing the systematic bias as best as possible?
And when the methods are well-established, justified, and well-known where is the deceit?
ABE:
lets expand on this with data to illustrate. We have three sites. Three places. One is at 3m ( Thorndon), another at 4m (Airport), and one at 125m (Kellburn). Non-adjusted data show:
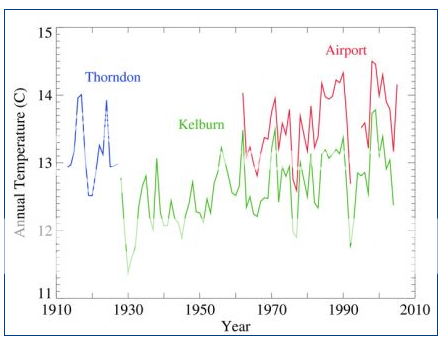
Clearly obvious that the higher site is showing cooler temps. No doubt. It's right there. The sites at 3m and 4m are warmer. Comparing the overlap at first glance for Airport (4m) and Kellburn (125m) shows very similar trends over time.
Lets adjust - we know that 3m is more similar to 4m than 125m. What happens if we remove the differences between 4m to 125m, but also reduce the 3m the same amount :
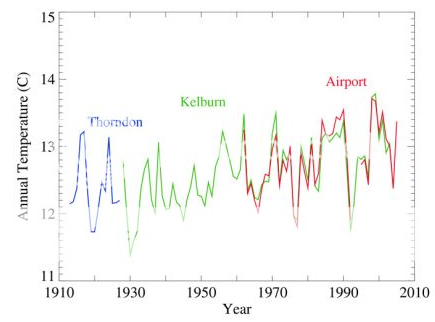
We can see that the trends are very similar between Airport and Kellburn. Very close indeed. Still minor differences. But much closer than before.
So the question is which series would be closer to the reality:
1. Just attach Thordon to Killburn as coherent time series without attempting to account for siting issues; or
2. Account and adjust for siting issues, then attach as coherent time series.
It's pretty obvious that altitude is very important and the moving of site must be adjusted for. Alternatively, you could be anal and say 'no, QC, can't attach at all!'
Fair enough, but then the deception is still Treadgold's, he doesn't even think this is important. At least these adjustments are a well-known and -established method.
And if we ignore Thorndon altogether, the temperature is still only going one way. Up.
[edit on 26-11-2009 by melatonin]
So you say you don't connect the measurements as they could be considered two stations. Different places, non comparable. Didn't say it was only altitude. But altitude is important? You move up a slope and what?
But then you say you shouldn't correct, because of QC blah.
If you want a continuous measure over a period of time what do you do? The methods being used here are used by all climatology organisations.
Do you connect the two stations taking no account of the change of siting? We know that moving up the slope is going to lead to colder measurements on average. So the time series will have a serious systematic bias.
Or do you try to make an adjustment for the change of siting reducing the systematic bias as best as possible?
And when the methods are well-established, justified, and well-known where is the deceit?
ABE:
lets expand on this with data to illustrate. We have three sites. Three places. One is at 3m ( Thorndon), another at 4m (Airport), and one at 125m (Kellburn). Non-adjusted data show:
Clearly obvious that the higher site is showing cooler temps. No doubt. It's right there. The sites at 3m and 4m are warmer. Comparing the overlap at first glance for Airport (4m) and Kellburn (125m) shows very similar trends over time.
Lets adjust - we know that 3m is more similar to 4m than 125m. What happens if we remove the differences between 4m to 125m, but also reduce the 3m the same amount :
We can see that the trends are very similar between Airport and Kellburn. Very close indeed. Still minor differences. But much closer than before.
So the question is which series would be closer to the reality:
1. Just attach Thordon to Killburn as coherent time series without attempting to account for siting issues; or
2. Account and adjust for siting issues, then attach as coherent time series.
It's pretty obvious that altitude is very important and the moving of site must be adjusted for. Alternatively, you could be anal and say 'no, QC, can't attach at all!'
Fair enough, but then the deception is still Treadgold's, he doesn't even think this is important. At least these adjustments are a well-known and -established method.
And if we ignore Thorndon altogether, the temperature is still only going one way. Up.
[edit on 26-11-2009 by melatonin]
Originally posted by melatonin
Right.
So you say you don't connect the measurements as they could be considered two stations. Different places, non comparable. Didn't say it was only altitude. But altitude is important? You move up a slope and what?
But then you say you shouldn't correct, because of QC blah.
Well obviously you move up a slope and the temperature cools right? What you do not do is try to interpolate that data to allow for the change in altitude, environment or whatever. Otherwise the data is incorrect
If you want a continuous measure over a period of time what do you do? The methods being used here are used by all climatology organisations.
Yes, and my organisation included. However I will no longer delve into the Bureaus involvement in this until all the details have been investigated...
Do you connect the two stations taking no account of the change of siting? We know that moving up the slope is going to lead to colder measurements on average. So the time series will have a serious systematic bias.
Yes, so it should not be included
Or do you try to make an adjustment for the change of siting reducing the systematic bias as best as possible?
No, never in any case should this be done
And when the methods are well-established, justified, and well-known where is the deceit?
[edit on 26-11-2009 by melatonin]
The alleged deceit is the alteration of the olderst climate readings we have, with no explanation
About half the adjustments actually created a warming trend where none existed; the other half greatly exaggerated existing warming. All the adjustments increased or even created a warming trend, with only one (Dunedin) going the other way and slightly reducing the original trend.
The shocking truth is that the oldest readings have been cranked way down and later readings artificially lifted to give a false impression of warming, as documented below. There is nothing in the station histories to warrant these adjustments and to date Dr Salinger and NIWA have not revealed why they did this.
So you're still going for deceit, even when these methods are well-established in forming temperature series?
You might not know of these methods, but they are well-established. Indeed, normal. So it is no more than your opinion that it shouldn't be done, those involved in making these climate measures think otherwise. And from a statistical point of view it makes pure sense (if you have a thermometer which has a bias of .5'C, you adjust for it).
If you want to extend the temperature series then you do use these methods. You can see above how well it works for Airport and Kelburn. The adjustment won't be perfect, but it is much much much more perfect than what this Treadgold dude has done (combining two sites at different altitudes with no indication and presenting it as a coherent temperature series).
Essentially, get the idea of 100% accuracy out of the equation. Isn't possible. For any direct measures you make for weather, or for these statistical methods. They all have unsystematic errors (and potentially systematic).
So which is most deceitful here? The method which is adjusting for an important systematic bias using well-known and -established approaches (NIWA) or the one that doesn't even mention a systematic bias and presents without adjustment or even thinks such biases are important (random blogger)?
Why are you accepting the claims of a random blogger over a group of active climate scientists who are using well-known methods. As the NIWA site says, they told these deniers about the adjustment years ago. They have an explanation. Jeez, I'm not even in climate science and I know about these sort of adjustments, lol. You have the explanation and the explanation has been known for donkey's. You might not agree for whatever reason, but it's well-established - statistcally and in this scientific field.
See edit as well.
[edit on 26-11-2009 by melatonin]
Too funny. "MANN made climate change"
Mel, so you say that data is reliable? I begged you that question et al and it seemed like you didnt actually answer it directly. You really helped me put "Beyond Climategate" together and I appreciate it
But really, how do you "correct" this:


Assuming the one doing the correcting has actually even been to the place.
Since sites like these exists its doubtful that any one person has seen every site, or that sites are even visited often to check teh condtitions.
[edit on 26-11-2009 by IgnoranceIsntBlisss]
Watt is free to present his 'station' photograph project data comparison any time he likes. However, people have already done it for him. And the
GHCN system works well adjusting for data biases. Indeed, the silence from wattatwit on this issue shows the data doesn't suit his game.
As for adjusting. In essence, as long as the site stays essentially the same, climate science is looking for trends. But adjustments are made for urban effects, siting changes, and other issues by using methods of homogenisation.
What looks silly, though, IIB is trying to argue that siting effects are important (urban effects) and then presenting a set of deceptive data with blatant siting issues which have been completely ignored (Treadgold), whilst attempting to criticise the actual system which does adjust for siting issues (NIWA/NCDC/GISS).
You can't have it both ways.
Comparison of 4 temperature anomaly measures - 2 satellite (RSS, UAH) and 2 station (NASA-GISS, HadCRU). They do a good job.
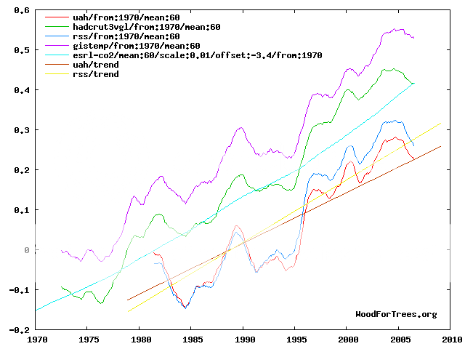
Each uses different baseline comparisions, so main differences due to that. But the satellite data is very comparable to adjusted surface datasets.
And you can compare the 70 best US surface stations (according to Watt) and the actual complete adjusted data here:
www.ncdc.noaa.gov...
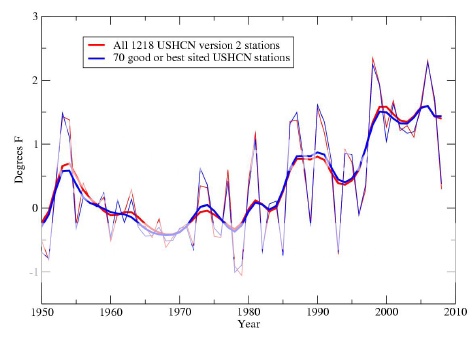
The adjustments do the job. But I suppose simple pictures of stations suffice for the job you want.
As for adjusting. In essence, as long as the site stays essentially the same, climate science is looking for trends. But adjustments are made for urban effects, siting changes, and other issues by using methods of homogenisation.
What looks silly, though, IIB is trying to argue that siting effects are important (urban effects) and then presenting a set of deceptive data with blatant siting issues which have been completely ignored (Treadgold), whilst attempting to criticise the actual system which does adjust for siting issues (NIWA/NCDC/GISS).
You can't have it both ways.
Comparison of 4 temperature anomaly measures - 2 satellite (RSS, UAH) and 2 station (NASA-GISS, HadCRU). They do a good job.
Each uses different baseline comparisions, so main differences due to that. But the satellite data is very comparable to adjusted surface datasets.
And you can compare the 70 best US surface stations (according to Watt) and the actual complete adjusted data here:
www.ncdc.noaa.gov...
The adjustments do the job. But I suppose simple pictures of stations suffice for the job you want.
reply to post by melatonin
"Adjustments"... hmm. Hansen doesnt happen to be the one overlooking the "correction" methodolgy is he?
Is the RAW data open for anyone to go download and attempt it themselves?
Its amazing that depending on humans (many in their yards) to go out day by day, for 100 years or so, and record the temps, amongst the other issues outlined herein, to come out so smooth and 'perfect'. Simply unbelievable.
Seeing what we're seeing in regards to data "correction" and "reconstructions" coming out of Climategate, I'm doubtful of the accuracy of "corrected" US land data.
new topics
-
whistleblower Captain Bill Uhouse on the Kingman UFO recovery
Aliens and UFOs: 2 hours ago -
1980s Arcade
General Chit Chat: 5 hours ago -
Deadpool and Wolverine
Movies: 5 hours ago -
Teenager makes chess history becoming the youngest challenger for the world championship crown
Other Current Events: 6 hours ago -
CIA botched its handling of sexual assault allegations, House intel report says
Breaking Alternative News: 7 hours ago -
Lawsuit Seeks to ‘Ban the Jab’ in Florida
Diseases and Pandemics: 10 hours ago
top topics
-
Lawsuit Seeks to ‘Ban the Jab’ in Florida
Diseases and Pandemics: 10 hours ago, 20 flags -
Starburst galaxy M82 - Webb Vs Hubble
Space Exploration: 12 hours ago, 11 flags -
CIA botched its handling of sexual assault allegations, House intel report says
Breaking Alternative News: 7 hours ago, 8 flags -
The Superstition of Full Moons Filling Hospitals Turns Out To Be True!
Medical Issues & Conspiracies: 14 hours ago, 8 flags -
IDF Intel Chief Resigns Over Hamas attack
Middle East Issues: 17 hours ago, 6 flags -
whistleblower Captain Bill Uhouse on the Kingman UFO recovery
Aliens and UFOs: 2 hours ago, 6 flags -
15 Unhealthiest Sodas On The Market
Health & Wellness: 12 hours ago, 5 flags -
Teenager makes chess history becoming the youngest challenger for the world championship crown
Other Current Events: 6 hours ago, 3 flags -
Deadpool and Wolverine
Movies: 5 hours ago, 3 flags -
1980s Arcade
General Chit Chat: 5 hours ago, 3 flags
active topics
-
New whistleblower Jason Sands speaks on Twitter Spaces last night.
Aliens and UFOs • 39 • : RookQueen2 -
23,000 Dead People Registered Within a Two Week Period In One State
US Political Madness • 39 • : Audreagassulke -
How ageing is" immune deficiency"
Medical Issues & Conspiracies • 25 • : Kenzo -
1980s Arcade
General Chit Chat • 7 • : Freeborn -
Europe declares war on Russia?
World War Three • 59 • : Freeborn -
George Knapp AMA on DI
Area 51 and other Facilities • 38 • : theshadowknows -
Candidate TRUMP Now Has Crazy Judge JUAN MERCHAN After Him - The Stormy Daniels Hush-Money Case.
Political Conspiracies • 618 • : WeMustCare -
-@TH3WH17ERABB17- -Q- ---TIME TO SHOW THE WORLD--- -Part- --44--
Dissecting Disinformation • 605 • : Ektar -
Teenager makes chess history becoming the youngest challenger for the world championship crown
Other Current Events • 3 • : Skinnerbot -
So you don't believe in the devil
Paranormal Studies • 143 • : burritocat