It looks like you're using an Ad Blocker.
Please white-list or disable AboveTopSecret.com in your ad-blocking tool.
Thank you.
Some features of ATS will be disabled while you continue to use an ad-blocker.

Quake Watch 2013
page: 39share:
reply to post by Wrabbit2000
I respectfully suggest that perhaps you might read back a few pages of this thread.
Believe me if I say it is unprecedented IT IS and I am not one to scaremonger, I just present the facts. I also consider myself to be a serious researcher
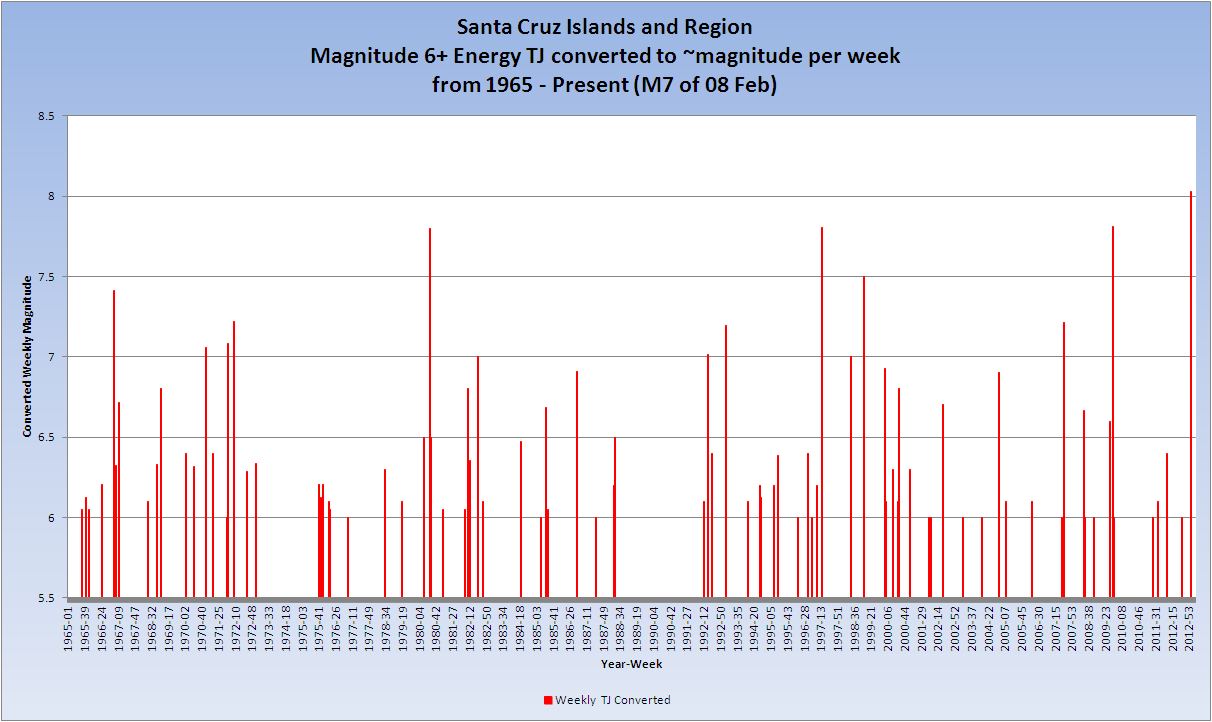
This chart goes from 1965 onwards as that is in my opinion a fairer representation. It is the energy of all Mag 6+ quakes in a given week summed and converted back to an Mw magnitude (all calcs approximate). You can see that the last bar is the biggest. This represents Mw 8.02 and is 2.14 times more energy than any of the three closest weeks.
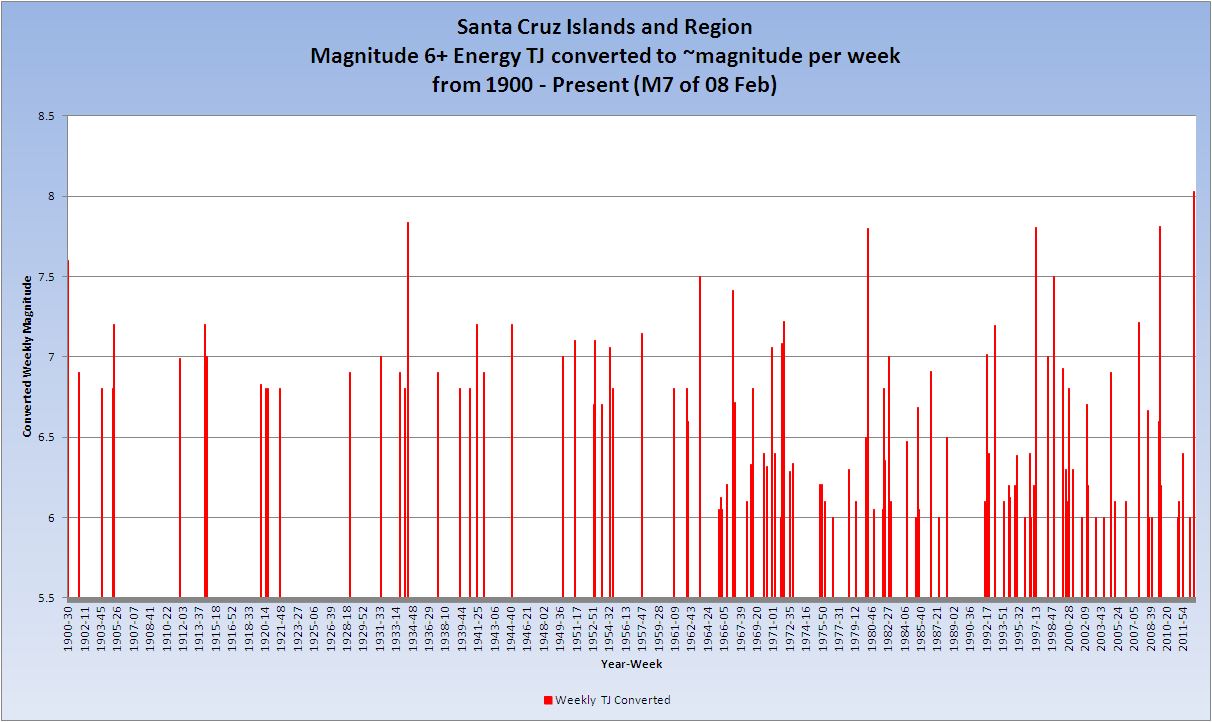
Just so that you know there was nothing in the earlier years that I am hiding, here is the same chart but from 1900.
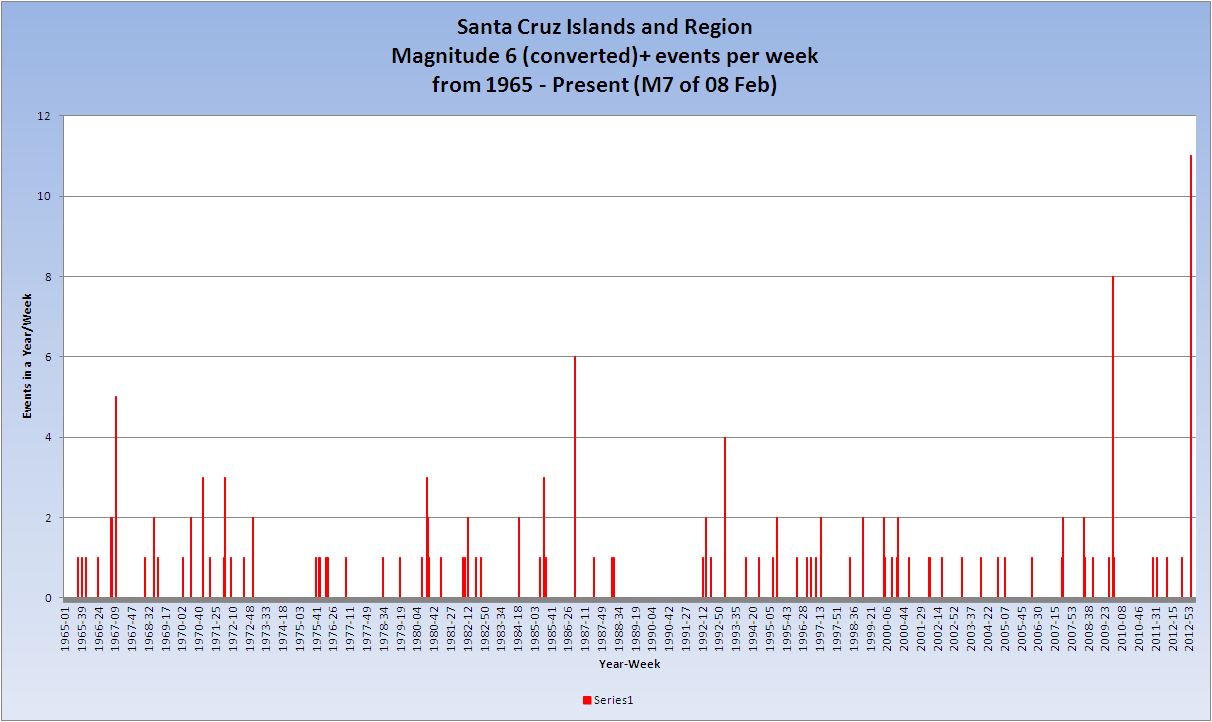
By the way if you prefer the number of events, which I do not normally use, here are the numbers of events in each week of Mag 6+ from 1965 onwards. By your criteria of numbers this current time is unprecedented - that is undeniable.
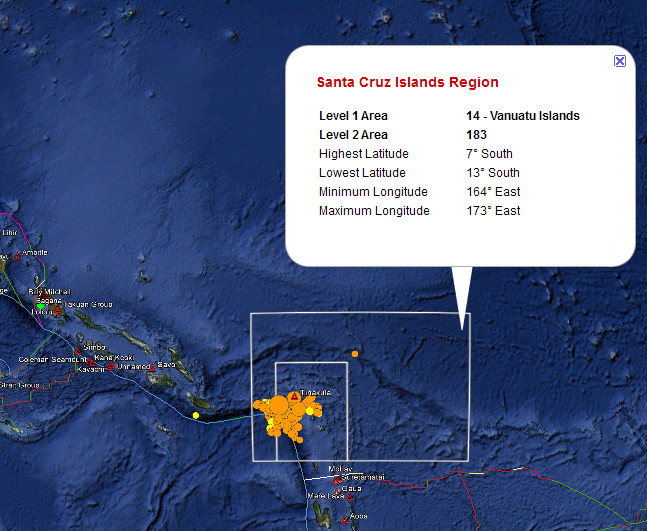
I am afraid that your arbitrary box is completely meaningless as far as Santa Cruz is concerned. You simply cannot lump such a large and seismically diverse area together in order to 'prove' your point.
Santa Cruz is clearly defined by Flynn-Engdahls as being in seismic area 14. In case you do not know where that is I have created an overlay in Google Earth.
You will see a couple of posts back that I have also roughly defined the subduction zone and it's enclosing transform zones. Note that these do NOT include the Solomon Islands or Papua New Guinea.
Okay, let's keep some perspective here and avoid terms like never or unprecedented. Those are terms for fear mongering reporters, IMO. Not serious researchers.
I respectfully suggest that perhaps you might read back a few pages of this thread.
Believe me if I say it is unprecedented IT IS and I am not one to scaremonger, I just present the facts. I also consider myself to be a serious researcher
This chart goes from 1965 onwards as that is in my opinion a fairer representation. It is the energy of all Mag 6+ quakes in a given week summed and converted back to an Mw magnitude (all calcs approximate). You can see that the last bar is the biggest. This represents Mw 8.02 and is 2.14 times more energy than any of the three closest weeks.

Just so that you know there was nothing in the earlier years that I am hiding, here is the same chart but from 1900.

By the way if you prefer the number of events, which I do not normally use, here are the numbers of events in each week of Mag 6+ from 1965 onwards. By your criteria of numbers this current time is unprecedented - that is undeniable.

I'm sure the epicenters aren't overlapping or perhaps even "close" for political boundaries on a map, but within that square? It's happened before and nothing much unprecedented here.....although interesting when taken with other activity around the Pacific Rim nations, indeed. I'm sure watching for what else develops anyway.
I am afraid that your arbitrary box is completely meaningless as far as Santa Cruz is concerned. You simply cannot lump such a large and seismically diverse area together in order to 'prove' your point.
Santa Cruz is clearly defined by Flynn-Engdahls as being in seismic area 14. In case you do not know where that is I have created an overlay in Google Earth.
You will see a couple of posts back that I have also roughly defined the subduction zone and it's enclosing transform zones. Note that these do NOT include the Solomon Islands or Papua New Guinea.
edit on 10/2/2013 by PuterMan because: (no reason given)
edit on 10/2/2013 by PuterMan because: (no reason given)
just a question...if you had a relative living within 50 metres of the coastline, would you be telling them to "be alert, but not alarmed".
the coastline being queensland, australia.
the coastline being queensland, australia.
edit on 10-2-2013 by bellagirl because: (no reason given)
reply to post by bellagirl
In my opinion, and see my disclaimer before taking in what I say, we are not going to see an event AT SANTA CRUZ that is likely to cause a tsunami on the Australian coast, but we don't know how much of this has been transferred to Vanuatu.
Having said that I believe that major quakes at Vanuatu, New Caledonia and the Loyalty Islands are not normally a tsunami threat to Australia.
reply to post by PuterMan
Thank you. i totally understand your disclaimer. this IS NOT an exact science, and i fully appreciate you answering me.
Thank you. i totally understand your disclaimer. this IS NOT an exact science, and i fully appreciate you answering me.
reply to post by PuterMan
Love your maps PM! And the animations.
Since I have zero graphics skills, I just searched around for a few more.
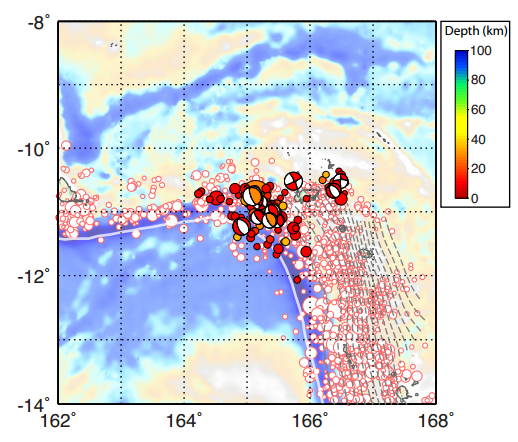
This second image is a one-page, 2.18MB pdf that shows three different cross-sections through the current Santa Cruz activity--with focal mechanisms and depths.
Source of both images is the bottom of the Mag 8.0 summary page.
So I remember a few months back, that you were thinking the Vanuatu region was possibly "due" for major movement.Does this Santa Cruz
outburst push Vanuatu closer to the breaking point?
ETA: I just read your last post.
Love your maps PM! And the animations.
Since I have zero graphics skills, I just searched around for a few more.
This second image is a one-page, 2.18MB pdf that shows three different cross-sections through the current Santa Cruz activity--with focal mechanisms and depths.
Source of both images is the bottom of the Mag 8.0 summary page.
So I remember a few months back, that you were thinking the Vanuatu region was possibly "due" for major movement.
ETA: I just read your last post.
edit on 2/10/2013 by Olivine because: add source
reply to post by bellagirl
I know your question was specifically those above 5, but you could have gone back to page 37 and counted the dots on the graph yourself.
Geez on that post I even gave the numbers in text brackets for each agency/network.
That is all out of date now anyway, the whole series from 28th January needs updating, which I am about to do
I might just abandon this Topic on here and post it on TrueAmericansThread I see another scout has been sent out to get some more customers p38
not very subtle
I know your question was specifically those above 5, but you could have gone back to page 37 and counted the dots on the graph yourself.
Geez on that post I even gave the numbers in text brackets for each agency/network.
That is all out of date now anyway, the whole series from 28th January needs updating, which I am about to do
I might just abandon this Topic on here and post it on TrueAmericansThread I see another scout has been sent out to get some more customers p38
Originally posted by Trexter Ziam
My note to self - see also: www.abovetopsecret.com... that started only 1 February 2013.
not very subtle
edit on 10-2-2013 by muzzy because: geez I'm a whiner aren't I
reply to post by muzzy
Sorry, I'm not a scout and I figured nobody reads back pages ... that note WAS for myself.
I've been a quake watcher daily since the 90's and this particular swarm has me on alert.
Sorry, I'm not a scout and I figured nobody reads back pages ... that note WAS for myself.
I've been a quake watcher daily since the 90's and this particular swarm has me on alert.
reply to post by Olivine
Nice pdf, I hadn't been back on that page for a while
the Plate edge Slope changes quite dramatically at the top of the "bend" by the look of those cross sections i.e. A-B compared to C-D
Nice pdf, I hadn't been back on that page for a while
the Plate edge Slope changes quite dramatically at the top of the "bend" by the look of those cross sections i.e. A-B compared to C-D
reply to post by Trexter Ziam
OK then, thought you were, 2nd post with a link, sorry then
A lot of space would be saved if people read from where they left off the last time they looked in.
I know myself a day away there can be a couple of pages of posts if things are busy.
I read back pages when I have time, but I haven't read the 709 page Yellowstone Thread yet
Maybe you can pop over there have a read and report back with a synopsis of what its all about and save me the bother of reading the back pages (sarcasam)
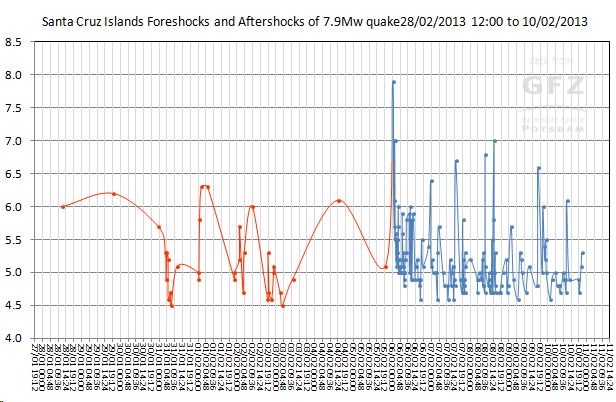
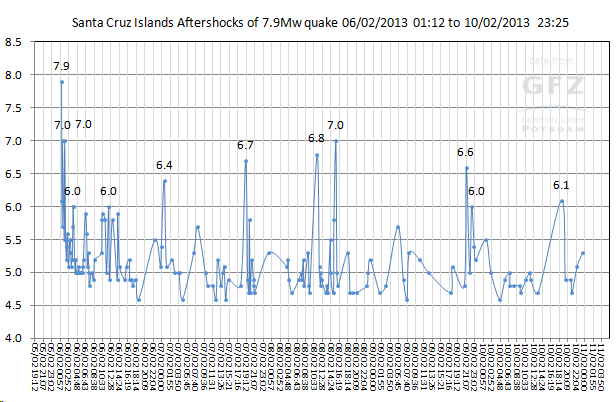
update on the Santa Cruz Graphs
sorry no links to maps on those just yet
the 2nd graph is a closeup of the blue part of the 1st graph (the aftershocks)
sorry no links to maps on those just yet
the 2nd graph is a closeup of the blue part of the 1st graph (the aftershocks)
As long as I follow this earthquake stuff (arround one year now, when I moved to Japan) I have never seen something so intense like in the Santa Cruz
region. So I really start to wonder how long this will keep going. I am really worried about the people there, they did not get much sleep the last 2
weeks. Must be really annoying and somehow stressful... I wonder in how far their normal life is somehow influenced by this quake swarms
edit
on 10-2-2013 by aLLeKs because: (no reason given)
Originally posted by bellagirl
just a question...if you had a relative living within 50 metres of the coastline, would you be telling them to "be alert, but not alarmed".
the coastline being queensland, australia.edit on 10-2-2013 by bellagirl because: (no reason given)
I have been saying this for a week. We have family there but they are all protected by Moreton Island. I think the whole of the coast from Sydeny to Cape York should be on a "watch and act: alert. If a huge tsunami is triggered it will take a few hours to reach Aus and give them time to get to higher ground, but it happens after 10:30 at night, many Queenslanders will not hear about it on the news as they tend to go to bed early up there.
reply to post by Olivine
Thanks for the PDF link Olivine.
Pretty much confirms my subduction/transform graphic (thank goodness). VERY complex area is Santa Cruz and extremely difficult to know where to target for my sawtooth stress chart which is why I have not been happy with it so far.
Thanks for the PDF link Olivine.
Pretty much confirms my subduction/transform graphic (thank goodness). VERY complex area is Santa Cruz and extremely difficult to know where to target for my sawtooth stress chart which is why I have not been happy with it so far.
reply to post by RoScoLaz
Sorry friend, your question seems to have been ignored in the rush of Santa Cruz posts.
Yes the correlation between earthquakes and volcanoes is normal as generally volcanoes are found above subduction zones such as border the ring of fire.
You may find this page: SUBDUCTION ZONE VOLCANISM informative.
Been back through the thread an cannot find where Muzzy was moaning about USGS and the mb quakes. Not long after one was changed to a mag 7.0 - which
I noted, but here is the curious thing. That one was 6.6mb changed to 7.0Mw. The other one was 6.4mb but that is now 7.1Mw. Odd!
earthquake.usgs.gov...
earthquake.usgs.gov...
Confounding Sequence of Big Quakes Rattle Santa Cruz Islands pg10
TrueAmerican post 1
www.abovetopsecret.com/forum/thread923000/pg10#pid15901172
Olivine
www.abovetopsecret.com/forum/thread923000/pg10#pid15901871
TrueAmerican post 2
www.abovetopsecret.com/forum/thread923000/pg10#pid15902045
Quake Watch 2013 pg39
PuterMan
www.abovetopsecret.com/forum/thread911913/pg39#pid15902678
Reconcile yourselves, this is not a real dispute... all the points are true and you two reveal a pedagogical problem, not any personal position.
Most disseminated tectonic maps have uninterrupted triangle spikes of subduction.
Historical Seismicity have purple colour.
Only focused maps of the region have the transform.
Combining Olivine's new USGS pdf and slabs help to constrain the boundary zone.
TrueAmerican post 1
www.abovetopsecret.com/forum/thread923000/pg10#pid15901172
On another note, anyone see any transform faults here?
neic.usgs.gov...
Ahh nope. Purple=subduction zone, green=transform fault, and ahh, I don't see no green. (At least not where others are reporting the northwestern side of that fault to be a transform fault, I don't.)
Just a note to the otherwise wise, making maps.
Olivine
www.abovetopsecret.com/forum/thread923000/pg10#pid15901871
TrueAmerican post 2
www.abovetopsecret.com/forum/thread923000/pg10#pid15902045
Quake Watch 2013 pg39
PuterMan
www.abovetopsecret.com/forum/thread911913/pg39#pid15902678
Thanks for the PDF link Olivine.
Pretty much confirms my subduction/transform graphic (thank goodness).
Reconcile yourselves, this is not a real dispute... all the points are true and you two reveal a pedagogical problem, not any personal position.
Most disseminated tectonic maps have uninterrupted triangle spikes of subduction.
Historical Seismicity have purple colour.
Only focused maps of the region have the transform.
Combining Olivine's new USGS pdf and slabs help to constrain the boundary zone.
reply to post by PuterMan
My intent was to note this is one of, if not THE most seismically active area of our planet in recent times. Fear mongering and scaring the crap out of people isn't a hard thing to do with 6's and 7's being tossed like every day events and not slowing down in any appreciable degree.
Now if we all run around using words like unprecedented (which is about as scientific as "I guess" for something like this), then people might get the impression this is a one time sequence of events that may hold some major importance beyond simply being a rather above average series of quakes. After all, it comes in an area known for activity FAR above the global average on the best of days or even, years.
(This I can support and with charts going a bit further back than your 1960's examples...after all, that actually stops JUST short of a very active global period...but then, you knew that, huh?)
"If you say it's unprecedented, it is? Okay.... for the record...if someone like TrueAmerican says that, I sit up and listen. If someone like Phage says that in his area of expertise and focus...I sit up quickly to take notes for my own checking later. If a person like Slayer says that about a well researched project ...I take notice.
Perhaps you also have professional and academic credentials to declare earthquake activity in a very unstable seismic zone to be unprecedented (Or just extensive and ..AHEM...sourced....support) ...but I missed them across the multiple messages basically telling people to pipe down, you have it all handled.
I'll leave ya to it though. I wouldn't want to add anything calming or point out how unremarkable this actually HAS been ....with series in that region, in recent years no less, following similar patterns. (Starting with the 8.1 in April of 2007). It happens....It always has happened...and it will continue to happen. Earth is a wonderful and changing place, isn't it?
I respectfully suggest that perhaps you might read back a few pages of this thread.
Believe me if I say it is unprecedented IT IS and I am not one to scaremonger, I just present the facts. I also consider myself to be a serious researcher
This chart goes from 1965 onwards as that is in my opinion a fairer representation. It is the energy of all Mag 6+ quakes in a given week summed and converted back to an Mw magnitude (all calcs approximate). You can see that the last bar is the biggest. This represents Mw 8.02 and is 2.14 times more energy than any of the three closest weeks.
My intent was to note this is one of, if not THE most seismically active area of our planet in recent times. Fear mongering and scaring the crap out of people isn't a hard thing to do with 6's and 7's being tossed like every day events and not slowing down in any appreciable degree.
Now if we all run around using words like unprecedented (which is about as scientific as "I guess" for something like this), then people might get the impression this is a one time sequence of events that may hold some major importance beyond simply being a rather above average series of quakes. After all, it comes in an area known for activity FAR above the global average on the best of days or even, years.
(This I can support and with charts going a bit further back than your 1960's examples...after all, that actually stops JUST short of a very active global period...but then, you knew that, huh?)
"If you say it's unprecedented, it is? Okay.... for the record...if someone like TrueAmerican says that, I sit up and listen. If someone like Phage says that in his area of expertise and focus...I sit up quickly to take notes for my own checking later. If a person like Slayer says that about a well researched project ...I take notice.
Perhaps you also have professional and academic credentials to declare earthquake activity in a very unstable seismic zone to be unprecedented (Or just extensive and ..AHEM...sourced....support) ...but I missed them across the multiple messages basically telling people to pipe down, you have it all handled.
I'll leave ya to it though. I wouldn't want to add anything calming or point out how unremarkable this actually HAS been ....with series in that region, in recent years no less, following similar patterns. (Starting with the 8.1 in April of 2007). It happens....It always has happened...and it will continue to happen. Earth is a wonderful and changing place, isn't it?
Unavco will be down for maintainence for a few hours. The PBO network is currently down, but the TA network seems okay for now. It looks like they
are improving the Boulder network. Here is their schedule for outages:
Outage
I also wanted to share 2 webpages I've found helpful for furthering my understanding of earthquake processes.
The first link is to Chris Rowan's Highly Allochthonous blog page on focal mechanisms. His diagrams make understanding the "beach balls" much easier.
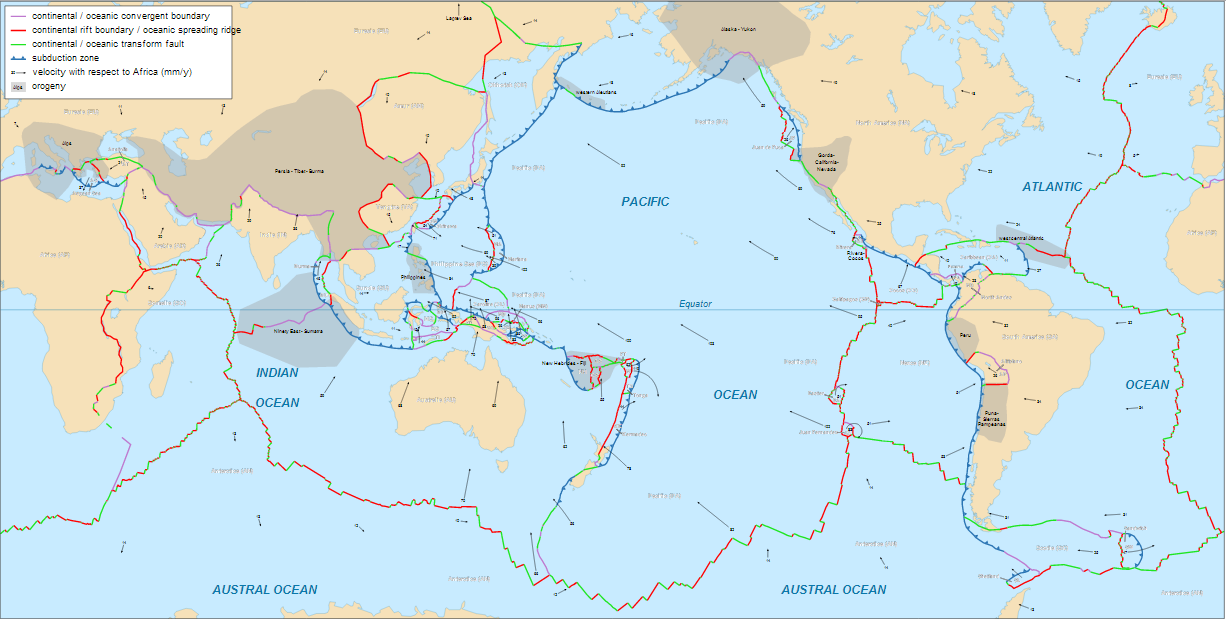
This second link leads to a huge tectonic plate boundary map that I found on wiki commons. I shrunk it 75% to show a preview.
 (click to expand--the link above is many times larger than this version)
From my 1st glance at this map, I didn't see anything I disagreed with, but I'm not intimately familar with many areas of the globe.
Outage Schedule
Phase 1: Monday, 2/11
3 hour outage commencing at 10 AM MST
Phase 2: Monday, 2/25
6 hour outage commencing at 8 AM MST
Phase 3: Monday, 3/18
2 hour morning outage commencing at 8 AM MST
Phase 4: Monday, 4/15
6 hour outage commencing at 8 AM MST
Outage
I also wanted to share 2 webpages I've found helpful for furthering my understanding of earthquake processes.
The first link is to Chris Rowan's Highly Allochthonous blog page on focal mechanisms. His diagrams make understanding the "beach balls" much easier.
This second link leads to a huge tectonic plate boundary map that I found on wiki commons. I shrunk it 75% to show a preview.
 (click to expand--the link above is many times larger than this version)
 From my 1st glance at this map, I didn't see anything I disagreed with, but I'm not intimately familar with many areas of the globe.
edit on
2/11/2013 by Olivine because: rewording
further to post by muzzy on pg38
On 10/02/2013 I noticed a sharp increase in deep quakes off the West Coast of both the North and South Islands of New Zealand that started around 5th Feb.. This calls for further investigation, to see if this has happened before, or is a new phenomenon with major changes to the Plate Boundary in process or perhaps could be related to events in other parts of the Pacific (Santa Cruz Mag 7.9Mw at the time of writing).
I have created 4 interactive maps using data from GNS. Nov, Dec2012 and Jan, Feb (so far) 2013
page here
The area of concern is shown on the February 2013 map;
2 quakes off Greymouth 404km and 278km,
2 off Hokitika, both mag 4's at 269km and 270km,
2 mag 3's NW off Cape Farewell at 323km and 325km,
4 mag 3 quakes in the North Taranaki Bight at 331km, 271km, 346km and 273,
a single 4.6 mag quake west of Auckland at 286km
and particularily 3 very deep mag 3's east and north east of the Alderman Islands (off Coromandel Pen.) at 578km, 531km, and 520km
The area down from the south end of the Havre Trough between the Coromandel Peninsula and White Island then through between Hamilton and Rotorua to Taumarunui, south of Mt Egmont, across the South Taranaki Bight and Tasman Bay to Kahurangi National Park (the blue icons) seems to be the norm for that depth ie 150-300km.
Anything west offshore of that "band" appears to be abnormal
The spill over off the South Island West Coast not so normal either.
November shows several deep events far off the North Island West Coast, but not the South Island.
Conclusion:
4 months of maps isn't enough to draw a conclusion, especially with Nov also showing those spill overs on the NI west coast, more research is required.
edit on 11-2-2013 by muzzy because: what the conclusion really is saying is "we don't need more funding, we just need any kind of funding at
all, so I can give up my day job and do this full time
reply to post by Olivine
Thanks for that Olivine. If anyone wants that map - the huge version - as a PNG file you can download it here It is 1.7 MB by the way.
Converted using this converter: free online image converter which converts to many formats from files or as in this case from a web page.
Forgot I came on to say that the Geophysical report for 08 Feb is done at last. Took ages!
edit on 11/2/2013 by PuterMan because: (no reason given)
new topics
-
BIDEN Admin Begins Planning For January 2025 Transition to a New President - Today is 4.26.2024.
2024 Elections: 5 hours ago -
Big Storms
Fragile Earth: 7 hours ago -
Where should Trump hold his next rally
2024 Elections: 9 hours ago -
Shocking Number of Voters are Open to Committing Election Fraud
US Political Madness: 10 hours ago -
Gov Kristi Noem Shot and Killed "Less Than Worthless Dog" and a 'Smelly Goat
2024 Elections: 11 hours ago -
Falkville Robot-Man
Aliens and UFOs: 11 hours ago
top topics
-
James O’Keefe: I have evidence that exposes the CIA, and it’s on camera.
Whistle Blowers and Leaked Documents: 12 hours ago, 17 flags -
Australian PM says the quiet part out loud - "free speech is a threat to democratic dicourse"...?!
New World Order: 13 hours ago, 15 flags -
Blast from the past: ATS Review Podcast, 2006: With All Three Amigos
Member PODcasts: 16 hours ago, 14 flags -
Biden "Happy To Debate Trump"
2024 Elections: 14 hours ago, 14 flags -
Ireland VS Globalists
Social Issues and Civil Unrest: 13 hours ago, 11 flags -
Mike Pinder The Moody Blues R.I.P.
Music: 16 hours ago, 9 flags -
BIDEN Admin Begins Planning For January 2025 Transition to a New President - Today is 4.26.2024.
2024 Elections: 5 hours ago, 9 flags -
Big Storms
Fragile Earth: 7 hours ago, 8 flags -
What is the white pill?
Philosophy and Metaphysics: 15 hours ago, 6 flags -
Shocking Number of Voters are Open to Committing Election Fraud
US Political Madness: 10 hours ago, 6 flags
active topics
-
A Warning to America: 25 Ways the US is Being Destroyed
New World Order • 30 • : glen200376 -
Eclipse picture taken by my son from the NH-ME border - Cool!
General Chit Chat • 26 • : EyeoftheHurricane -
University of Texas Instantly Shuts Down Anti Israel Protests
Education and Media • 319 • : CriticalStinker -
-@TH3WH17ERABB17- -Q- ---TIME TO SHOW THE WORLD--- -Part- --44--
Dissecting Disinformation • 705 • : cherokeetroy -
Falkville Robot-Man
Aliens and UFOs • 10 • : billxam1 -
Gov Kristi Noem Shot and Killed "Less Than Worthless Dog" and a 'Smelly Goat
2024 Elections • 64 • : cherokeetroy -
What is the white pill?
Philosophy and Metaphysics • 23 • : TheDiscoKing -
BIDEN Admin Begins Planning For January 2025 Transition to a New President - Today is 4.26.2024.
2024 Elections • 21 • : worldstarcountry -
Ditching physical money
History • 23 • : worldstarcountry -
Australian PM says the quiet part out loud - "free speech is a threat to democratic dicourse"...?!
New World Order • 9 • : ScarletDarkness