It looks like you're using an Ad Blocker.
Please white-list or disable AboveTopSecret.com in your ad-blocking tool.
Thank you.
Some features of ATS will be disabled while you continue to use an ad-blocker.

World's largest science group rejecting man-made climate fears
page: 7share:
Originally posted by rnaa
No, you quoted papers that made assertions that there are errors in the models, not that solar output is not considered in the models. I linked a report that showed at a glance that solar output was most definitely accounted for.
It was not being accounted for because the AGW scientists were claiming Solar activity had stopped increasing decades ago...
Look, found an article that deals with that same model/graph you gave and clearly shows what they CLAIM happened to Solar activity...
The correlation between solar activity and temperature
The most commonly cited study by skeptics is a study by scientists from Finland and Germany that finds the sun has been more active in the last 60 years than anytime in the past 1150 years (Usoskin 2005). They also found temperatures closely correlate to solar activity.
However, a crucial finding of the study was the correlation between solar activity and temperature ended around 1975. At that point, temperatures rose while solar activity stayed level. This led them to conclude "during these last 30 years the solar total irradiance, solar UV irradiance and cosmic ray flux has not shown any significant secular trend, so that at least this most recent warming episode must have another source."
www.skepticalscience.com...
Your graph/model does not show the increase in solar activity which was happening until recently, hence the GCMs were not accounting for Solar activity.
Originally posted by rnaa
Stop calling disagreements between interpretation of data a lie by one side or the other. At worst, it is a debate. The inclusion of solar output in climate models is neither a lie nor debatable, the results are published, available to anyone who wants to look. The data, the modeling software, and the results are available for examination by 'legitimate' researchers.
A debate?... no, the AGW scientists, politicians/policymakers, environmentalists etc have been claiming the "science is settled" and "there is no need for any more debate"...
They were, and still are trying to silence anyone trying to show the truth about the Global Warming hoax, and of course they had to also change the name of their hoax to Climate Change, but since the climate is always changing i guess we are going to be taxed forever just to fill the pockets of some and give them more power.
BTW, the AGWers were, and are not disagreeing on "interpretation of data", they were LYING about it. Even the observational data has been showing us the Suns activity had been increasing well after the 1970s.
Unlike some other stars our Sun's overall activity is linked, if one factor of the Sun's activity increases in activity, all other factors increase in activity as well.
Because of the difference in units of presentation, the values of AA* and Ap* are not the same so that different major magnetic storm onset and end threshold values are used for the two series. However their comparison for the years of overlapping coverage show that relative frequency of occurrence of major storms per year are similar. Another reason for differences is that an index derived from magnetic perturbation values at only two observatories easily experiences larger extreme values if either input site is well situated to the overhead ionospheric and.or field aligned current systems producing the magnetic storm effects. Although not documented here, it is interesting to note that the overall level of magnetic disturbance from year to year has increased substantially from a low around 1900 Also, the level of mean yearly aa is now much higher so that a year of minimum magnetic disturbances now is typically more disturbed than years at maximum disturbance levels before 1900.
www.ngdc.noaa.gov...
[atsimg]http://files.abovetopsecret.com/images/member/7c0bc3d5e611.jpg[/atsimg]
Notice how the above image shows the strength of magnetic storms on the Sun had been increasing until 2003, and the activity was still high until 2005 or so, which means it's overall activity had been increasing well after the 1970s and until very recently.
I had to post the image that small because it wouldn't fit at it's normal size. However it shows the increase in solar activity until 2003, and it was higher than in the 70s form 2003-2005.
It was in 2006 that the Sun's activity went to a record low. It was not in the 1970s like the AGW scientists claim.
Originally posted by rnaa
Your insistence on labeling scientists liars with respect to their methodology borders on defamation.
Your insistence in trying to dismiss the AGW scientists outright lies is bordering in the absurb, much so since you IMPLIED that my comments and research data is wrong, and I am misrepresenting the AGWers, which is like claiming I am lying... Stop trying to hide behind euphemisms to hide the truth.
Originally posted by rnaa
Since you refused to acknowledge the evidence in the link I provided earlier what's the point?. And no I can't be bothered to provide a link to any of the hundreds of papers that cover the issue from any number of different viewpoints. If you won't acknowledge the link I provided, and chase the links there, why should I bother.
Acknowledge that your rigged graph is the truth?... i just showed you that model/graph does not show the Sun's increasing activity since the 1970s, hence it does not account for the Sun's activity...
Originally posted by rnaa
Oh, snap. Might as well give you another chance.
I excerpted from that same website you gave and I showed that the activity of the Sun had been increasing WELL AFTER 1975, hence I still say the AGW scientists are LYING.
[edit on 4-8-2009 by ElectricUniverse]
Sun's Output Increasing in Possible Trend Fueling Global Warming
By Robert Roy Britt
Senior Science Writer
posted: 02:30 pm ET
20 March 2003
In what could be the simplest explanation for one component of global warming, a new study shows the Suns radiation has increased by .05 percent per decade since the late 1970s.
The increase would only be significant to Earth's climate if it has been going on for a century or more, said study leader Richard Willson, a Columbia University researcher also affiliated with NASA's Goddard Institute for Space Studies.
www.space.com...
The claim that Solar activity stopped increasing in the 1970s is nothing more than another LIE in the myriad of lies being presented by the AGWers as they try to get more control, and more money into their pockets.
BTW, again, Wilson's research was only for 24 years, from the 1978 until 2002, but other research shows the Sun's activity had been increasing for at least 100 years if not more.
[edit on 4-8-2009 by ElectricUniverse]
Originally posted by ElectricUniverse
Look, found an article that deals with that same model/graph you gave and clearly shows what they CLAIM happened to Solar activity...
The correlation between solar activity and temperature
The most commonly cited study by skeptics is a study by scientists from Finland and Germany that finds the sun has been more active in the last 60 years than anytime in the past 1150 years (Usoskin 2005). They also found temperatures closely correlate to solar activity.
However, a crucial finding of the study was the correlation between solar activity and temperature ended around 1975. At that point, temperatures rose while solar activity stayed level. This led them to conclude "during these last 30 years the solar total irradiance, solar UV irradiance and cosmic ray flux has not shown any significant secular trend, so that at least this most recent warming episode must have another source."
www.skepticalscience.com...
Your graph/model does not show the increase in solar activity which was happening until recently, hence the GCMs were not accounting for Solar activity.
You found it? That is the exact link I posted and the 2 of the 3 paragraphs I excerpted from it. As I predicted, you ignore it's point.
To sum up, you are saying that when they take into account solar activity and conclude that it does not match the temperature variation, that they are not taking into account solar activity.
That is an extremely disingenuous argument.
From that same web page, but maybe 6 inches below the excerpt we both quoted, we find a large list of papers that specifically take solar activity into account.
* Ammann 2007: "Although solar and volcanic effects appear to dominate most of the slow climate variations within the past thousand years, the impacts of greenhouse gases have dominated since the second half of the last century."
* Lockwood 2007 concludes "the observed rapid rise in global mean temperatures seen after 1985 cannot be ascribed to solar variability, whichever of the mechanism is invoked and no matter how much the solar variation is amplified."
* Foukal 2006 concludes "The variations measured from spacecraft since 1978 are too small to have contributed appreciably to accelerated global warming over the past 30 years."
* Scafetta 2006 says "since 1975 global warming has occurred much faster than could be reasonably expected from the sun alone."
* Usoskin 2005 conclude "during these last 30 years the solar total irradiance, solar UV irradiance and cosmic ray flux has not shown any significant secular trend, so that at least this most recent warming episode must have another source."
* Solanki 2004 reconstructs 11,400 years of sunspot numbers using radiocarbon concentrations, finding "solar variability is unlikely to have been the dominant cause of the strong warming during the past three decades".
* Haigh 2003 says "Observational data suggest that the Sun has influenced temperatures on decadal, centennial and millennial time-scales, but radiative forcing considerations and the results of energy-balance models and general circulation models suggest that the warming during the latter part of the 20th century cannot be ascribed entirely to solar effects."
* Stott 2003 increased climate model sensitivity to solar forcing and still found "most warming over the last 50 yr is likely to have been caused by increases in greenhouse gases."
* Solanki 2003 concludes "the Sun has contributed less than 30% of the global warming since 1970".
* Lean 1999 concludes "it is unlikely that Sun–climate relationships can account for much of the warming since 1970".
* Waple 1999 finds "little evidence to suggest that changes in irradiance are having a large impact on the current warming trend."
* Frolich 1998 concludes "solar radiative output trends contributed little of the 0.2°C increase in the global mean surface temperature in the past decade"
[edit on 4/8/2009 by rnaa]
[edit on 4/8/2009 by rnaa]
reply to post by rnaa
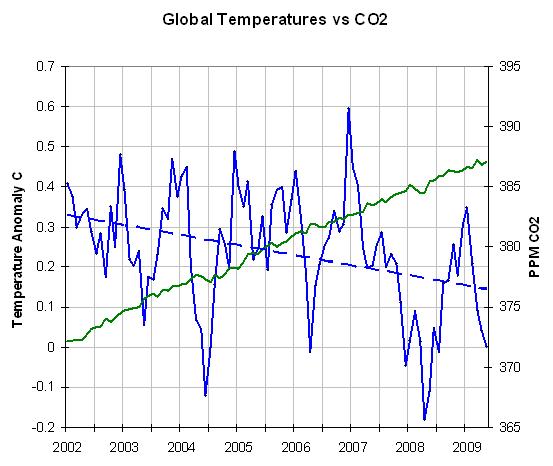
If there is a link between co2 and temperature how do you explain this graph? It shows an increase in co2 yet a decrease in temperature from 2002.Take it further the global temperature has been cooling for the past 11 years. So if all this co2 is supposed to cause the temperature to go up whats going on?
If there is a link between co2 and temperature how do you explain this graph? It shows an increase in co2 yet a decrease in temperature from 2002.Take it further the global temperature has been cooling for the past 11 years. So if all this co2 is supposed to cause the temperature to go up whats going on?
Originally posted by dragonridr
reply to post by rnaa
If there is a link between co2 and temperature how do you explain this graph? It shows an increase in co2 yet a decrease in temperature from 2002.Take it further the global temperature has been cooling for the past 11 years. So if all this co2 is supposed to cause the temperature to go up whats going on?
A short term overriding influence by La Nina. Please see: Global cooling in 2007 - has global warming ended?
Notice that this article also takes the current Solar Minimum into account and shows that that does not account for the cooling either.
Originally posted by rnaa
You found it? That is the exact link I posted and the 2 of the 3 paragraphs I excerpted from it. As I predicted, you ignore it's point.
And you obviously don't know how to read.
First of all, yes I found that link before I saw you post.
Second of all, they are not taking into account solar activity because they claim, as anyone who can actually read can see in both excerpts we posted, that solar activity stayed level since 1975 onwards, which sorry to say IS A LIE.
I presented evidence that solar activity had continued to increase well after 1975. But of course, you like other AGWers dismiss the evidence and instead post more CLAIMS from AGWers who would rather lie, than stand up and tell the truth.
The only disengenious argument is yours. I asked for EVIDENCE not CLAIMS, if you don't understand the difference between the two you know less about the scientific method than you claim you do.
BTW, more CLAIMS are not going to debunk the EVIDENCE which refutes this claim that "solar activity has been level since 1975"...
Even if the Sun was not the only natural factor affecting the climate on Earth, and if you try to discount all other factors, such as the fact that the Earth's magnetic field has been weakening since around 1845, it is still no proof of CO2 being the cause for the increased temperatures.
It is a well known fact that during warming cycles atmospheric water vapor also increases in level, and water vapor is a far more potent GHG than CO2 will ever be.
Originally posted by ElectricUniverse
It is a well known fact that during warming cycles atmospheric water vapor also increases in level, and water vapor is a far more potent GHG than CO2 will ever be.
Well, yes water vapor is more potent than Co2 as a GHG, not on a "molecule by molecule" basis, but on a "what wavelengths it absorbs" basis. What is your point?
The atmosphere is more or less saturated with water vapor, otherwise there would be no rain. Rain is the atmosphere's way of saying 'I can't absorb any more water'. So no matter how much water vapor we dump into atmosphere, it just comes out as rain in a few days, or couple of weeks. And anyway, its being added in the lower atmosphere, and its the upper atmosphere where the greenhouse effect is cooking.
Except that, you are right again, as the atmosphere warms up it can hold more water vapor, which means its contribution to GW increases. But which came first, the chicken or the egg? Did additional water vapor 'cause' the warming or did warming cause the atmosphere to hold more water?
The answer is that the warming trend initiated by CO2 and other manmade GHGs caused the atmosphere to warm up which increased its ability to store WV which caused more warming which allows even more WV to be stored and all the while CO2 continues to build cause even more warming and allowing even more WV to be stored... (ok, take a breath now, you get the picture).
It is a feedback loop. A deadly embrace feedback loop. Man has kicked off a chain of events, and unless he does something about it, nature will take justice into its own hands.
[edit on 5/8/2009 by rnaa]
Originally posted by ElectricUniverse
Second of all, they are not taking into account solar activity because they claim, as anyone who can actually read can see in both excerpts we posted, that solar activity stayed level since 1975 onwards, which sorry to say IS A LIE.
Please understand this before you post again: when something doesn't have an effect on a final result it does not mean that it is not being taken into account. All it means is that its effect is hidden by other factors and doesn't affect the result as much as something else. When the point is to locate the main 'culprit', eliminating possibles is precisely taking all possibles into account.
Please provide a link to the dataset that you claims shows an increase since 1975? All reports that I can find of data for the period between 1976 and 2006 show a virtually flat least square analysis.
Solar Forcing of Climate
Foukal 2006 shows analyses the data from 1978 to 2006. Please point out where in his data there is an upward trend, or indicate where his data is wrong. Foukal's paper shows that the variation in TSI would have to be 10 times its actual value to account for the temperature changes that have been observed for the last few decades.
Please review that paper, if nothing else look at his dataset graphs showing TSI from 1978 to 2006. Do they show an upward trend? Does this paper addressing the affects of TSI on Climate Change show a reluctance by scientists to address the affects of TSI on Climate Change?
Please be more careful about calling people liars. People who live in glass houses and all that...
I presented evidence that solar activity had continued to increase well after 1975.
I don't see where you presented that evidence, but I will scroll back through your posts and see if I can find it. Because I can't find any such evidence, just the opposite.
EDIT: I see! You are not talking about TSI, the Climatologists are talking about TSI. You are talking about magnetic storm activity that would be affecting the magnetosphere. I can't comment on that at the moment, I'll have to do a bit of research.
My admonition stands: please be careful about calling people liars. Make sure you know what they are talking about.
[edit on 5/8/2009 by rnaa]
Originally posted by rnaa
Well, yes water vapor is more potent than Co2 as a GHG, not on a "molecule by molecule" basis, but on a "what wavelengths it absorbs" basis. What is your point?
Even on a "molecule by molecule basis" water vapor is a far worse GHG than CO2 will ever be, and it means that since in warming cycles water vapor increases in levels, it causes more warming, apart from the Sun having the highest activity for at least 100 years than at any time in 1,000 years during most of the time the Earth was warming. Hence you can't claim that "CO2 is the cause of the warming".
Originally posted by rnaa
The answer is that the warming trend initiated by CO2 and other manmade GHGs caused the atmosphere to warm up which increased its ability to store WV which caused more warming which allows even more WV to be stored and all the while CO2 continues to build cause even more warming and allowing even more WV to be stored... (ok, take a breath now, you get the picture).
cough ...BS...cough... The Earth had been warming WELL before atmospheric CO2 levels even began to increase... CO2 levels did not begin to increase until about 1886-1900s, and the Earth had been warming in most of the world since the 1600s. In some parts of the world the warming began even in the 1500s, so your "egg before the chicken" scenario for "CO2 being the cause" is nothing more than another red herring.
www.ncdc.noaa.gov...
Not to mention the fact that when Hansen is not looking around information such as the following is released by NASA.
Current warmth seems to be occurring nearly everywhere at the same time and is largest at high latitudes in the Northern Hemisphere. Over the last 50 years, the largest annual and seasonal warmings have occurred in Alaska, Siberia and the Antarctic Peninsula. Most ocean areas have warmed. Because these areas are remote and far away from major cities, it is clear to climatologists that the warming is not due to the influence of pollution from urban areas.
www.nasa.gov...
You would think that if CO2 was the cause of so much warming the places that would warm the most would be those closest to largest cities, but then first you have to differentiate the "urban heat island effect" from the real warming in cities, but even then the places that have warmed the most have been FAR AWAY FROM MAJOR CITIES.
So anyway you want to look at it atmospheric CO2 does not cause the warming "CLAIMED" by the AGWers, and it certainly is not to be blamed for the ongoing "Climate Change".
[edit on 5-8-2009 by ElectricUniverse]
Originally posted by ElectricUniverse
[atsimg]http://files.abovetopsecret.com/images/member/7c0bc3d5e611.jpg[/atsimg]
Notice how the above image shows the strength of magnetic storms on the Sun had been increasing until 2003, and the activity was still high until 2005 or so, which means it's overall activity had been increasing well after the 1970s and until very recently.
-----------
If you follow your own link above, you will find a link to a graph showing the sunspot counts and the aa values peaks and troughs correlate exactly. Furthermore, it shows that the peak aa strength was before 1960, and has trended down since then.
(sorry about the size of the image - use the slider to shift it)
Total Solar Irradiance (TSI) closely follows the sunspot cycle, the more sunspots, the cooler the Sun, fewer the hotter it is. Since sunspots are magnetic storms, you would expect the correlation shown in the graph.
However, there is no indication, anywhere, that indicates that the strength of the sunspot storm has any correlation to TSI. The correlation is to the number of storms (sunspots) not strength.
Here is more data you say is being ignored from the period after 1978. Perhaps you think it is something to do with cosmic rays? UV? This image from New Scientist
No long term trend matching the temperature increase line anywhere.
(again, sorry about the size of the image - use the slider to shift it)
As to the TSI data since 1978, there is no one continuous dataset (apparently due to the Challenger disaster) so researchers have had to extrapolate the missing data. Two research groups have responded slightly differently to the problem and come up with different results: either there is a very slight upward trend or there is a very slight downward trend in the TSI between 1989 and 1991. This discrepancy makes the difference between a slightly downward trend or an almost flat trend for the entire 1978 to 2005 dataset.
In no way is there anything resembling an upward trend significant enough to account for the observed temperature rise during that period.
The data is not being ignored, it is being analyzed very closely, with probably more than a dozen papers coming to the same conclusion: change in solar radiation is not driving the unprecedented temperature change since the 1970's.
[edit on 5/8/2009 by rnaa]
Originally posted by rnaa
Please understand this before you post again: when something doesn't have an effect on a final result it does not mean that it is not being taken into account. All it means is that its effect is hidden by other factors and doesn't affect the result as much as something else. When the point is to locate the main 'culprit', eliminating possibles is precisely taking all possibles into account.
BS, they CLAIM solar activity leveled since 1975, and that it hasn't increased since then, hence this is the reason why they claim the Sun couldn't have contributed to the warming.
Please understand what you read before you respond again...and again here are the most pertinent parts, and BTW I ALREADY provided two different sets of data, one the "MAJOR MAGNETIC STORMS 1868-2007
ACCORDING TO THE AA* CRITERIA" which, once again...can be found here... www.ngdc.noaa.gov... and which shows the Sun's major magnetic storms had been increasing well beyong 1975.
Now please do tell me that you do know it is a fact that when any factors in the activity of the Sun increases it means all others increase.... You know this right?... You do know that the number of Sunspots is always affected by the Sun's magnetic field, and it's strength. Not to mention that also the Solar wind activity also increases, and of course TSI increases as well when the magnetic field of the Sun increases in intensity...
We also know as a matter of fact that in 2006 when the Sun's conveyor belt slowed down to a crawl ALL solar activity slowed down to a crawl, and it has remained very low for the last 3 years.
Anyway, the second set of data came from solar scientist Willson, who is afiliated with NASA, as well as being a University of Columbia researcher.
Sun's Output Increasing in Possible Trend Fueling Global Warming
By Robert Roy Britt
Senior Science Writer
posted: 02:30 pm ET
20 March 2003
In what could be the simplest explanation for one component of global warming, a new study shows the Suns radiation has increased by .05 percent per decade since the late 1970s.
The increase would only be significant to Earth's climate if it has been going on for a century or more, said study leader Richard Willson, a Columbia University researcher also affiliated with NASA's Goddard Institute for Space Studies.
www.space.com...
Now, if you are going to respond to the above research first do yourself a favor and READ the first posts that I amde about these research before you ASK AGAIN.
Please provide a link to the dataset that you claims shows an increase since 1975? All reports that I can find of data for the period between 1976 and 2006 show a virtually flat least square analysis.
Solar Forcing of Climate
Foukal 2006 shows analyses the data from 1978 to 2006. Please point out where in his data there is an upward trend, or indicate where his data is wrong. Foukal's paper shows that the variation in TSI would have to be 10 times its actual value to account for the temperature changes that have been observed for the last few decades.
Please review that paper, if nothing else look at his dataset graphs showing TSI from 1978 to 2006. Do they show an upward trend? Does this paper addressing the affects of TSI on Climate Change show a reluctance by scientists to address the affects of TSI on Climate Change?
Please be more careful about calling people liars. People who live in glass houses and all that...
Originally posted by rnaa
I don't see where you presented that evidence, but I will scroll back through your posts and see if I can find it. Because I can't find any such evidence, just the opposite.
Twice now I gave such evidence...and the research paper by Wilson clearly states that during the 24 year time period of his research from 1978-2002 he saw an increase in TSI. As I stated before OTHER research has pointed tothe fact that this increase has been ongoing well before 1978 also, and in fact the increase has been for about 100 years if not more.
Originally posted by rnaa
EDIT: I see! You are not talking about TSI, the Climatologists are talking about TSI. You are talking about magnetic storm activity that would be affecting the magnetosphere. I can't comment on that at the moment, I'll have to do a bit of research.
TSI is dependent on Sunspots levels also and Sunspots are dependant on the magnetic field of the Sun, so an increase in major magnetic storms points to an increase in TSI. Anyway...
Originally posted by rnaa
My admonition stands: please be careful about calling people liars. Make sure you know what they are talking about.
Oh I know what I am talking about, but by your above response about the magnetic storm activity not showing a trend on TSI and other activity factors on the Sun, it is clear that you don't know what you are talking about.
Now let me show you the results of fewer magnetic storms in the Sun.
The sun has entered its weakest cycle of magnetic activity since 1928, meaning fewer solar flares and coronal mass ejections, scientists predicted in a May 8 teleconference.
www.sciencenews.org...
[edit on 5-8-2009 by ElectricUniverse]
Originally posted by rnaa
...............
Total Solar Irradiance (TSI) closely follows the sunspot cycle, the more sunspots, the cooler the Sun, fewer the hotter it is. Since sunspots are magnetic storms, you would expect the correlation shown in the graph.
.............
And you keep being wrong. The more Sunspots THE HOTTER THE SUN IS, not the contrary.
I am thinking you just checked some website and you misrepresented what it was saying.
The dark spots that you see during sunspots is nothing more than the Sun's corona opening a hole, umbra, that allows you to see the Sun's surface, since the Sun's surface is cooler than the corona, you see the center of Sunspots as "dark spots", but the area around the sunspots, penumbra, is much lighter, and much hotter than the rest of the Sun.
On overall the Sun gets HOTTER during higher Sunspot ativity.
Here is a site that explains it on laymen's terms.
Although sunspots are cooler areas on the solar surface, the Sun is actually hotter when sunspots appear and cooler when they are absent. Scientists believe that a long period of solar inactivity may correspond with colder temperatures on Earth. From 1645 to 1715, astronomers observed very little solar activity. This time period coincides with an era known as the Little Ice Age, when rivers and lakes throughout Europe (and perhaps the world) froze.
www.firstscience.com...
But worry not, it is a common misconception a lot of people make because they think that the dark umbra which shows up as dark patches shows a cooler Sun, but that is not the truth, in fact with more Sunspots the Sun gets hotter, and TSI increases.
Again, unlike many other stars, when one factor of the Sun's activity increases it actually tells us that all other activity is in fact also increasing.
[edit on 5-8-2009 by ElectricUniverse]
Originally posted by ElectricUniverse
...
You would think that if CO2 was the cause of so much warming the places that would warm the most would be those closest to largest cities, but then first you have to differentiate the "urban heat island effect" from the real warming in cities, but even then the places that have warmed the most have been FAR AWAY FROM MAJOR CITIES.
No, I wouldn't think that. Perhaps you could familiarize yourself with the basic physics, interrelated processes, and feedback loops involved. I recommend a good place to start is Skeptical Science
Greenhouse operates in the upper atmosphere. Cities warm up the local lower atmosphere.
The atmosphere is saturated with water vapor, thats why it rains. The only way to get more water into the atmosphere is to warm it up. The rise in CO2 is the major contributer to dramatically warming the atmosphere outside its 'nominal' range, which allows the atmosphere to hold more water in a feedback loop.
The observed sharp increase in CO2 has been cause by Human activity. The observed sharp increase in global temperature directly correlates to the increase in CO2. No other possible forcing agent comes close to CO2 as an agent driving that sharp change. None of that is opinion or modeling, all of it is directly observed data.
So anyway you want to look at it atmospheric CO2 does not cause the warming "CLAIMED" by the AGWers, and it certainly is not to be blamed for the ongoing "Climate Change".
Anyway you look at it, CO2 is the major forcing cause of Global Warming, not the only cause, but far and away the major cause.
This thread is *STILL* going?
Geesh...
Worse than the Birther thread...
Geesh...
Worse than the Birther thread...
Originally posted by HunkaHunka
This thread is *STILL* going?
Geesh...
Worse than the Birther thread...
No worries, we know by your own admission that you don't accept any data, and you think that only "belief' can carry you through in topics such as this one. That is until your "belief" is wrong, and at least on this topic it is wrong, so keep "believing" whatever you want....
[edit on 5-8-2009 by ElectricUniverse]
Originally posted by ElectricUniverse
BS, they CLAIM solar activity leveled since 1975, and that it hasn't increased since then, hence this is the reason why they claim the Sun couldn't have contributed to the warming.
Please understand what you read before you respond again...and again here are the most pertinent parts, and BTW I ALREADY provided two different sets of data, one the "MAJOR MAGNETIC STORMS 1868-2007
ACCORDING TO THE AA* CRITERIA" which, once again...can be found here... www.ngdc.noaa.gov... and which shows the Sun's major magnetic storms had been increasing well beyong 1975.
I am sorry, you have outdone yourself. The web page you link here is exactly the one you linked before, and I visited and read, (which obviously you did not), and drilled down to the more detailed image (which obviously you did not) which I embedded in the very post you are responding to here.
The large detailed image does NOT show an increase, it shows a stock standard 11 year solar cycle and decreasing aa values beyond 1975. There is absolutely nothing out of the ordinary in the data.
If you can't even read your own 'evidence' you really should give up.
The current solar cycle 24 is slow to get started, so there is maybe a little extra warming that we 'normally' wouldn't get, but it is NOT outside the boundary range of the TSI and it certainly is not great enough to drive the observed temperature change.
Anyway, the second set of data came from solar scientist Willson, who is afiliated with NASA, as well as being a University of Columbia researcher.
OK, I know of the Wilson work in 2003. There has been much work since that paper, and a lot of other work has been done since. The dozen or so papers I quoted earlier refute Wilson pretty thoroughly.
Originally posted by rnaa
No, I wouldn't think that. Perhaps you could familiarize yourself with the basic physics, interrelated processes, and feedback loops involved. I recommend a good place to start is
ooh please... stop talking about how I " should learn the basic physics" when you have shown a total lack of knowledge on this topic.
I have read as much as I can take from the "believers" in AGW as I can without puking.
I recommend you read from real scientists such as Dr. Akasofu.
Dr. Syun-Ichi Akasofu, IARC Founding Director and Professor of Physics, Emeritus, was the the director of the International Arctic Research Center of the University of Alaska Fairbanks from its establishment in 1998 until January of 2007. He originally came to the University of Alaska Fairbanks in 1958 as a graduate student to study the aurora under Sydney Chapman, receiving his PhD in 1961. He has been professor of geophysics since 1964. Dr. Akasofu has published more than 550 professional journal articles, authored and co-authored 10 books and has been the invited author of many encyclopedia articles. He has collaborated with numerous colleagues nationally and internationally, and has guided nine students to their Ph.D. degrees.
www.iarc.uaf.edu...
There are several other real scientists who are trying to spread the truth, such as Prof. Lindzen, Prof. Gray, etc.
Originally posted by rnaa
Greenhouse operates in the upper atmosphere. Cities warm up the local lower atmosphere.
What?.... What are you talking about?... in the upper atmospheric layers GHGs such as CO2 and even water vapor act to COOL those layers, not to warm them....
The one layer of Earth's atmosphere where GHGs retain energy to warm that layer which affects the surface's temperature is the "Troposphere", and in the Troposphere water vapor accounts for at least 95%, and some scientists state it accounts for 97% and up to 98% of the greenhouse effect, meanwhile CO2 and the other GHGs account for the other 2% - 5% of the greenhouse effect.
The Troposphere is the most important layer, and that is where most weather events occur, and it is the one atmospheric layer that affects surface temperatures.
Given the present composition of the atmosphere, the contribution to the total heating rate in the troposphere is around 5 percent from carbon dioxide and around 95 percent from water vapor.
www.eia.doe.gov...
In the Stratosphere the roles reverse, but the stratosphere does not affect surface temperatures.
Originally posted by rnaa
The atmosphere is saturated with water vapor, thats why it rains. The only way to get more water into the atmosphere is to warm it up. The rise in CO2 is the major contributer to dramatically warming the atmosphere outside its 'nominal' range, which allows the atmosphere to hold more water in a feedback loop.
I know that some people believe that if they keep telling themselves lies, and made up claims for those people the lies, and made up claims becomes the truth, but c'mon, at least stop embarrassing yourself already....
Originally posted by rnaa
The observed sharp increase in CO2 has been cause by Human activity. The observed sharp increase in global temperature directly correlates to the increase in CO2. No other possible forcing agent comes close to CO2 as an agent driving that sharp change. None of that is opinion or modeling, all of it is directly observed data.
Wrong again... Natural emissions of CO2 are much higher than manmade emissions of CO2.
Approximately natural emissions of CO2 is about 150 billion tonnes carbon per year, emitted as CO2 from biological respiration on land, including about 60 billion tonnes carbon per year from microbial and animal respiration. Manmade CO2 levels are NOWHERE to the levels emitted by natural sources, and this comes from the IPCC....
Originally posted by rnaa
Anyway you look at it, CO2 is the major forcing cause of Global Warming, not the only cause, but far and away the major cause.
BS, where is the proof of this?... all you have shown are CLAIMS, but no PROOF, and no EVIDENCE.
Again, you should stop it because you keep embarrassing yourself.
[edit on 5-8-2009 by ElectricUniverse]
reply to post by rnaa
I have outdone myself?...
For crying out lout you make this statement even after you claim that less Sunspots means the Sun gets hotter and more Sunspots means the Sun gets cooler when it is the contrary?....apart from your other erroneous claims?...
BTW, you keep showing nothing more than ignorance in this topic, that sharp increase in the 1970s does not follow a trend that ends in the 1970s...you have to look at the trend...and what you showed is a rendering by hand of the data... The image I gave is the data itself, and not a representation by hand of the data...
Again, this is what a scientist has to say about the TSI, and not what you CLAIM. Obviously you are not as informed about this topic as you tried to claim earlier on....
www.space.com...
BTW, once again yes the trend had been an increase in the Sun's overall activity even before the 24 year research led by Willson which started in 1978 and ended in 2002, and in which he states the TSI had been increasing by 0.05% per decade.
One more thing you obviously are not aware of, as far as we know the Sun constitutes 98.99% of all matter in the Solar System.
So the Sun is the biggest factor in the Solar System which affects Climate Change, after that is the oceans which retain more heat than the atmosphere does, and the oceans are Earth's great heat storage.
During periods of increased solar activity the oceans absorb, and retain more heat, and it takes a lot longer for the oceans to lose this stored heat than it does for the atmosphere.
The regions of space through which the Solar Sytem goes through influences the climate also, and if the changes in the region of space the Solar System goes through is large enough, then this will affect the Sun and the dynamics of the Solar System which in turn affects the climate.
Then after the oceans, water vapor is a major factor, and the last tidy bity factor which is minimal is CO2.
[edit on 5-8-2009 by ElectricUniverse]
I have outdone myself?...
For crying out lout you make this statement even after you claim that less Sunspots means the Sun gets hotter and more Sunspots means the Sun gets cooler when it is the contrary?....apart from your other erroneous claims?...
BTW, you keep showing nothing more than ignorance in this topic, that sharp increase in the 1970s does not follow a trend that ends in the 1970s...you have to look at the trend...and what you showed is a rendering by hand of the data... The image I gave is the data itself, and not a representation by hand of the data...
Again, this is what a scientist has to say about the TSI, and not what you CLAIM. Obviously you are not as informed about this topic as you tried to claim earlier on....
Sun's Output Increasing in Possible Trend Fueling Global Warming
By Robert Roy Britt
Senior Science Writer
posted: 02:30 pm ET
20 March 2003
In what could be the simplest explanation for one component of global warming, a new study shows the Suns radiation has increased by .05 percent per decade since the late 1970s.
The increase would only be significant to Earth's climate if it has been going on for a century or more, said study leader Richard Willson, a Columbia University researcher also affiliated with NASA's Goddard Institute for Space Studies.
www.space.com...
BTW, once again yes the trend had been an increase in the Sun's overall activity even before the 24 year research led by Willson which started in 1978 and ended in 2002, and in which he states the TSI had been increasing by 0.05% per decade.
One more thing you obviously are not aware of, as far as we know the Sun constitutes 98.99% of all matter in the Solar System.
So the Sun is the biggest factor in the Solar System which affects Climate Change, after that is the oceans which retain more heat than the atmosphere does, and the oceans are Earth's great heat storage.
During periods of increased solar activity the oceans absorb, and retain more heat, and it takes a lot longer for the oceans to lose this stored heat than it does for the atmosphere.
The regions of space through which the Solar Sytem goes through influences the climate also, and if the changes in the region of space the Solar System goes through is large enough, then this will affect the Sun and the dynamics of the Solar System which in turn affects the climate.
Then after the oceans, water vapor is a major factor, and the last tidy bity factor which is minimal is CO2.
[edit on 5-8-2009 by ElectricUniverse]
Originally posted by ElectricUniverse
reply to post by rnaa
For crying out lout you make this statement even after you claim that less Sunspots means the Sun gets hotter and more Sunspots means the Sun gets cooler when it is the contrary?....
You got me on that one. I missed typed myself. Hey it was three in the morning here.
My other stuff stands. You don't know what you are talking about. Please read the Foukal paper linked above. Even if you all you do is look at the pretty pictures you can see that they are addressing exactly what you say they are not.
See also Damon Laut 2004. This points out errors in graphs that you are apparently relying on. Note that the errors are not fraudulent, just wrong. And many papers and textbooks have spread the error in the graph. But other data has passed it by anyway. You need to start looking at more recent data, like that shown in Foukal.
Finally, the temperature rise does continue. This paper shows why over-analysis of a short period is dangerous. And these are not hand drawn graphs. And there is also this result from the UK.
And I'm done. This is so far off topic its crazy.
The ACS is NOT "rejecting man-made climate fears", SOME members are having a political falling out with the journal editor.
[edit on 5/8/2009 by rnaa]
[edit on 5/8/2009 by rnaa]
[edit on 5/8/2009 by rnaa]
[edit on 5/8/2009 by rnaa]
reply to post by audas
The argument is using selective evidence.
Do the letters examined represent the entire population of letters recieved? NO If the AGW view is prevalent in ACS, why hasn't the AGW expressed support of Baum’s article been overwhelming? “The editor now admits he is “startled” by the negative reaction from the group’s scientific members....” Surely if he had received positive letters those would have been in the majority of the letters SELECTED for publication. Instead it is the negative reception that dominate the Letter to the Editor columns. All six columns. One person on another blog pointed out that some of the positive letters were REBUTTALS of the other letters. This indicates Baum had to have shown the negative letters to others and encouraged them to write the positive letters so he had them to publish!
Baum wrote “Some of the letters I received are not fit to print. Many of the letters we have printed are, I think it is fair to say, outraged by my position on global warming,”. Even baum who has ALL the letters does not agree with you.
You are saying there are only FOUR letters explicitly skeptical of AGW So lets look at other Chemists expressing their opinions in a blog.
Gail Combs
Gary Lund
Here is the letter Not published by Baum.
myrick
Alan Wilkinson
Nogw
GaryB
Roger Sowell
R Shearer
I could continue but I will not waste my time on another post.
so I went to the source and counted the number of responses that disagree with his position - and the number was FOUR. All the rest of the response were either regarding DIFFERENT topics all together, were upset with the correlation to to holocaust victims in the use of the word "deniers" or the majority of topics were actually AGREEING WITH HIM. So you ahve actually posted evidence which points to the exact opposite of what you are claiming - which makes you a LOON and highly amusing.
The argument is using selective evidence.
Do the letters examined represent the entire population of letters recieved? NO If the AGW view is prevalent in ACS, why hasn't the AGW expressed support of Baum’s article been overwhelming? “The editor now admits he is “startled” by the negative reaction from the group’s scientific members....” Surely if he had received positive letters those would have been in the majority of the letters SELECTED for publication. Instead it is the negative reception that dominate the Letter to the Editor columns. All six columns. One person on another blog pointed out that some of the positive letters were REBUTTALS of the other letters. This indicates Baum had to have shown the negative letters to others and encouraged them to write the positive letters so he had them to publish!
Baum wrote “Some of the letters I received are not fit to print. Many of the letters we have printed are, I think it is fair to say, outraged by my position on global warming,”. Even baum who has ALL the letters does not agree with you.
You are saying there are only FOUR letters explicitly skeptical of AGW So lets look at other Chemists expressing their opinions in a blog.
Gail Combs
I was a member of ACS for over 30 years. I let my subscription lapse because ACS increasingly jumped on the “politically correct” bandwagon....
Gary Lund
“As a dues paying member of the ACS for over 30 years, I had had enough of Rudy Baum’s pro-alarmist editorials (the June 22 episode was not the first) and fired off a protesting letter of my own. Perhaps I was late to the party or the response was simply overwhelming but I was thanked for my letter and iniformed that unfortuantely the editor determined it would not be printed...I would guess this happened to many others as well implying the revolt was most likely more massive in scale than revealed by the printed responses. Not one of my colleagues buys into the AGW hypothesis and I suspect that this is probably the rule rather than the exception..”
Here is the letter Not published by Baum.
Dear Editor,
In a recent editorial in the June 22, 2009 issue of C&EN entitled “Climate-Change News”, Rudy Baum opines that “the science of anthropogenic climate change is becoming increasingly well established” and that the scientific consensus on the reality of climate change has become increasingly difficult to challenge…..” I find these statements interesting in view of my own experience investigating this admittedly emotionally charged subject inasmuch as I have arrived at precisely the opposite conclusion. Having recently been prompted to explore the whole anthropogenic global warming/climate change controversy by increasingly frequent claims of scientific consensus, I have personally been unable to find a satisfactory scientific study supporting a anthropogenic CO2 (or related “green house gas” emission) causal link to global temperature changes. Instead, the literature seems to be well populated with studies which implicitly assume an anthropogenic cause for climate change and proceed to address whatever effect being reported upon might result....
myrick
“As a long time member of ACS, I have found this editor increasingly annoying. He finally stepped over the line. What is so irritating is the AGW crowd keeps asserting that “deniers” – are denying that the climate changes. No, we don’t we just assert that they don’t have proof of the cause. But Baum goes right back to it in this issue talking about sea ice as proof of why so many of his members are “wrong.” Chemistry is above all an experimental science and those who author pieces like this have no place in it.
Alan Wilkinson
.
With the other chemists who have posted here, I share the profound disgust at anti-science nonsense disgracing the good name of our profession
Nogw
It all began when some green idiot described something he/she supposed in his/her empty skull to be bad, as being “bad because it is a chemical“. Could some one of those green donkeys tell me what in the world, including them, is not chemical? So, we chemists, are the bad guys, the same as polluters (morons´killers). Included in those chemical non sense are those supposed “organical” products, these, supposedly again, not considered “chemicals”, so…LOL, a mineral KNO3 is called “organical” and the same KNO3, from a chemical company, it is not “organical”, which is the difference? And..the CO2 nonsense…the same kind of “urban myth”, to say the least.
GaryB
I was a member of the ACS from 1994 to 2009. After sending in several letters to the editor complaining of this Rudy Baum and his liberal slant to the “scientific” publication, I finally gave up. I complained to the President of the ACS and others but never received a response. I finally fiquit the ACS because I refuse to support an organization that has overstepped its boundaries. The ACS is NOT supposed to be a political organization. It is supposed to be a scientific organization. I hope that all those ACS members that are fed up with Rudy Baum and his ilk do as I did…quit the ACS.
Roger Sowell
This is excellent! I am not at all surprised by the tone and intensity of the response letters to C&EN’s editor. Many chemical engineers are also member of ACS. The chemical engineers and chemists I meet with regularly, and speak to occasionally, are very much skeptics of any man-made influence on climate. The undeniable fact that CO2 rises regularly, while global temperature oscillates is sufficient proof that there is absolutely no validity to the IPCC’s claims, and that there is zero reason to modify fossil fuel use. When I give my speeches, chemical engineers and chemists in the audience recognize this instantly. One of the world’s most prominent chemical engineers, Dr. Pierre R. Latour, PE, started a similar uproar in Hydrocarbon Processing magazine in January, 2009. His letter to the editor may be found here: /nutznq. Hydrocarbon Processing is one of the two most-respected industry journals read world-wide among chemical engineers and energy professionals.
R Shearer
I’m a Ph.D. chemist and 26 year ACS member. I began doubting AGW about 3 years ago when President Bush jumped aboard the bandwagon. More than anything, I can’t comprehend the “it’s settled” attitude from anyone with a scientific background. Rudy Baum’s opinions burn me up sometimes. Now it appears that he and ACS are neither good for chemists or America. Each year ACS raises dues by a few dollars to help offset loss in membership and journal subscription revenue. What do we get besides a weekly chemical propaganda magazine and a cheap 25th anniversary pen? It saddens me that my dues are really just supporting the jet setting fat cats of ACS, like Baum. For me this settles it. I’m going to contact ACS tomorrow and ask if I can get a prorated refund for canceling my membership now instead of at the end of the year. Then I’ll explain that Rudy Baum is the reason why I can no longer support ACS.
I could continue but I will not waste my time on another post.
new topics
-
Kirkpatrick vs Fugal - Skinwalker ranch briefing.
Aliens and UFOs: 45 minutes ago -
Lemon-aid and lime-aid
General Chit Chat: 1 hours ago -
Multipal Solar Storms Coming Our Way This Weekend
Fragile Earth: 1 hours ago -
US food sources declining becoming non edible .
Social Issues and Civil Unrest: 3 hours ago -
Journalism Against Judaism
Middle East Issues: 9 hours ago
top topics
-
Bibi’s Dilemma
Middle East Issues: 13 hours ago, 11 flags -
Proof of Cleptocracy
US Political Madness: 17 hours ago, 10 flags -
Journalism Against Judaism
Middle East Issues: 9 hours ago, 4 flags -
US food sources declining becoming non edible .
Social Issues and Civil Unrest: 3 hours ago, 4 flags -
Multipal Solar Storms Coming Our Way This Weekend
Fragile Earth: 1 hours ago, 4 flags -
Lemon-aid and lime-aid
General Chit Chat: 1 hours ago, 2 flags -
Kirkpatrick vs Fugal - Skinwalker ranch briefing.
Aliens and UFOs: 45 minutes ago, 1 flags
active topics
-
Kirkpatrick vs Fugal - Skinwalker ranch briefing.
Aliens and UFOs • 1 • : NoCorruptionAllowed -
Lemon-aid and lime-aid
General Chit Chat • 6 • : randomtangentsrme -
Multipal Solar Storms Coming Our Way This Weekend
Fragile Earth • 8 • : rickymouse -
Ooooh...it worked!!
Members • 25 • : LandofEnchantment -
Candidate TRUMP Now Has Crazy Judge JUAN MERCHAN After Him - The Stormy Daniels Hush-Money Case.
Political Conspiracies • 1452 • : CarlLaFong -
Israeli strikes on southern Gaza city of Rafah kill 22, mostly children, as US advances aid package
Middle East Issues • 204 • : KrustyKrab -
US food sources declining becoming non edible .
Social Issues and Civil Unrest • 17 • : rickymouse -
Judge Postpones Trump Classified Docs Trial INDEFINITELY
US Political Madness • 169 • : chr0naut -
Boy Scouts to be renamed next year
Other Current Events • 186 • : GENERAL EYES -
Social Security projected to cut benefits in 2035 barring a fix
Global Meltdown • 47 • : BernnieJGato